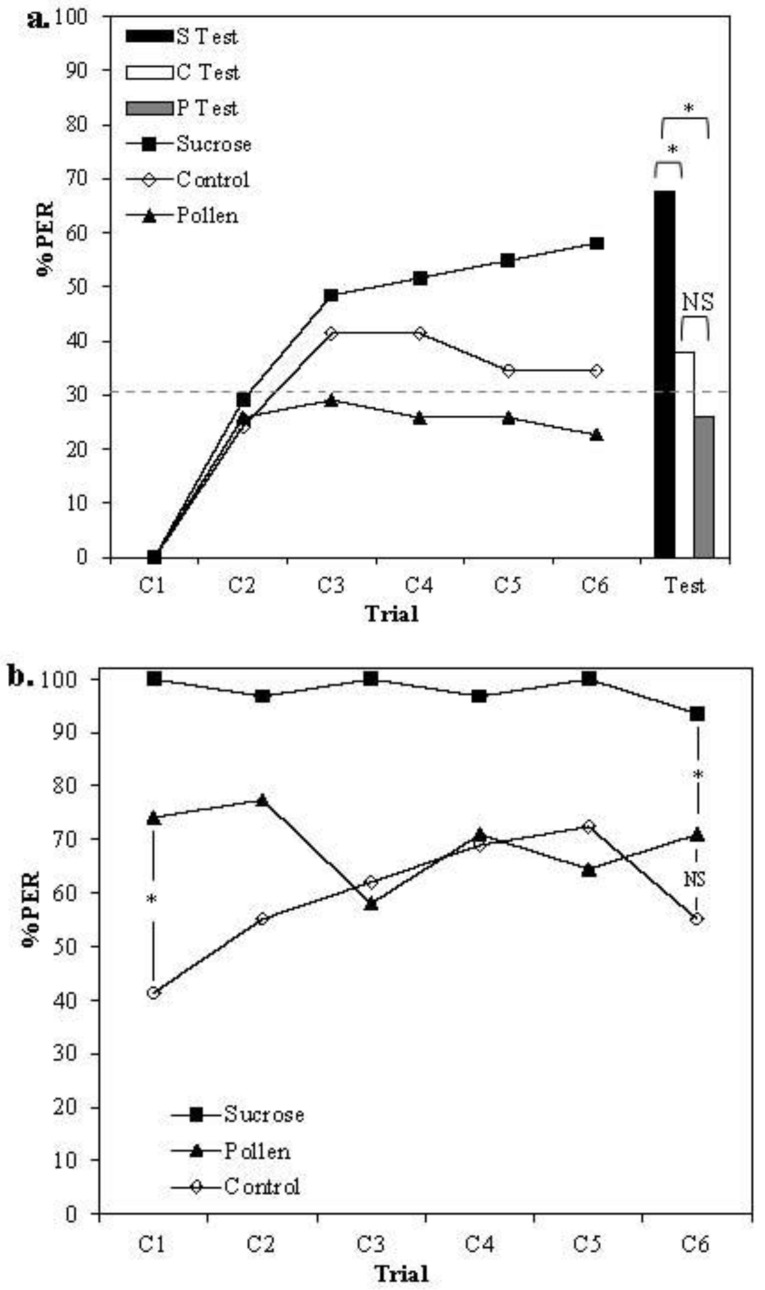
Figure 1.
(a) Acquisition curves and (b) PER response to US stimulation of bees rewarded at the antennae only with 30% sucrose solution (Black squares, n = 31), dry pollen (Black triangles, n = 31) or a clean sponge (Open diamonds, n = 29). Bars represent the number of bees responding to the conditioned stimulus (CS) in the final, unrewarded test (Black = Sucrose, White = Control, Grey = Pollen). Dashed line represents the overall spontaneous response to the CS on the first trial for all bees tested. Asterisks denote significant differences between treatment groups (** p <0.001 * p <0.05).

