Significance
The performance of conventional carbon-supported catalysts is strongly influenced by the support morphology, which contains micropores, mesopores, and macropores. Whereas micropores host the majority of the active sites and macropores promote effective reagent/product mass transfer, mesopores contribute a limited role in both but occupy a significant fraction of the total pore volume. For catalytic applications where maximizing active site number and mass/charge transports with the highest possible catalyst density is essential, conventional carbon supports are no longer suitable. In this paper, we introduce a previously unidentified catalyst’s morphology with a high catalytic active surface concentrated nearly exclusively in micropores while transferring reactant/product via a macroporous nanofiber framework. The nonprecious metal catalyst with such architecture demonstrated unprecedented activity in fuel cell tests.
Keywords: nanofibrous, nonprecious metal catalyst, metal–organic framework, fuel cell, oxygen reduction
Abstract
Fuel cell vehicles, the only all-electric technology with a demonstrated >300 miles per fill travel range, use Pt as the electrode catalyst. The high price of Pt creates a major cost barrier for large-scale implementation of polymer electrolyte membrane fuel cells. Nonprecious metal catalysts (NPMCs) represent attractive low-cost alternatives. However, a significantly lower turnover frequency at the individual catalytic site renders the traditional carbon-supported NPMCs inadequate in reaching the desired performance afforded by Pt. Unconventional catalyst design aiming at maximizing the active site density at much improved mass and charge transports is essential for the next-generation NPMC. We report here a method of preparing highly efficient, nanofibrous NPMC for cathodic oxygen reduction reaction by electrospinning a polymer solution containing ferrous organometallics and zeolitic imidazolate framework followed by thermal activation. The catalyst offers a carbon nanonetwork architecture made of microporous nanofibers decorated by uniformly distributed high-density active sites. In a single-cell test, the membrane electrode containing such a catalyst delivered unprecedented volumetric activities of 3.3 A⋅cm−3 at 0.9 V or 450 A⋅cm−3 extrapolated at 0.8 V, representing the highest reported value in the literature. Improved fuel cell durability was also observed.
Polymer electrolyte membrane fuel cells (PEMFCs) electrochemically convert the chemical energy of hydrogen and oxygen to electricity while producing water as a byproduct. They have significantly higher power and energy densities than the competing electrochemical devices, such as Li-ion batteries and supercapacitors, and represent the only all-electric technology with a demonstrated cruising range of over 300 miles between refueling (1). Current PEMFCs use platinum as a catalyst to promote an oxygen reduction reaction (ORR) at the cathode and a hydrogen oxidation reaction at the anode. The Pt use at the cathode is typically three to four times more than that at the anode to overcome the kinetically more sluggish ORR. Because platinum is expensive and there are limited worldwide reserves, technologies that could substantially reduce or replace its use have to be realized before widespread PEMFC commercialization. Nonprecious metal catalysts (NPMCs) represent one such technology.*
Among NPMCs, transition metal (TM) and N-doped carbonaceous composites (TM/N/Cs) have demonstrated promising ORR catalytic activities in both acidic and alkaline media, whereas TM-free composites (N/Cs) showed activities primarily in an alkaline medium (2–17). The initial discovery of ORR catalytic activity by N-ligated cobalt was reported half a century ago (18). However, it was not until recently that breakthrough performances were achieved (19–23). New surface property and synthesis strategies for continuously improving catalytic activity were also identified. For example, Lefèvre and coworkers identified the importance of micropores as the hosts of the catalytic sites formed during pyrolysis (24–26) and found that the ORR catalytic activity can be significantly enhanced by infiltrating the N-coordinated iron complex within the micropores (pore diameter <2 nm) of the carbon support (19). More recently, several new synthetic approaches were also explored to produce high catalytic active site density decorated within the micropores using rationally designed zeolitic imidazolate frameworks (ZIFs) and porous organic polymers (POPs) (14, 20–22, 27).
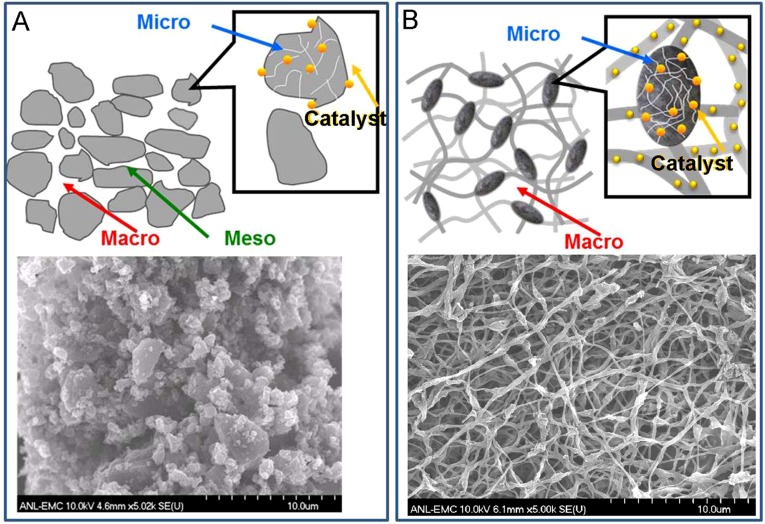
Whereas the micropore is critically important in hosting active site for ORR, the catalyst should also contain a sufficient amount of macropores (pore size >50 nm) to ensure the effective mass transfer of both reactant (O2) and product (H2O) to and from the active sites with minimal resistance throughout the entire electrode layer. Furthermore, efficient charge transfer of H+ and e− to the active sites must also be established to fully use the catalyst in different electrode depths and to reduce the cell impedance. The improvements of mass and charge transports directly result in the reduction of the associated overpotentials, therefore lowering the efficiency penalties. These multifaceted requirements for catalyst morphology render the conventional carbon support no longer adequate for the ideal NPMC design. In a conventional amorphous carbon support, the micropores reside inside of primary carbon particles with the dimensions of a few tenths of a nanometer. These carbon particles agglomerate together by van der Waals force to a large cluster forming the mesopores (pore diameter 2∼50 nm) in the space between them. The macropores are generated by the voids through further stacking of these clusters (Fig. S1A). The mesopores, while serving as the secondary passage between the gas phase to catalytic site in micropores, create additional tortuosity, thus mass-transfer resistance within each cluster. Mesopores also have much higher volume-to-surface area ratios than the micropores. Therefore, they add substantial volume to the catalyst and reduce the electrode volumetric current density. Furthermore, the oxidative corrosion during fuel cell operation could reduce the primary carbon particle size, causing the loss of electric contact between the particles and the increase of the overall cell impedance. In an ideal catalyst structure, the active sites should be densely populated inside of the micropores. The reactant/product should transfer directly to and from these active sites through macropores with minimal transport resistance. The micropores should also be connected through a continuous conductive matrix robust against the corrosion-induced conductivity loss. In such a design, the mesopores are no longer necessary.
Fig. S1.
Comparison on the morphologies of (A) conventional carbon support and (B) nanonetwork catalyst.
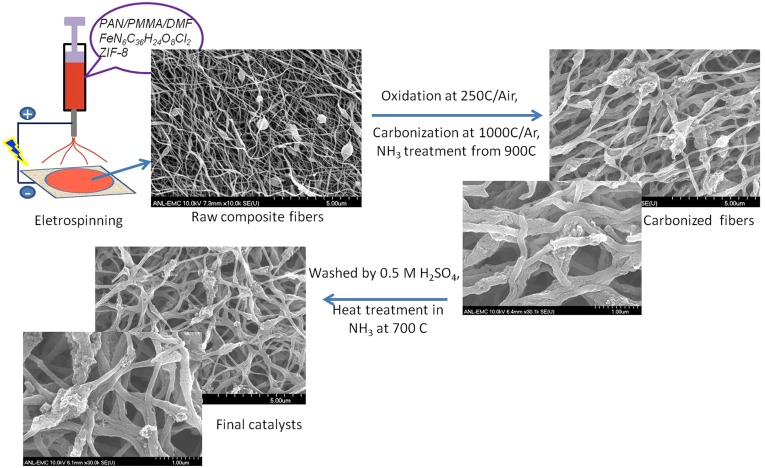
Herein, we present a rationally designed, interconnected porous nanonetwork catalyst (Fe/N/CF) prepared by electrospinning a polymer solution containing Tris-1,10-phenanthroline iron(II) perchlorate (TPI) and ZIFs, a subgroup of metal–organic frameworks (MOFs), followed by posttreatments (Fig. S2). The network structure facilitates the mass transfers through its macroporous voids between the interconnected nanofibers. More importantly, each nanofiber was predominantly microporous, containing uniformly and densely dispersed catalytic sites throughout the fiber (Fig. S1B). Such a catalyst delivered an unprecedented volumetric activity of 450 A⋅cm−3 extrapolated at 0.8 ViR-free or measured volumetric current densities of 0.25, 3.3, and 60 A⋅cm−3 at 0.95, 0.9, and 0.8 ViR-free, respectively, when tested in a single cell under the standard test condition established by the US Department of Energy (28).
Fig. S2.
The schematic diagram of Fe/N/CF synthesis by electrospinning. The spun composite fibers contain uniformly mixed polymer, TPI salt, and ZIF-8 nanoparticles. The fibrous nanonetwork retains its morphology after pyrolysis, acid wash, and posttreatment.
Results
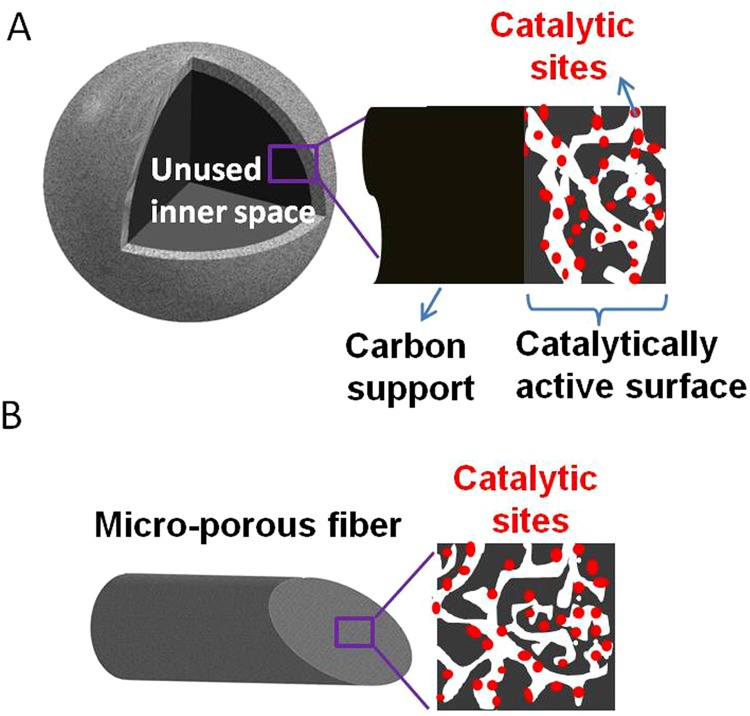
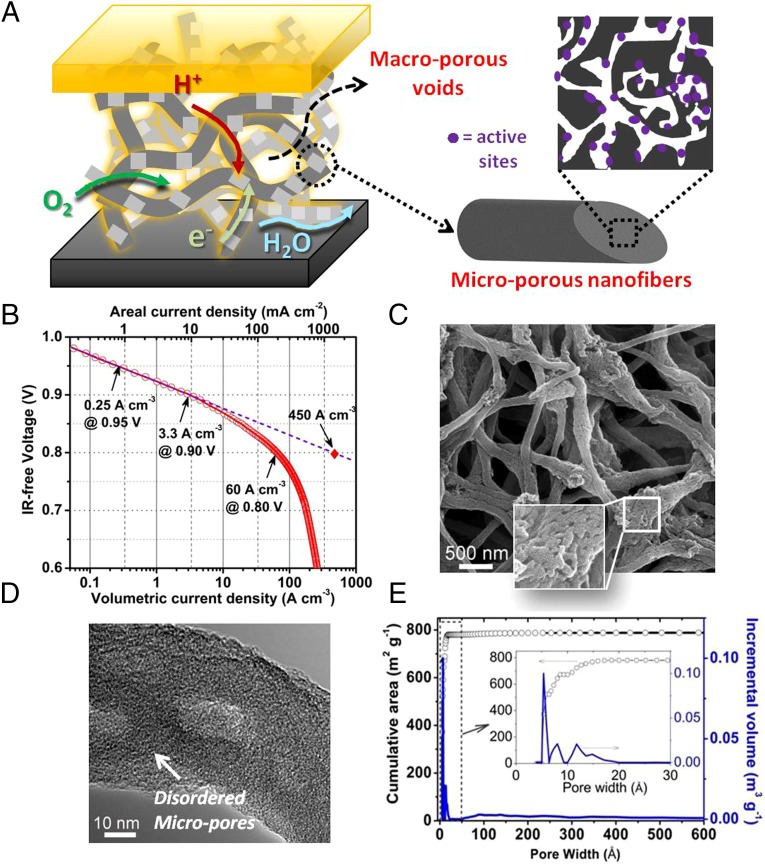
Conventional approaches of preparing NPMC generally start by applying the carbon support with the active ingredients such as N-ligated transition metal compound followed by activation. The carbon support itself is catalytically inactive. Furthermore, dispersing ingredient through wet chemistry has only limited access to the micropores of the carbon particle and therefore produces lower active site density (Fig. S3). We classify such approaches as “type I.” The newly developed approaches apply the precursors with porous frameworks built either by forming metal–ligand coordination such as that found in ZIFs or by cross-linking metallated monomers such as that found in POPs. These precursors do not use additional carbon support (“support-free”) and therefore have the potential to reach the highest catalytic site density and volumetric activity. We classify these approaches as “type II.” We compared several high-performance NPMCs of types I and II from the literature, and their volumetric current densities (directly measured) and specific activities (extrapolated) at 0.8 ViR-free are listed in Table S1. The Fe/N/CF catalyst in this study represents an improved type II system with a previously unidentified nanonetwork morphology. Not only does it hold high-density, active site decorated micropores to catalyze a reaction within individual nanofibers, but it also contains macroporous voids between the nanofibers to effectively transport the reactant and product to and from the active sites. A continuous carbon nanofibrous network conducts the electrons, whereas a thinly coated ionomer shuttles the protons to the active sites efficiently (Fig. 1A). Such a Fe/N/CF catalyst was fabricated into the cathode of a membrane electrode assembly (MEA) and tested under fuel cell operating conditions. The Tafel plot obtained from the iR-free fuel cell voltage-current polarization measurement (Fig. 1B) shows the areal current densities of 0.75 mA⋅cm−2 at 0.95 ViR-free, 10 mA⋅cm−2 at 0.9ViR-free, and 182 mA⋅cm−2 at 0.8ViR-free, which can be converted to the volumetric current densities of 0.25, 3.3, and 60 A⋅cm−3 at the corresponding potentials, respectively. To compare with the previously published results (19, 20, 29), a volumetric activity was also obtained by extrapolating the current density from the linear region (the kinetic control region) and a unprecedented value of 450 A⋅cm−3 was achieved at the intersect of 0.8 ViR-free.
Fig. S3.
(A) Schematic interpretation of type I catalysts that have an active layer supported on the inert carbon core with unutilized inner space. (B) Schematics of the catalytic site distribution inside micropores of Fe/N/CF fiber, representing an improved type II catalyst with uniformly distributed active sites throughout the catalyst body.
Table S1.
Volumetric current densities and specific activities of several representative Type I and II catalysts
| Source | Fig. no. | Sample identifier | Catalyst type (I or II) | NPMC loading, mg/cm2 | O2/H2 absolute pressure, bar | Reported original mass (A/g) or areal (mA/cm2) or volumetric (A/cm3) current density at 0.8 V | Reported extrapolated mass (A/g) or areal (mA/cm2) or volumetric (A/cm3) current density at 0.8 V | Normalized volumetric current density (measured at 0.8ViR-free, H2/O2 is 1 bar), A/cm3 | Normalized volumetric activity (extrapolated at 0.8ViR-free, H2/O2 is 1bar), A/cm3 |
| 8 | 8 | Impregnation NCR2 | I | 1 | 1.5/1.5 | 16† | 25 | 3.5‡ | 5.5 |
| 10 | 2 | A 100% NH3 | I | 1 | 1.5/1.5 | 22† | 30 | 5.2‡ | 7.1 |
| 11 | 8 | BP_CV1 | I | 1 | 2.56/2.56 | 39† | 88 | 4.6‡ | 10.5 |
| 15 | 6 | (D) | I | 1 | 1.5/1.5 | 3† | 3 | 0.7‡ | 0.7 |
| 16 | 6 | (d) | I | 3.8 | 1.5/1.5 | 24§ | 24 | 1.5¶ | 1.5 |
| 19 | 2 | Large open circles | I | 1 | 1/1 | 18‖ | 99 | 18‖ | 99 |
| 8 | 10 | Ball milling NCR2 | II | 1 | 1.5/1.5 | 66† | 187 | 16‡ | 44 |
| 17 | 6 | II | 1.6 | 2/2 | 12‖ | 18 | 4.9†† | 7.4 | |
| 20 | 3 | Stars | II | 1 | 1/1 | 37‖ | 230 | 37‖ | 230 |
| 21 | 3 | II | 4 | 1/1 | 20‖ | 130 | 20‖ | 130 | |
| 22 | S6 | Zn(eIm)2TPI | II | 2.2 | 1/1 | 52‖ | 146 | 52‖ | 146 |
| 27 | S5 | 10/90 | II | 1 | 1.5/1.5 | 132† | 262 | 31‡ | 62 |
| This work | 1 | II | 2 | 1/1 | 60‖ | 450 | 60‖ | 450 |
where P*O2 and P*H2 are the reference pressures (1 bar). ρeff is the effective density of carbon-based, porous NPMC electrode, which is set at 0.4 g/cm3 (19). αc is the cathodic transfer coefficient and is assumed to be 1.
Reported mass activity.
Normalized volumetric current density is converted from the reported mass activity based on the equation above.
Reported areal activity.
Normalized volumetric current density is converted from the reported areal activity based on the equation above.
Reported volumetric activity.
Normalized volumetric current density is converted from the reported data based on the equation above.
Fig. 1.
The nature of Fe/N/CF catalyst, its volumetric activity in a PEM fuel cell, and its distinct micropore–macropore architecture. (A) A schematic drawing of macropore–micropore morphology and charge/mass transfers in the nanofibrous network catalyst, Fe/N/FC, at the fuel cell cathode. (B) Tafel plot for the kinetic activity of Fe/N/CF obtained from a single fuel cell test. The volumetric current densities (bottom x axis) at 0.95, 0.9, and 0.8 ViR-free were derived by dividing the measured areal current densities (top x axis) over the cathode layer thickness, which was 30 µm in this case. The value of the extrapolated volumetric current density at 0.8 ViR-free was also provided. For the fuel cell test, the cathode catalyst loading was 2.0 mg⋅cm−2 with ionomer-to-catalyst weight ratio (I/C) = 1/1. The membrane was Nafion N117. Cell and fuel gas temperatures were maintained at 80 °C. The O2 and H2 absolute pressures were at 1 bar with total pressure of 1.5 bars at each electrode, including ∼0.5 bar water vapor pressure under 100% relative humidity (RH) at 80 °C. (C) SEM image of the Fe/N/CF nanonetwork catalyst. (D) High-resolution TEM image of a thin catalyst fiber. (E) BET isotherm analyses on cumulative surface area and incremental pore volume as the functions of pore size in Fe/N/CF.
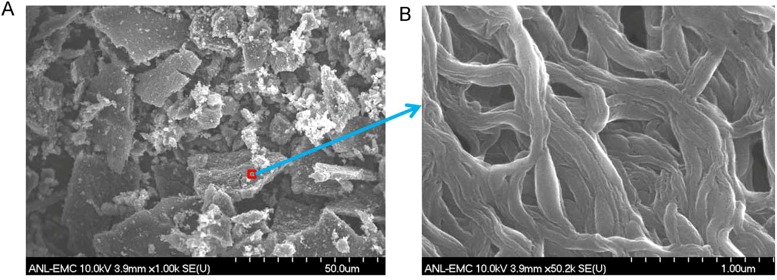
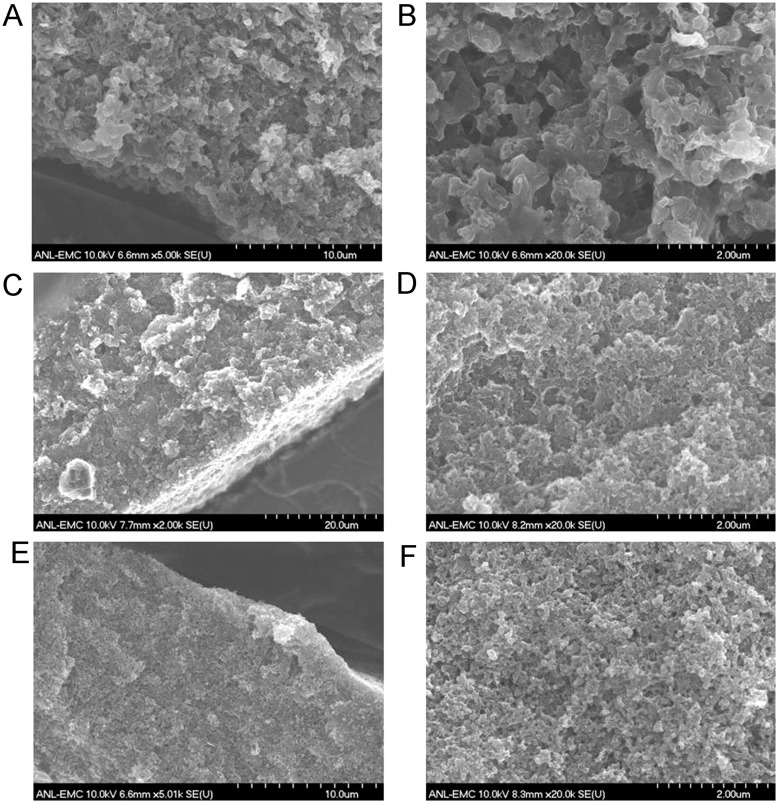
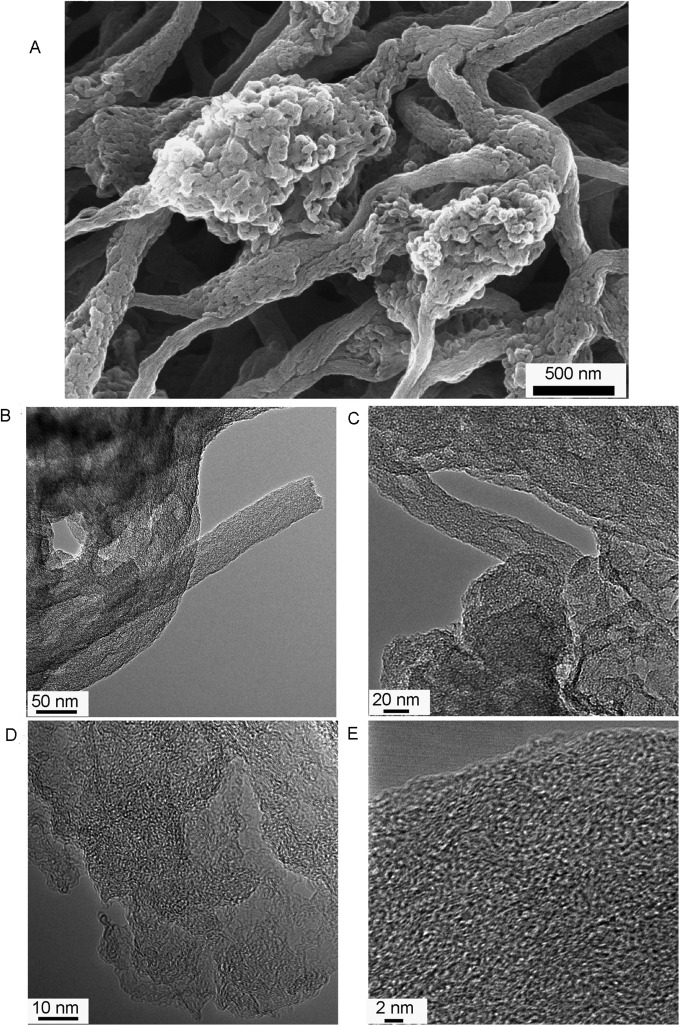
Fig. 1C shows a typical network structure of Fe/N/CF with 0.5∼1 μm size voids between the fibers. We found that a significant fraction of these voids could be retained in the electrode during the MEA fabrication process (Fig. S4) in which Fe/N/CF was blended into a catalytic ink with Nafion solution before being pressed onto the carbon paper as the cathode. Such electrode has a different architecture from those made from the traditional carbon supports (Fig. S5). Individual fibers in the network are on average 100∼200 nm in diameter with some larger “beads” forming on the “string.” These beads have a chemical composition similar to that of the string and are actually highly porous, containing tens of nanometers “holes,” enabling efficient gas passage within them (Fig. 1C, Inset and Fig. S6A). High-resolution transmission electron microscopy (TEM) images, as displayed in Fig. 1D and Fig. S6 B–E, show that the carbon has a homogeneously amorphous texture inside both fibers and beads, which is distinctly different from the conventionally electrospun carbon nanofibers that tend to have a graphitic lattice and are generally nonporous (30). This unique disordered carbon structure was likely formed as the result of the interaction between the polymer matrix and ZIF during carbonization. The observation also indicates that ZIF microcrystallites were thoroughly blended in the electrospin mixture and the active sites formed through thermolysis were uniformly dispersed in both string and beads, generating higher porosity and catalytic site density than the conventional graphitized carbon nanofiber catalyst.
Fig. S4.
Fe/N/CF after the final step of posttreatment. Although the large catalyst film formed during the electrospin was broken into micrometer-sized pieces after pyrolysis (A), the network structure was retained within each piece (B).
Fig. S5.
SEM images of the cross-sections of catalyst layers made with (A and B) Fe/N/CF, (C and D) Fe/N/KB, and (E and F) Pt/C. Large pores (0.5∼1 μm) were found in the Fe/N/CF catalyst layer, which facilitate oxygen and water transports. In contrast, the catalyst layers of nanoparticle catalysts (Fe/N/KB and Pt/C) were denser with much smaller pores (∼0.1 μm).
Fig. S6.
(A) SEM, (B and C) TEM, and (D and E) high-resolution TEM images of the Fe/N/CF catalyst.
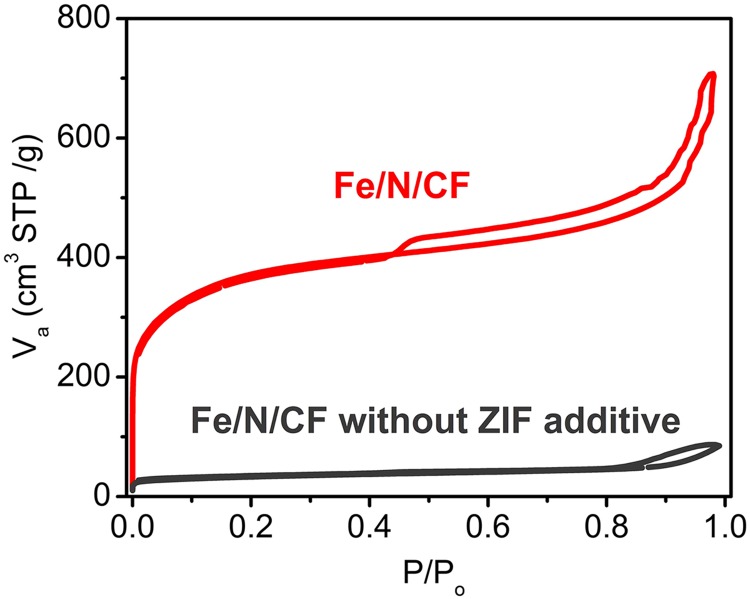
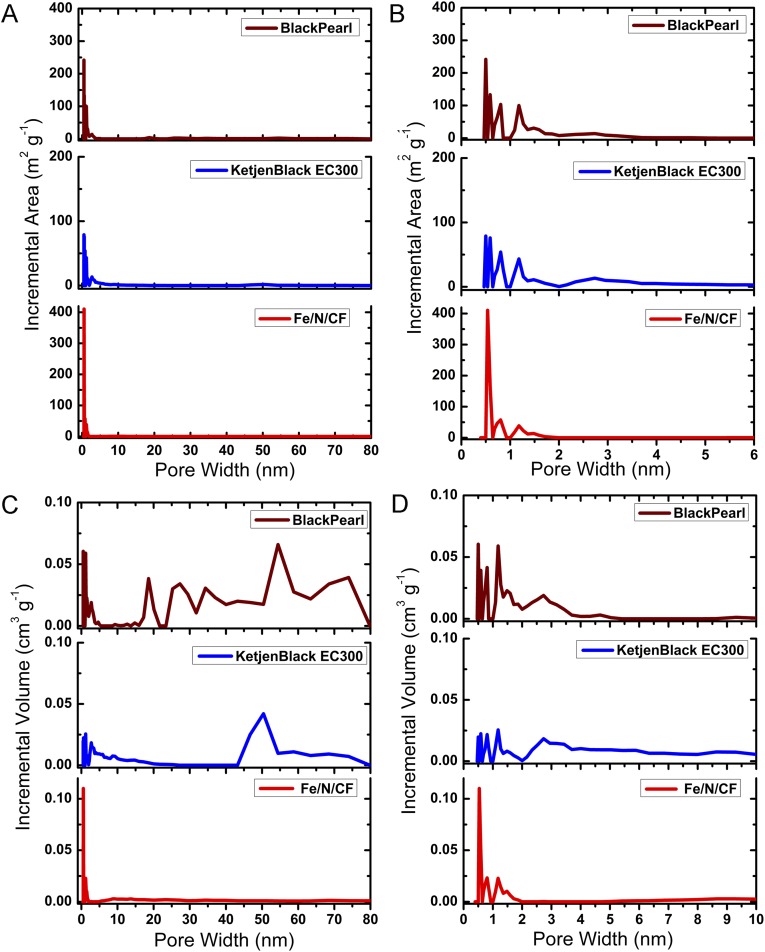
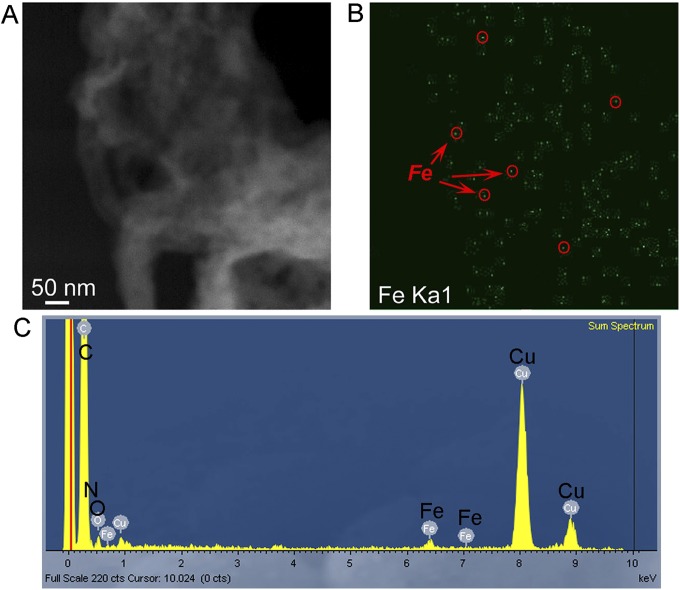
The highly microporous nature of the Fe/N/CF was further confirmed by Brunauer–Emmet–Teller (BET) measurement. BET isotherm derived from nitrogen adsorption at 77 K shows a total surface area of 809 m2⋅g−1 for Fe/N/CF, which is considerably higher than that of the control sample carbon nanofiber without ZIF (Fig. S7). Furthermore, the isotherm adsorption and pore size analysis of Fe/N/CF (Fig. S8) demonstrate the predominant presence of micropores. For example, among all of the pores with dimensions less than 50 nm, which include both micropores and mesopores, the micropores occupy 84% of total pore volume and 99% of total pore surface area, whereas mesopores occupy only 16% pore volume and 1% surface area, respectively (Fig. 1E and Table S2). Such micropore dominance is strikingly different from that of Black Pearl (BP) and Ketjenblack (KB), two commonly used amorphous carbon supports. For instance, the micropores in BP and KB only occupy 48% and 36% of the total pore volume of all of the pores with size <50 nm, respectively. However, their mesopores occupy more than half of the total pore volume while supplying less than a fifth of the surface areas (Table S2 and Fig. S8) (19–21). Microporosity has been previously found to directly correlate to the ORR catalytic activity (24, 31). The high mesoporosity of the conventional carbons occupies much of the volume yet contributes little to active site surface, and therefore limits their potential for achieving high volumetric activity. In contrast, Fe/N/CF contains predominantly micropores and therefore could achieve a high volumetric activity. Under the similar total surface area, the catalyst with higher microporosity has higher catalyst volumetric density than those with low microporosity. Although it is difficult to measure the Fe/N/CF fiber density directly, we did measure the Fe/N/CF catalyst layer in the membrane electrode and obtained a packing density of 0.66 g⋅cm−3 (Fig. S9). This value is at least 65% higher than that of the conventional carbon supports in the electrode, which are typically in the range of 0.3–0.4 g⋅cm−3 (19, 20). The micropores in Fe/N/CF are generated mainly by thermal conversion of ZIF during pyrolysis. They are decorated by the high-density N/C active centers produced from the pyrolyzed imidazolates, the molecular strut of the ZIF. The catalyst site distribution inside of Fe/N/CF is perhaps best schematically represented by Fig. 1A, which was also experimentally confirmed by the elemental mapping of iron (Fig. S10). Iron has been considered as part of the catalytic site and we found that it is finely and uniformly dispersed throughout the fibers.
Fig. S7.
The nitrogen adsorption isotherm curves of Fe/N/CF materials with or without ZIF-8 additive. The Fe/N/CF with ZIF-8 shows a typical isotherm dominated by micropores with a minor contribution by mesopores.
Fig. S8.
The comparisons of (A and B) BET surface area and (C and D) pore volume distribution as function of pore size between Fe/N/CF and amorphous carbon (Black Pearl and Ketjenblack EC300). In Fe/N/CF catalyst, the surface area and pore volume are predominantly distributed in the micropore region.
Table S2.
Specific surface areas and pore volume distributions of Fe/N/CF for pores of diameter <50 nm in Fe/N/CF, compared with two representative amorphous carbons
| Surface properties | Black Pearl | Ketjenblack | Fe/N/CF |
| BET, m2⋅g−1 | 1,432 | 798 | 809 |
| Surface area of pores ≤2 nm, m2⋅g−1 | 867 | 398 | 780 |
| Surface area of pores ≤50 nm, m2⋅g−1 | 960 | 507 | 788 |
| S≤2nm/S≤50nm, % | 90 | 78 | 99 |
| Total volume in pores ≤80 nm, cm3⋅g−1 | 0.955 | 0.508 | 0.330 |
| Volume of pores ≤2 nm, cm3⋅g−1 | 0.371 | 0.167 | 0.271 |
| Volume of pores ≤50 nm, cm3⋅g−1 | 0.766 | 0.463 | 0.323 |
| V≤2nm/V≤50nm, % | 48 | 36 | 84 |
Fig. S9.
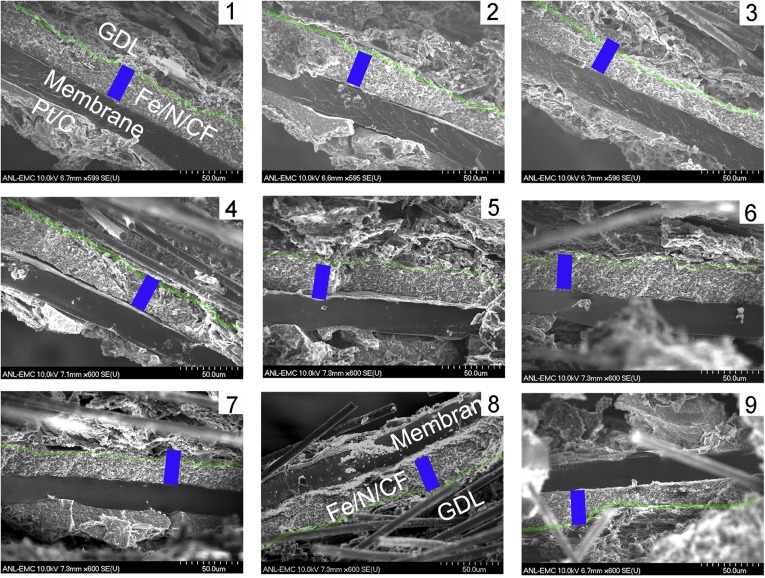
Direct measurement of the cathode catalyst layer thickness on an MEA with Fe/N/CF loading of 2 mg⋅cm−2. The ratio of I/C = 1/1. The sampling locations included the MEA's center, the edge, and the spots between the center and the edge. The average thickness of catalyst layer was 30 μm. The calculated gravimetric density was 0.66 gcatalyst⋅cm−3.
Fig. S10.
Iron distribution inside Fe/N/CF fiber. (A) STEM image of a section of Fe/N/CF fiber showing no iron particle agglomeration. (B) Mapping of Fe element distribution on the Fe/N/CF section shows iron intensity is proportional to the fiber thickness of catalyst, suggesting that Fe is uniformly and possibly atomically dispersed inside the fiber. (C) A representative EDX spectrum of the Fe/N/CF. The Fe signal could be detected ubiquitously on the fibrous catalyst.
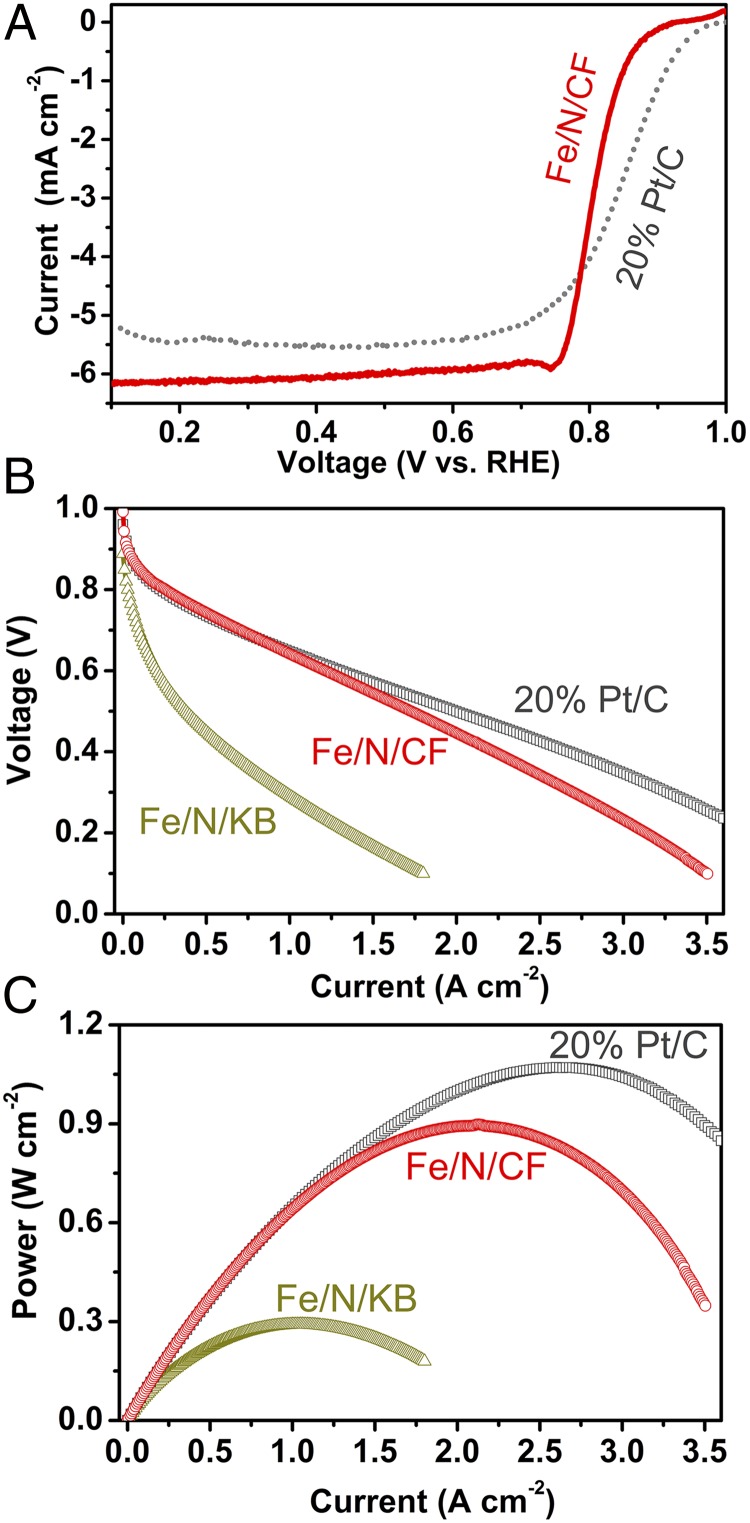
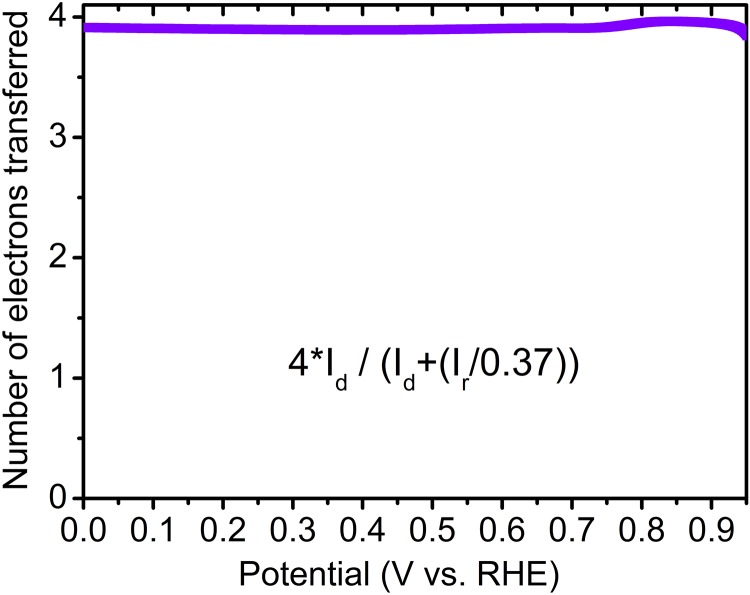
The electrocatalytic properties of Fe/N/CF were first measured by a rotating ring-disk electrode (RRDE) in oxygen saturated 0.5 M H2SO4. The linear sweep voltammetry showed a high onset potential of 0.93 V (defined as the voltage measured at the kinetic current of 0.01 mA⋅cm−2) and half-wave potential of 0.80 V (Fig. 2A). The number of transferred electrons was above 3.9 in the entire potential range from 0.95 V to 0 V (Fig. S11), suggesting nearly complete reduction of molecular oxygen to water by Fe/N/CF. These significant performances could be attributed to the combination of the high catalytic activity and efficient mass transfer of Fe/N/CF.
Fig. 2.
Electrochemical performance of Fe/N/CF network catalyst. (A) RRDE test on Fe/N/CF in O2 saturated 0.5 M H2SO4 compared with 20 wt % Pt/C. (B) Cell voltages and (C) power densities as the functions of the current density measured in the fuel cell tests with Fe/N/CF, Fe/N/KB or commercial 20 wt % Pt/C as the cathode catalyst. For Fe/N/CF and Fe/N/KB, the catalyst loadings were 3 mg⋅cm−2 with I/C = 1.5/1. For Pt/C, the cathode catalyst loading was 0.3 mg Pt⋅cm−2. In all three cases, the anode loading was 0.3 mg Pt⋅cm−2 prepared with 20 wt % Pt/C. Nafion 211 was used as the membrane. The absolute pressures of O2 and H2 were kept at 2 bars under 100% RH and the gas temperature was maintained at 80 °C.
Fig. S11.
The electron transfer number measured over Fe/N/CF by RRDE in 0.5 M H2SO4 shows close to 4 through the entire potential span. (Inset) The equation for calculating the number of transferred electrons. Id is the disk current and Ir is the Pt ring current.
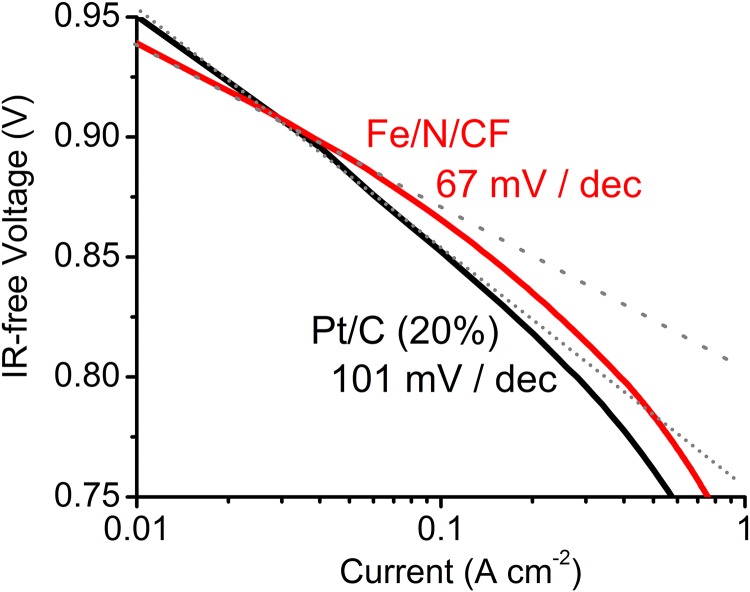
The superior catalytic performance of Fe/N/CF was further characterized by a fuel cell test. To demonstrate the performance improvement over the conventional electrode structure, an amorphous carbon supported catalyst (Fe/N/KB) was also synthesized by applying similar amounts of ZIF and TPI over a carbon black (Ketjenblack, KB-300). The polarization curve of Fe/N/CF shows the current densities of 0.25 A⋅cm−2 at 0.8 V and 3.5 A⋅cm−2 at 0.1 V, significantly higher than that of 0.03 A⋅cm−2 and 1.8 A⋅cm−2 observed for Fe/N/KB at the corresponding potentials (Fig. 2B). The current-voltage polarization profile of Fe/N/CF matches well with that of 20 wt % Pt/C in the potential range >0.6 V. The associated Tafel plots (indicating the rate of an electrochemical reaction to the overpotential) demonstrate a decay rate of 67 mV⋅decade−1 for Fe/N/CF, which is better than 101 mV⋅decade−1 for 20 wt % Pt/C (Fig. S12). In the higher current (low potential) region, however, the Fe/N/CF curve falls off faster than that of 20 wt % Pt/C. The cell with Fe/N/CF as cathode also shows excellent humidity management and maintains a smooth polarization curve even at the highest current density without any sign of “flooding.” The peak power density of Fe/N/CF is nearly 0.9 W⋅cm−2, whereas Fe/N/KB reaches only ∼0.3 W⋅cm−2 (Fig. 2C).
Fig. S12.
Tafel plot derived from linear polarization scan on the cells in Fig. 2B. For Fe/N/CF, the catalyst loadings were 3 mg⋅cm−2 with I/C = 1.5/1. For Pt/C, the cathode catalyst loading was 0.3 mg Pt⋅cm−2, I/C = 1/1. In both cases, the anode loading was 0.3 mg Pt⋅cm−2 prepared with 20 wt % Pt/C. Membrane: N211; O2/H2 pressures: 2 bars; 100% RH; cell temperature: 80 °C.
Optimized catalyst loading was between 2∼3 mg⋅cm−2 for Fe/N/CF. We carefully investigated any potential Pt contamination over the NPMCs cathodes during MEAs preparation and after testing. No Pt was found in the cathode region.
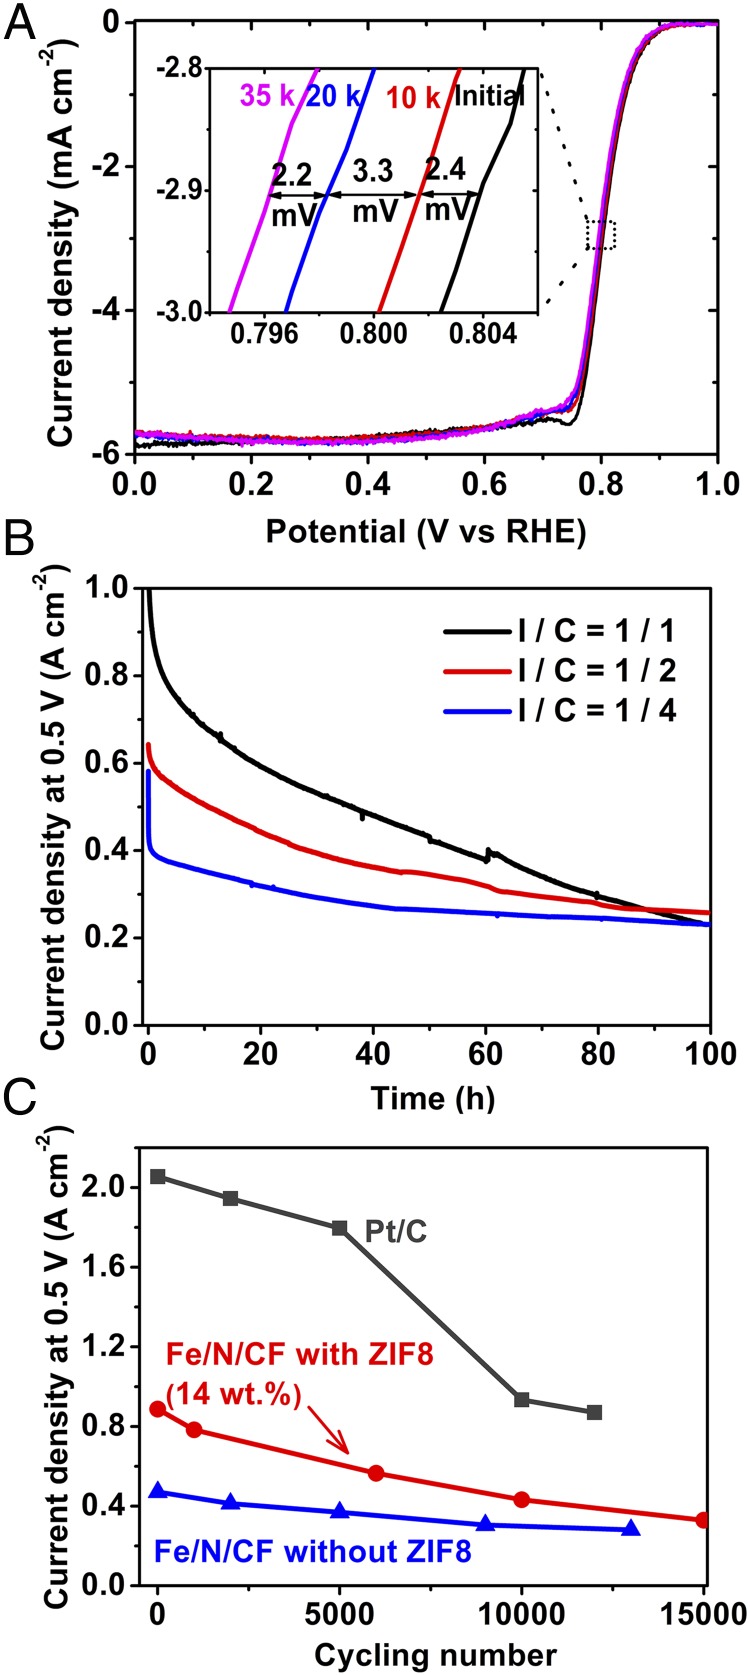
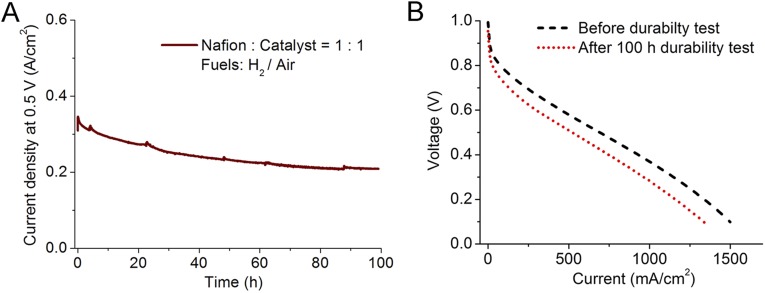
Durability represents a major challenge for NPMC development at present. We investigated Fe/N/CF catalyst durability using both rotating disk electrode (RDE) and single fuel cell methods under the multiple cycling conditions. Fig. 3A shows the linear sweep voltammetry measurements by RDE at different stages of the cycling test. Only a 7.9-mV loss was detected at the half-wave potential after 35,000 voltage cycles between 0.6∼1 V in Ar-saturated H2SO4. This durability performance is among the best reported in the literature for the NPMCs measured by the RDE technique in acidic media (23). Durability in a fuel cell test is more complicated and could be influenced by other factors beyond the catalyst itself. For example, Nafion also degrades during the aging test. We first tested the fuel cell durability at a constant voltage-hold (0.5 V) condition under either oxygen or air using the cathode prepared with different Nafion ionomer-to-catalyst weight ratios (I/C). Fig. 3B shows change of cell current density as a function of time for the electrodes with three different I/C ratios. For I/C = 1/1, the fuel cell with Fe/N/CF shows a good initial current density but a relatively fast decay with O2 as the oxidant. A better current hold was observed when the oxygen was replaced by air (Fig. S13), similar to that observed by others (19, 20). Interestingly, we found that using a lower level of Nafion (I/C = 1/2 and 1/4) in the cathode catalyst layer seemed to slow down the cell current degradation rate, albeit with the lower initial current density. The root cause of such a change is yet to be fully understood, although it may be associated with limited proton conductivity at lower ionomer content at 0.5 V. The ionomer content in the electrode plays an important role in MEA degradation that requires a thorough mechanistic understanding through a separate, more comprehensive investigation. The MEA/fuel cell stability can also be studied using the voltage cycling method. In this experiment, the fuel cell was subjected to multiple voltage swings from 0.6 to 1.0 V, followed by full cell current-voltage polarization measurement. Fig. 3C shows the current density measured at 0.5 V from the current-voltage polarization curves obtained after the designated numbers of voltage cycles (Fig. S14). For comparison, a similar set of current density values was also measured for a MEA prepared with commercial Pt/C catalyst. Both MEAs with Fe/N/CF and Pt/C catalysts degraded after the multicycle, accelerated aging. However, the fraction of the cell current (at 0.5 V) at the end of the multiple cycles with respect to its initial value was actually higher for the cell with Fe/N/CF than that observed for the Pt/C cell. Fe/N/CF stability could also be enhanced by increasing the graphitization degree of the catalyst at the expense of the initial performance. As is discussed later, the degree of graphitization can be enhanced by reducing ZIF content in the precursor. In this case, a Fe/N/CF catalyst with no ZIF in the precursor exhibited even higher retention of current density versus the initial value after the cycling. However, the durability improvement for NPMCs will only become meaningful if the full catalytic activity can be realized at both the beginning and the end of the accelerated stress test. Significantly more effort and understanding are needed.
Fig. 3.
Durability studies of Fe/N/CF catalysts. (A) Linear sweep voltammetry measurements of Fe/N/CF catalyst by the RDE method in O2 saturated 0.5 M H2SO4 after multiple voltage cycling. Cycling was conducted between 0.6 ∼1.0 V at scan speed of 50 mV⋅s−1 in Ar-purged electrolyte at room temperature. (Inset) The shift of the half-wave potential after 10,000, 20,000, and 35,000 cycles. (B) Single fuel cell current densities as the function of time under a constant voltage hold of 0.5 V with Fe/N/CF cathodes of different I/C ratios: 1/1, 1/2, and 1/4. The catalyst loading was ∼4 mg⋅cm−2 and the membrane used was Nafion 117. Test condition: H2/O2 pressure = 2 bars, temperature = 80 °C, and RH = 100%. (C) The change of current density as the function of voltage cycles in an accelerated aging study of a single cell with Fe/N/CF catalyst. For comparison a commercial MEA (BASF, using 40 wt % Pt/C with a loading of 0.5 mg Pt⋅cm−2) and a ZIF-free Fe/N/CF catalyst also studied. Membrane: Nafion 211; O2/H2 pressures = 2 bars; 100% RH; cell temperature = 80 °C. All of the fuel cells were cycled between 0.6∼1.0 V at 50 mV⋅s−1 under 100% humidified N2 in the cathode and 4 vol % H2 in He in the anode. The current densities at 0.5 V were measured from the fuel cell polarization curves after the designated number of cycles (Fig. S14).
Fig. S13.
(A) Current density as the function of time under the constant voltage hold (at 0.5 V) for a fuel cell with Fe/N/CF cathode with air as oxidant. H2/Air absolute pressure = 2 bars; 100% RH; catalyst loading = 3 mg⋅cm−2, I/C = 1/1, and the membrane is Nafion 117. (B) Polarization curves of the same MEA before and after durability test under 2 bar H2/O2 pressures.
Fig. S14.
Comparison of durability between Fe/N/CF catalysts and Pt/C in multiple-cycle accelerated aging tests. (A) Fe/N/CF catalyst made with the precursor slurry containing no ZIF-8. (B) Fe/N/CF catalyst made with the precursor slurry containing 14 wt % ZIF-8. (C) A commercial MEA purchased from BASF with Pt loading 0.5 mg⋅cm−2 on both cathode and anode. Polarization curves were measured with H2/air for Pt/C and H2/O2 for Fe/N/CFs over 5 cm2 MEAs at 100% RH. Membrane was N211. NPMC loadings were 2 mg⋅cm−2. For all of the cycling tests, the cell potential was ramped between 1.0∼0.6 V at the rate of 50 mV⋅s−1 with N2 in the cathode and regeneration gas (4 vol % H2 in He) in the anode. Gas pressures: 2 bars; 100% RH; cell temperature: 80 °C.
Discussion
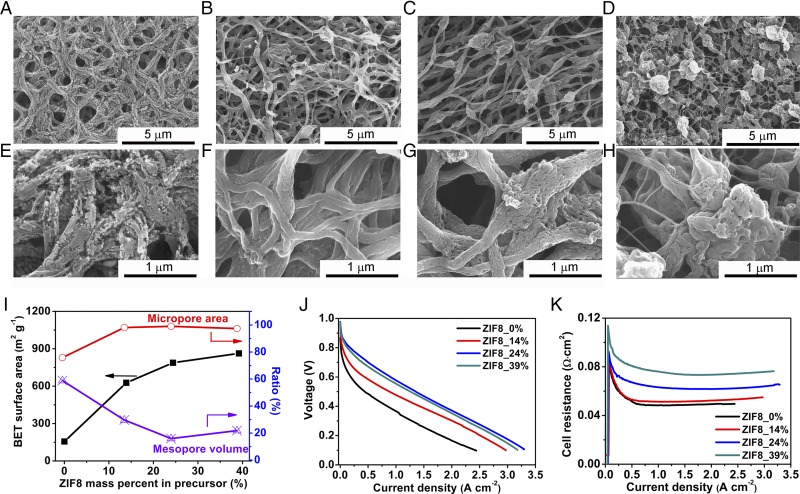
This study identified an approach of preparing an N-containing carbon-based catalyst with nearly exclusive microporosity in a highly mass/charge conductive nanofibrous framework. Not only does this morphology distinguish itself from the traditional carbon support, it is also different from the conventionally electrospun nanofiber. The conventional nanofibers from polyacrylonitrile (PAN)-based precursor are generally highly graphitic with very low surface area. We discovered, however, that high surface area and highly microporous nanofibers can be produced by simply adding MOFs such as ZIFs in the electrospin precursor formulation. In our case, ZIF plays a critical role in tuning Fe/N/CF morphology, microstructure, and N content. To illustrate this point, Fig. 4 A and E show the nanofibers made from a similar electrospin slurry but in the absence of ZIF. Relatively thick fibers (300∼500 nm) full of large cracks were produced. Such fibers contain mesopores surrounded by the graphitic lattice with sparsely dispersed catalytic sites (Fig. S15). A low BET surface area (156 m2⋅g−1, Table S3) was found. With incremental addition of ZIF from 14 wt % to 24 wt % in the slurry, the cracks in the nanofibers disappeared and a “beads-on-string” morphology was formed (Fig. 4 B, C, F, and G), presumably due to the changes in both viscosity and dielectric property of the spinning solution (32). BET surface area also jumped from 156 to 809 m2⋅g−1, with the fraction of micropore surface area [micro/(micro + meso)] increased from 75 to 99%. Correspondingly, the mesopore volume ratio [meso/(meso + micro)] decreased from 60 to 16% (Fig. 4I). Nitrogen contents also increased from 6.85 to 9.03 wt % (Table S3). Further increase of ZIF content to 39% resulted in a particle-dominated morphology connected by very thin fibers (Fig. 4 D and H). Its mesopore content also reverted back to over 20% (Fig. 4I). At 100% ZIF (i.e., in the absence of polymer) plenty of mesopores would be produced in the catalyst (Fig. S16) (20). To keep Fe/N/CF highly microporous in the well-defined network architecture, the ZIF fraction should be maintained at ∼24%.
Fig. 4.
Effects of ZIF on Fe/N/CF catalyst morphology, porosity, and fuel cell performances. The morphology change of catalysts with increasing ZIF content in the precursor excluding the solvent: (A and E) 0 wt %, (B and F) 14 wt %, (C and G) 24 wt %, and (D and H) 39 wt %. (I) Evolutions of BET surface area, the percentage of micropore area and mesopore volume for pores ≤50 nm as functions of ZIF contents. (J) Polarization curves and (K) cell resistances of Fe/N/CF prepared with different ZIF-8 contents. Catalyst loadings were 2 mg⋅cm−2 on cathodes for all cells. I/C = 1/1. Nafion 211 was used as the membrane. Test condition: H2/O2 pressure = 2 bars, temperature = 80 °C, and RH = 100%.
Fig. S15.
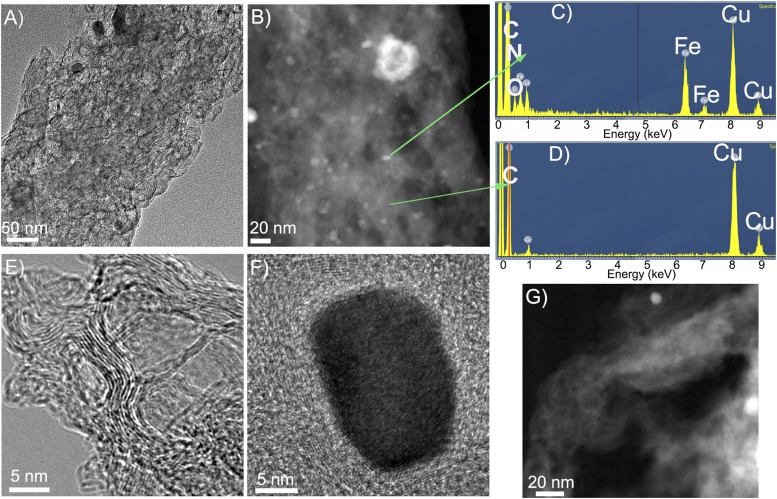
Morphology and Fe distribution in a “ZIF-free” Fe/N/CF fiber. (A) TEM image showing many mesopores in the fiber. (B) STEM image showing many Fe-rich particles in pyrolyzed fiber before acid wash. (C) EDX spectra on Fe-rich region with strong Fe signal. (D) EDX spectra on nonbright region detecting no Fe signal, indicating a possible absence of active site. (E) High-resolution TEM image of well-ordered graphitic lattice around mesopores. (F) High-resolution TEM image of an iron-rich particle wrapped by carbon. (G) STEM image of the catalyst after acid wash in 0.5 M H2SO4 for 40 min. Acid wash removed most Fe-rich particles and exposed potential catalytic sites at the carbon–iron particle interface.
Table S3.
The influence of ZIF-8 in Fe/N/CF precursor on the nitrogen content and BET surface area of the final catalyst
| ZIF-8 concentrations in precursor solution, mg⋅mL−1/its weight percentage among solids in solution, % | Sample treatment stage | N content, wt % | BET surface area, m2⋅g−1 |
| 0/0 | Final catalysts | 6.85 | 156 |
| 11/14 | Final catalysts | 7.02 | 627 |
| 22/24 | Final catalysts | 9.03 | 809 |
| 44/39 | Final catalysts | 9.83 | 863 |
Fig. S16.
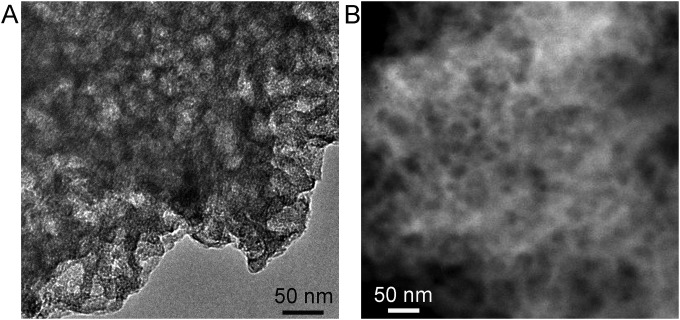
(A) TEM image and (B) STEM image of a catalyst made by carbonizing ZIF-8/TPI mixture. Polymer was not used in the precursor. Mesopores are observed throughout the catalyst, similar to the ZIF-8–derived catalyst (22).
The different ZIF concentrations affect the surface property, morphology, and N content, which, in turn, also influences the fuel cell performance, as is shown by the current-voltage polarization curves in Fig. 4J. Higher ZIF concentration (from 0 to 24 wt %) leads to higher surface areas and N contents, and therefore better fuel cell performance. Too much ZIF (39 wt %) disrupts nanonetwork morphology, leading to a slightly lower fuel cell performance. Fig. 4K shows the overall cell impedance as the function of current density for the MEAs with catalysts at different ZIF contents. The increase of impedance at higher ZIF fraction suggests that ZIF could hinder graphitic lattice growth in the nanofiber during thermolysis because the amorphous carbon fiber is less conductive than the graphitic one. Loading too much ZIF resulted in very thin fibers and high impedance, similar to that of conventional carbon support. Therefore, an optimal balance between activity and conductivity has to be reached.
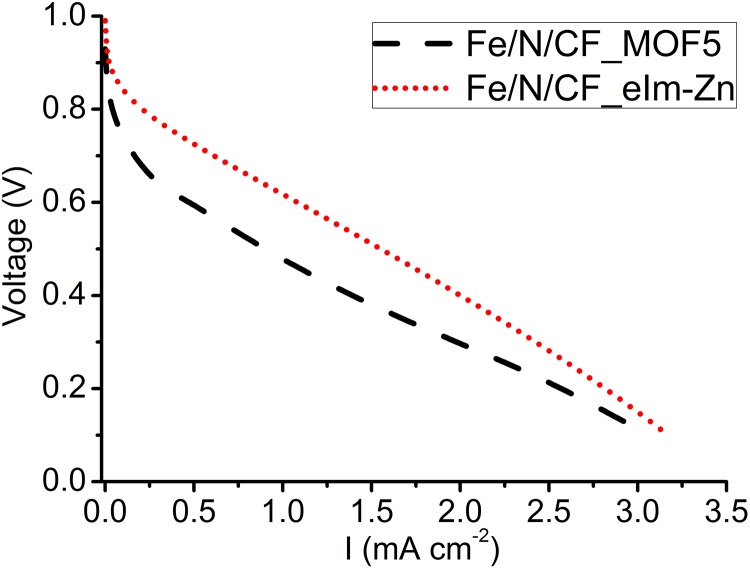
Up to this point, the discussion of ZIF used in the study has been exclusively zinc 2-methylimidazolate framework, Zn(mIm)2, or ZIF-8. To further understand the impact to the Fe/N/CF catalyst performance by the nature of framework material, we also blended two different MOFs into the electrospin slurry in place of ZIF-8 at the optimized ratio of 24 wt %. The first one is zinc 2-ethylimidazolate, or Zn(eIm)2, which has a lattice symmetry identical to that of ZIF-8 except without porosity as crystal (33). Upon thermolysis, however, the pyrolyzed Zn(eIm)2 has BET surface area and ORR catalytic activity comparable to that of ZIF-8 (22). Zn(eIm)2-containing slurry could be readily electrospun into the nanonetwork and the single cell testing on the MEA made with pyrolyzed Zn(eIm)2 nanofibrous cathode catalyst delivered a performance comparable to that of ZIF-8 nanofiber (Fig. S17). The similarity in catalytic activity between the two indicates that N-containing ligand in ZIF plays a determining role in the overall catalytic activity. The second MOF we investigated was MOF-5 [Zn4O(R1-BDC)3] (34). Unlike ZIFs, MOF-5 does not have N-containing organic ligand in its composition. However, it does have very high porosity and surface area. Therefore, one would not expect that MOF-5 will contribute significantly to the total number of active sites other than adding porosity and surface area in the fiber nanonetwork. The corresponding MEA indeed showed inferior performance (Fig. S17) compared with that of ZIF-8 based catalyst (Fig. 4J). However, it is still better than the ZIF-free MEA shown in Fig. 4J.
Fig. S17.
Polarization curves of two carbon fiber catalysts where ZIF-8 was replaced by N-free MOF (MOF-5) or nonporous ZIF [Zn(eIm)2, which has similar lattice structure to ZIF-8 except 2-methylimidazole was replaced by 2-ethylimidazole]. Cathode catalyst loadings were 3 mg⋅cm−2 for both cells. I/C = 1.5/1. Membrane: N211; O2/H2 pressures: 2 bars; 100% RH; cell temperature: 80 °C.
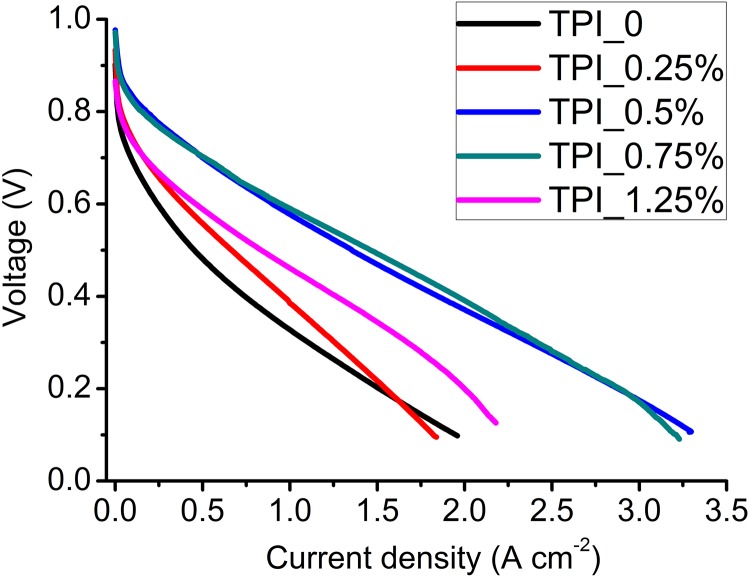
The concentration of the transition metal complex in the precursor also plays an important role in controlling the catalyst activity. We systematically optimized the concentration of TPI in the electrospin slurry and the results are shown in Fig. S18. The optimal TPI concentration was 0.5∼0.75 wt % in the precursor solution. The final Fe content in the optimized Fe/N/CF catalyst was 0.56 wt %, obtained from an inductively coupled plasma analysis.
Fig. S18.
Polarization curves of Fe/N/CF catalysts prepared with different TPI salt concentrations in the precursor solution. Catalyst loadings were 2 mg⋅cm−2 for all cells. I/C = 1/1. The concentrations of TPI in the precursors are indicated in the figure. Membrane: N211; O2/H2 pressures: 2 bars; 100% RH; cell temperature: 80 °C.
Conclusion
In summary, a method of preparing carbon-based nanofibrous catalyst was developed with high-density catalytic sites hosted by micropores and improved mass/charge transports via macropores over a continuous nanonetwork. The method was applied to rationally synthesize the Fe- and N-containing nonprecious metal cathode catalyst with unique electrode architecture for PEM fuel cell application. The membrane electrode made of this catalyst achieved a very high volumetric activity with reasonable durability in the acidic working environments. This catalyst design and synthesis strategy could also be expanded to other carbon-based catalytic applications where easy access to densely populated active sites through effective mass transfer is essential.
Methods
Details on Fe/N/FC catalyst preparation, ZIF particle size before and after the ball milling (Fig. S19) and inside of spun fibers (Fig. S20), MEA fabrication, RRDE and single cell tests, catalyst durability studies, and surface-material property characterizations are provided in Supporting Information.
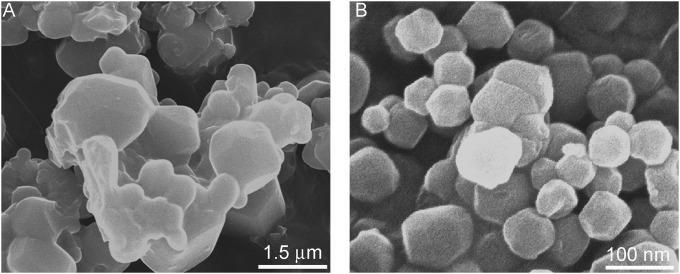
Fig. S19.
SEM images of ZIF-8 (A) before and (B) after ball milling in the preparation of the electrospinning slurry.
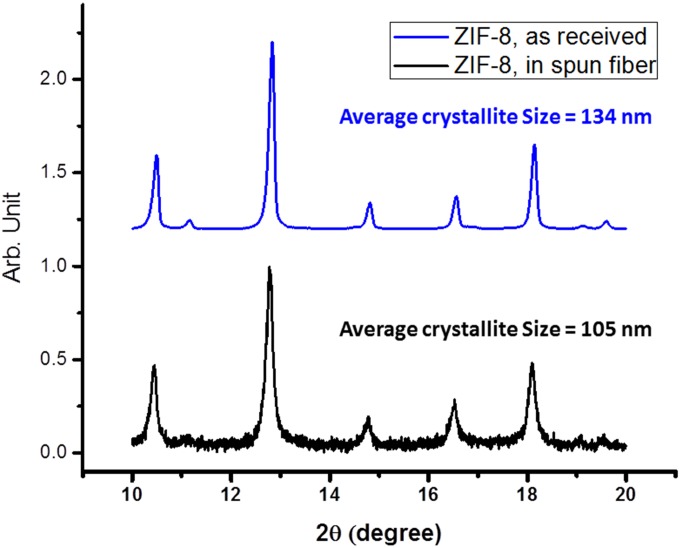
Fig. S20.
X-ray diffraction patterns of the commercial ZIF-8 (Top) and ZIF-8 embedded in electrospun nanofiber (Bottom). The average crystallite sizes were calculated using the Scherrer equation.
SI Methods
Catalyst Synthesis.
PAN (molecular weight 150,000) and poly(methyl methacrylate) (molecular weight 15,000) were dissolved in dimethylformamide (DMF) at concentrations of 75 mg⋅mL−1 and 50 mg⋅mL−1, respectively, at 60 °C. A zeolitic imidazole framework, Zn(mIm)2 or ZIF-8 procured from Sigma-Aldrich (Basolite Z1200), was added into DMF at concentration of 100 mg⋅mL−1 and was ball-milled at 500 rpm for 3 h with 5-mm stainless steel balls in a planetary ball mill. The SEM images of ZIF-8 particulates before and after ball milling are shown in Fig. S19. The average size of primary crystallites of commercial ZIF-8 before the ball milling was found to be ∼134 nm, derived from an X-ray powder diffraction (XRD) study (Fig. S20). Tris-1,10-phenanthroline iron(II) perchlorate (C36H24Cl2FeN6O8, abbreviated as TPI) was also dissolved in DMF at concentration of 50 mg⋅mL−1. As one representative composition (24 wt % ZIF in slurry), polymer solution, ZIF-8 slurry, and TPI solution were mixed with the volume ratio of 12:5:1 and a small amount of extra DMF was added to adjust the concentration. The mixture was then mixed again by ball milling with 3-mm stainless steel at 500 rpm for 0.5 h to make the final precursor solution. The precursor solution was electrospun to form the polymeric nanofibers. An XRD study was performed over the electrospun fiber and the average microcrystallite size of ZIF-8 was found to be reduced to 105 nm, presumably as the result of ball milling. (Fig. S20). The electrospun nanofibers were further converted into catalyst by a sequence of process steps, shown in Fig. S2. For the electrospinning, the voltage was typically kept at 8 kV with a spin distance of 10 cm between the tip of the injecting needle and the surface of a carbon paper (30 × 30 cm) used as the fiber collector. The obtained composite fibers were firstly cured in air at 200 °C for 8 h before they were heated in a tube furnace (quartz tuber, i.d. 1.25 inches) in flowing Ar at 1,000 °C for 1 h. When the heating was completed and the temperature dropped to 900 °C, ammonia (100 mL⋅min−1) was introduced into the hot tube in the process of cooling and was switched off at 500 °C. This process (first ammonia treatment) typically lasted 40–60 min. The carbonized material was washed in 0.5 M H2SO4 by sonication for 10 min and then stirred for 30 min. After the acid wash, the sample was dried and treated again in ammonia for 1 h at 700 °C. The obtained nanofiber catalyst had a powder form with intact microscopic network structure and was named Fe/N/CF. As a comparison, a ZIF-based catalyst was also synthesized with a similar composition except the carbonized polymer was replaced by commercial amorphous carbon (Ketjenblack EC300, KB). The weight of KB added was about 50% weight of polymeric PAN because PAN lost half of its weight after carbonization. Specifically, 100 mg KB, 0.4 mL 1,10-phenanthroline iron(II) perchlorate solution, and 2 mL ZIF-8 slurry were added into 4.5 mL DMF. The mixture was subjected to 60 min of ball milling at 500 rpm with 3.5-mm stainless steel balls by the planetary ball mill. The slurry was then dried at 90 °C overnight in a vacuum oven. The rest of the treatment process was the same as that used for nanofiber catalysts. Thus, the catalysts formed were referred to as Fe/N/KB.
MEA Preparation and PEM Fuel Cell Tests.
The catalyst after the pyrolysis, acid wash, and ammonia treatment was mixed with Nafion ionomer diluted by isopropanol/water solvent to prepare the catalyst ink. A typical catalyst ink contains one-to-one dry weight ratio of Nafion ionomer-to-catalyst unless otherwise stated. After the mixing, the ink was sonicated for 30 min and stirred overnight if needed. A smooth ink containing Fe/N/CF with ionomer evenly coated over each fiber can thus be obtained and is ready to be painted directly over the carbon paper to form the cathode layer. The ink was brushed on a 5-cm2 piece of carbon paper, followed by drying under vacuum at 80 °C for 1 h. The catalyst loading was 2 mg⋅cm−2 unless otherwise stated. For the anode, Pt/C (20 wt % of Pt; BASF) was used with Pt loading of 0.3 mg⋅cm−2. The prepared cathode and anode were hot-pressed onto the opposite sides of a Nafion 211 (or N117) membrane (DuPont) at 130 °C for 2 min under a pressure of 300 pounds⋅cm−2 to make the final MEA. The MEA was tested by a fuel cell test station (Scribner 850e) with UHP-grade H2 and O2. The cell temperature was kept at 80 °C. Gases were humidified at 80 °C with the flow rate of 0.3 L⋅min−1 for H2 and 0.4 L⋅min−1 for O2. The absolute pressures of oxygen and hydrogen were equal and set at 1 bar or 2 bars depending on the particular fuel cell test, which are described in the individual figure captions. The total pressure of the cell also included 0.5 bar water vapor pressure under 100% RH at 80 °C. For example, for the fuel cell test under 1-bar O2/H2 absolute pressures and 100% RH, the total cell pressure was 1.5 bars with gauge-pressure set at 0.5 bar [7.3 pounds per square inch gage (psig)] for both anode and cathode. Similarly, for the fuel cell test under 2-bar O2/H2 pressures and 100% RH, the total cell pressure was 2.5 bars with the gauge pressure set at 1.5 bars (21.8 psig).
RRDE measurements.
Catalyst ink was prepared with weight ratio of ionomer/catalyst of 1/19. Catalyst ink was sonicated for 10 min and then stirred for 5 h before it was loaded onto a glass carbon electrode (diameter 0.56 cm) with a platinum ring at the loading of ca. 400 µg⋅cm−2. ORR activity was measured in oxygen-saturated 0.5 M H2SO4 at the rotating speed of 1,600 rpm. The reference electrode was a calomel electrode and the counter electrode was a gold wire. Electrochemical measurements were conducted by a CHI Electrochemical Station (model 600). The rotator and rotating ring-disk electrode were purchased from Pine Instrument Inc.
Physical and Chemical Characterizations.
Catalyst morphologies were characterized by TEM/scanning TEM (STEM) with elemental analysis by energy-dispersive X-ray spectroscopy (EDX) performed on an analytical scanning transmission atomic resolution electron microscope (JEOL JEM-2100F FAST TEM). SEM images were taken on a Hitachi S4700-II microscope. Each sample was examined with several spots to ensure the results were statistically representative. Catalyst composition was analyzed via inductively coupled plasma optical emission spectroscopy (Columbia Analytical Services). The catalyst surface area and pore size distribution were measured by the BET method at liquid nitrogen temperature with a Micromeritics ASAP2020 surface area and pore size analyzer.
Acknowledgments
We thank Dr. Deborah J. Myers, Dr. Magali Ferrandon, Heather Barkholtz, and Zachary Kaiser for their assistance in fuel cell performance tests and material characterizations. This work was supported by the US Department of Energy’s Office of Science and the Office of Energy Efficiency and Renewable Energy, Fuel Cell Technologies Office.
Footnotes
The authors declare no conflict of interest.
This article is a PNAS Direct Submission.
*Wagner FT, Gasteiger HA, Yan S, DOE Workshop on Non-Platinum Electrocatalysts, March 21–22, 2003, New Orleans, LA. Available at www1.eere.energy.gov/hydrogenandfuelcells/pdfs/fred_wagner.pdf.
This article contains supporting information online at www.pnas.org/lookup/suppl/doi:10.1073/pnas.1507159112/-/DCSupplemental.
References
- 1.Gasteiger HA, Kocha SS, Sompalli B, Wagner FT. Activity benchmarks and requirements for Pt, Pt-alloy, and non-Pt oxygen reduction catalysts for PEMFCs. Appl Catal B. 2005;56(1–2):9–35. [Google Scholar]
- 2.Lalande G, et al. Is nitrogen important in the formulation of Fe-based catalysts for oxygen reduction in solid polymer fuel cells? Electrochim Acta. 1997;42(9):1379–1388. [Google Scholar]
- 3.Bron M, Radnik J, Fieber-Erdmann M, Bogdanoff P, Fiechter S. EXAFS, XPS and electrochemical studies on oxygen reduction catalysts obtained by heat treatment of iron phenanthroline complexes supported on high surface area carbon black. J Electroanal Chem. 2002;535(1–2):113–119. [Google Scholar]
- 4.Matter PH, Zhang L, Ozkan US. The role of nanostructure in nitrogen-containing carbon catalysts for the oxygen reduction reaction. J Catal. 2006;239(1):83–96. [Google Scholar]
- 5.Bashyam R, Zelenay P. A class of non-precious metal composite catalysts for fuel cells. Nature. 2006;443(7107):63–66. doi: 10.1038/nature05118. [DOI] [PubMed] [Google Scholar]
- 6.Kuroki S, Nabae Y, Chokai M, Kakimoto M, Miyata S. Oxygen reduction activity of pyrolyzed polypyrroles studied by N-15 solid-state NMR and XPS with principal component analysis. Carbon. 2012;50(1):153–162. [Google Scholar]
- 7.Jin H, Zhang HM, Zhong HX, Zhang JL. Nitrogen-doped carbon xerogel: A novel carbon-based electrocatalyst for oxygen reduction reaction in proton exchange membrane (PEM) fuel cells. Energy Environ Sci. 2011;4(9):3389–3394. [Google Scholar]
- 8.Jaouen F, et al. Oxygen reduction activities compared in rotating-disk electrode and proton exchange membrane fuel cells for highly active Fe-N-C catalysts. Electrochim Acta. 2013;87:619–628. [Google Scholar]
- 9.Cheon JY, et al. Ordered mesoporous porphyrinic carbons with very high electrocatalytic activity for the oxygen reduction reaction. Sci Rep. 2013;3:2715. doi: 10.1038/srep02715. [DOI] [PMC free article] [PubMed] [Google Scholar]
- 10.Meng H, et al. Iron porphyrin-based cathode catalysts for polymer electrolyte membrane fuel cells: Effect of NH3 and Ar mixtures as pyrolysis gases on catalytic activity and stability. Electrochim Acta. 2010;55(22):6450–6461. [Google Scholar]
- 11.Tian J, Birry L, Jaouen F, Dodelet JP. Fe-based catalysts for oxygen reduction in proton exchange membrane fuel cells with cyanamide as nitrogen precursor and/or pore-filler. Electrochim Acta. 2011;56(9):3276–3285. [Google Scholar]
- 12.Gong K, Du F, Xia Z, Durstock M, Dai L. Nitrogen-doped carbon nanotube arrays with high electrocatalytic activity for oxygen reduction. Science. 2009;323(5915):760–764. doi: 10.1126/science.1168049. [DOI] [PubMed] [Google Scholar]
- 13.Yang S, Feng X, Wang X, Müllen K. Graphene-based carbon nitride nanosheets as efficient metal-free electrocatalysts for oxygen reduction reactions. Angew Chem Int Ed Engl. 2011;50(23):5339–5343. doi: 10.1002/anie.201100170. [DOI] [PubMed] [Google Scholar]
- 14.Ma S, Goenaga GA, Call AV, Liu DJ. Cobalt imidazolate framework as precursor for oxygen reduction reaction electrocatalysts. Chemistry. 2011;17(7):2063–2067. doi: 10.1002/chem.201003080. [DOI] [PubMed] [Google Scholar]
- 15.Jaouen F, Dodelet JP. Average turn-over frequency of O2 electro-reduction for Fe/N/C and Co/N/C catalysts in PEFCs. Electrochim Acta. 2007;52(19):5975–5984. [Google Scholar]
- 16.Charreteur F, Ruggeri S, Jaouen F, Dodelet JP. Increasing the activity of Fe/N/C catalysts in PEM fuel cell cathodes using carbon blacks with a high-disordered carbon content. Electrochim Acta. 2008;53(23):6881–6889. [Google Scholar]
- 17.Zhao D, et al. Iron imidazolate framework as precursor for electrocatalysts in polymer electrolyte membrane fuel cells. Chem Sci (Camb) 2012;3(11):3200–3205. [Google Scholar]
- 18.Jasinski R. A new fuel cell cathode catalyst. Nature. 1964;201:1212–1213. [Google Scholar]
- 19.Lefèvre M, Proietti E, Jaouen F, Dodelet JP. Iron-based catalysts with improved oxygen reduction activity in polymer electrolyte fuel cells. Science. 2009;324(5923):71–74. doi: 10.1126/science.1170051. [DOI] [PubMed] [Google Scholar]
- 20.Proietti E, et al. Iron-based cathode catalyst with enhanced power density in polymer electrolyte membrane fuel cells. Nat Commun. 2011;2:416. doi: 10.1038/ncomms1427. [DOI] [PubMed] [Google Scholar]
- 21.Yuan S, et al. A highly active and support-free oxygen reduction catalyst prepared from ultrahigh-surface-area porous polyporphyrin. Angew Chem Int Ed Engl. 2013;52(32):8349–8353. doi: 10.1002/anie.201302924. [DOI] [PubMed] [Google Scholar]
- 22.Zhao D, et al. Highly efficient non-precious metal electrocatalysts prepared from one-pot synthesized zeolitic imidazolate frameworks. Adv Mater. 2014;26(7):1093–1097. doi: 10.1002/adma.201304238. [DOI] [PubMed] [Google Scholar]
- 23.Wu G, More KL, Johnston CM, Zelenay P. High-performance electrocatalysts for oxygen reduction derived from polyaniline, iron, and cobalt. Science. 2011;332(6028):443–447. doi: 10.1126/science.1200832. [DOI] [PubMed] [Google Scholar]
- 24.Jaouen F, Lefèvre M, Dodelet JP, Cai M. Heat-treated Fe/N/C catalysts for O2 electroreduction: Are active sites hosted in micropores? J Phys Chem B. 2006;110(11):5553–5558. doi: 10.1021/jp057135h. [DOI] [PubMed] [Google Scholar]
- 25.Charreteur F, Jaouen F, Ruggeri S, Dodelet JP. Fe/N/C non-precious catalysts for PEM fuel cells: Influence of the structural parameters of pristine commercial carbon blacks on their activity for oxygen reduction. Electrochim Acta. 2008;53(6):2925–2938. [Google Scholar]
- 26.Jaouen F, Dodelet JP. Non-noble electrocatalysts for O2 reduction: How does heat treatment affect their activity and structure? Part I. Model for carbon black gasification by NH3: Parametric calibration and electrochemical validation. J Phys Chem C. 2007;111(16):5963–5970. [Google Scholar]
- 27.Tian J, et al. Optimized synthesis of Fe/N/C cathode catalysts for PEM fuel cells: a matter of iron-ligand coordination strength. Angew Chem Int Ed Engl. 2013;52(27):6867–6870. doi: 10.1002/anie.201303025. [DOI] [PubMed] [Google Scholar]
- 28.US Department of Energy 2013 Fuel Cell Technologies Office Multi-Year Research, Development and Demonstration Plan. Available at www1.eere.energy.gov/hydrogenandfuelcells/mypp/pdfs/fuel_cells.pdf.
- 29.Wood TE, Tan Z, Schmoeckel AK, O’Neill D, Atanasoski R. Non-precious metal oxygen reduction catalyst for PEM fuel cells based on nitroaniline precursor. J Power Sources. 2008;178(2):510–516. [Google Scholar]
- 30.Zussman E, et al. Mechanical and structural characterization of electrospun PAN-derived carbon nanofibers. Carbon. 2005;43(10):2175–2185. [Google Scholar]
- 31.Jaouen F, et al. Cross-laboratory experimental study of non-noble-metal electrocatalysts for the oxygen reduction reaction. ACS Appl Mater Interfaces. 2009;1(8):1623–1639. doi: 10.1021/am900219g. [DOI] [PubMed] [Google Scholar]
- 32.Shui J, Li JCM. Platinum nanowires produced by electrospinning. Nano Lett. 2009;9(4):1307–1314. doi: 10.1021/nl802910h. [DOI] [PubMed] [Google Scholar]
- 33.Beldon PJ, et al. Rapid room-temperature synthesis of zeolitic imidazolate frameworks by using mechanochemistry. Angew Chem Int Ed Engl. 2010;49(50):9640–9643. doi: 10.1002/anie.201005547. [DOI] [PubMed] [Google Scholar]
- 34.Kaye SS, Dailly A, Yaghi OM, Long JR. Impact of preparation and handling on the hydrogen storage properties of Zn4O(1,4-benzenedicarboxylate)3 (MOF-5) J Am Chem Soc. 2007;129(46):14176–14177. doi: 10.1021/ja076877g. [DOI] [PubMed] [Google Scholar]


