

Significance
Metabolic stress potently modifies immunity. Recently our laboratory identified the stress kinase GCN2 as a key modulator of macrophage responses to toll-like receptor ligands; however, the role of myeloid GCN2 signals in sterile inflammation and homeostatic tolerance is not known. In this study, we tested the requirement of GCN2 for tolerance to apoptotic cells and prevention of autoimmunity in a model of lupus. Our results show that GCN2 in myeloid cells is a critical effector of apoptotic cell-driven tolerance required for regulatory cytokine production and prevention of inflammatory immunity. Moreover, the data indicate that targeting GCN2 is an effective approach to preventing autoimmunity, providing a rationale for developing tools to manipulate GCN2 function in inflammatory immune disease.
Keywords: immunometabolism, stress, tolerance, autoimmunity, apoptosis
Abstract
Efficient apoptotic cell clearance and induction of immunologic tolerance is a critical mechanism preventing autoimmunity and associated pathology. Our laboratory has reported that apoptotic cells induce tolerance by a mechanism dependent on the tryptophan catabolizing enzyme indoleamine 2,3 dioxygenase 1 (IDO1) in splenic macrophages (MΦ). The metabolic-stress sensing protein kinase GCN2 is a primary downstream effector of IDO1; thus, we tested its role in apoptotic cell-driven immune suppression. In vitro, expression of IDO1 in MΦs significantly enhanced apoptotic cell-driven IL-10 and suppressed IL-12 production in a GCN2-dependent mechanism. Suppression of IL-12 protein production was due to attenuation of IL-12 mRNA association with polyribosomes inhibiting translation while IL-10 mRNA association with polyribosomes was not affected. In vivo, apoptotic cell challenge drove a rapid, GCN2-dependent stress response in splenic MΦs with increased IL-10 and TGF-β production, whereas myeloid-specific deletion of GCN2 abrogated regulatory cytokine production with provocation of inflammatory T-cell responses to apoptotic cell antigens and failure of long-tolerance induction. Consistent with a role in prevention of apoptotic cell driven autoreactivity, myeloid deletion of GCN2 in lupus-prone mice resulted in increased immune cell activation, humoral autoimmunity, renal pathology, and mortality. In contrast, activation of GCN2 with an agonist significantly reduced anti-DNA autoantibodies and protected mice from disease. Thus, this study implicates a key role for GCN2 signals in regulating the tolerogenic response to apoptotic cells and limiting autoimmunity.
Multiple lines of evidence suggest that apoptotic cells are a major source of autoantigens in the autoimmune disease systemic lupus erythematosus (SLE). This evidence includes the fact that the dominant autoantigens targeted in SLE are largely nuclear components that are exposed on apoptotic blebs (1, 2). Moreover, the body of evidence suggests that increased cell death and defective clearance are primary drivers of SLE development and progression (3).
In homeostatic conditions, apoptotic cells drive suppressive innate and adaptive tolerogenic immune responses that protect against initiation of inflammatory autoimmunity. Macrophages (MΦ) are key drivers of the early innate response to apoptotic cells (4, 5), and recent work has shown that tissue-resident MΦs are responsible for initial IL-10 production, promoting regulatory adaptive immunity to apoptotic cell antigens and prevention of inflammatory autoimmunity (4, 6, 7).
On a molecular level, the mechanisms driving the initial tolerogenic response of myeloid cells to apoptotic material in vivo are poorly defined, although studies suggest a direct role for inhibitory signaling via the MAPK pathway (8), and a recent report indicated that responses to cytoplasmic DNA may be a key mechanism of tolerance to self (9). Likewise, we have reported that apoptotic cells drive rapid expression of the tryptophan (Trp)-metabolizing enzyme indoleamine 2,3 dioxygenase 1 (IDO1) in MARCO+ marginal zone (MZ) MΦs that is critical for prevention of apoptotic cell-driven autoimmunity (6). Moreover, studies by our group (6) and Sharma et al. (9) have shown a link between a loss of IDO1 activity and exaggeration of autoimmune pathology in MRLlpr/lpr mice.
The best-described IDO1 effector mechanism is driven by consumption of intracellular and microenvironmental Trp, with subsequent elicitation of the so-called integrated stress response (10, 11). In the cell, amino acid deficiencies are detected by the ser/thr kinase general control nonderepressible 2 (GCN2). Activated GCN2 phosphorylates the α subunit of eukaryotic initiation factor 2 (eIF2α), modulating ribosome assembly and altering protein translation (12).
We have previously reported that GCN2 modulates cytokine production in LPS-stimulated MΦs by mechanisms dependent on transcriptional and translational modification (11). At the transcriptional level, GCN2 activation drives induction of transcription factors that are responsible for manifestation of the stress response, including a nodal driver of stress-induced transcription, activating transcription factor 4 (ATF4) (13). Moreover, through induction of ATF4 and downstream targets, including C/EBP homologous protein (CHOP), GCN2 controls autophagy (14) and is critical for cross-presentation of antigens in dendritic cells (DCs) (15).
As a whole, the data indicates GCN2 signaling is an important mechanism regulating innate immunity; however the role of GCN2 in sterile inflammatory conditions is not known. We previously showed that apoptotic cell challenge induced rapid expression of CHOP in MZ MΦs in an IDO1-dependent mechanism (6). Given that (i) IDO1 is dependent on GCN2 for manifestation of stress signals and (ii) inhibition of IDO1 converts the immune response to apoptotic cells from tolerogenic to inflammatory, we hypothesized that GCN2 would be required for apoptotic cell-driven tolerogenic immunity.
In this report, we present evidence that IDO1 modulates MΦ cytokine production when exposed to apoptotic cells in a mechanism dependent on GCN2. Moreover, when GCN2 is deleted, there is a profound defect in tolerance to apoptotic cells. Thus, our results highlight a previously unidentified mechanism of GCN2-dependent, metabolism-driven suppression of innate responses to apoptotic cells.
Results
IDO1 Suppresses IL-12p40 Association with Polyribosomes by a Mechanism Dependent on GCN2.
The biological relevance of metabolic stress signals to immune homeostasis or tolerogenic responses to apoptotic cells is not known. To explore this, we transduced bone marrow-derived MΦs (BM MΦs) with an IDO1-GFP fusion lentiviral construct (11), generating MΦ populations with constitutive IDO1 activity. In IDO1+ MΦs, production of kynurenine, the rate-limiting step in IDO1-mediated Trp consumption, was increased 13-fold compared with controls (Fig. 1A). Moreover, Trp in IDO1+ cultures was undetectable by HPLC, demonstrating that IDO1 completely consumed all available Trp (Fig. 1A). There was comparable kynurenine production and Trp consumption in GCN2KO MΦs, suggesting that GCN2 had no impact on IDO1 activity (Fig. 1A); however, unlike C57BL/6 (B6) MΦs, GCN2KO MΦs failed to show mRNA induction for stress-response genes (CHOP and GADD45b), suggesting that whereas IDO1 was active in the cultures, transmission of a stress response by Trp depletion required GCN2 (Fig. 1B).
Fig. 1.

GCN2 activation promotes apoptotic cell-driven IL-10 production in MΦs. (A and B) BM MΦs were transduced with IDO1-GFP+ or control lentivirus as described in Materials and Methods. Then, 24 h later, kynurenine and Trp in the culture supernatant mRNA for the indicated genes were measured by sqPCR. (C) At 24 h after lentiviral transduction as described in A, BM MΦs were incubated with apoptotic thymocytes at a 10:1 apoptotic cell:MΦ ratio. Then, 18 h later, cell supernatants were collected, and cytokines were measured by ELISA. (D) Western blot analysis for the proteins indicated was done on whole-cell lysates from BM MΦ cultures as described in C. (E) mRNA from BM MΦ/apoptotic cell cultures as in C was collected at the indicated time points, and cytokine message expression was assessed by sqPCR. In some groups, 20 μM D1MT was added. (F) Sucrose gradient fractionation of cellular lysates was followed by sqPCR analysis for the indicated mRNA species from 8-h BM MΦ/apoptotic cultures treated as in C. In A, B, C, and E, bars and line points represent mean ± SD values for triplicate samples. In D, Western blot images are representative of three separate experiments. In F, pooled material from triplicate samples was analyzed. *P < 0.05; **P < 0.01, Student’s t test. Experiments were repeated three times, with similar results.
To test the impact of IDO1 activity and GCN2 deletion on MΦ responses to apoptotic cells, we cultured IDO1+ GCN2 WT and KO MΦs with apoptotic thymocytes at a 1:10 MΦ/apoptotic cell ratio for 12 h and then measured IL-10 and IL-12p40 proteins by ELISA. Exposure to apoptotic cells drove a regulatory cytokine response with a 32-fold increase in IL-10 (Fig. 1C) and a threefold decrease in IL-12p40 relative to baseline in control MΦs (Fig. 1C). In IDO1+ MΦs, baseline expression of IL-10 was increased fivefold compared with GFP+ controls (10 ± 11 pg/mL for GFP+ vs. 52 ± 15 pg/mL for IDO1-GFP+) (Fig. 1C). Moreover, apoptotic cell coculture with IDO1+ MΦs induced a more than twofold increase in IL-10 and an almost complete loss of IL-12p40 protein compared with control MΦs (Fig. 1C). Addition of the IDO1 inhibitor 1-methyl-d-tryptophan (D1MT) reversed apoptotic cell-driven suppression of IL-12 and induction of IL-10 in IDO1+ MΦs, demonstrating that enzymatic activity is required for promotion of suppressive cytokine production by IDO1. GCN2KO IDO1+ MΦs exhibited an elevated basal IL-12p40 protein level that was only partially reduced by coculture with apoptotic cells (Fig. 1C). Moreover, although apoptotic cells induced IL-10 in IDO1+ GCN2KO MΦs, production was only 50% of that observed in control MΦs (Fig. 1C). These results suggest that IDO1 enhances apoptotic cell-driven regulatory responses by a GCN2-dependent mechanism.
As expected, expression of IDO1 increased phosphorylation of eIF2α (p-eIF2α) and induction of ATF4 protein (Fig. 1D and Fig. S1 A and B). Coculture of MΦs with apoptotic cells enhanced this effect, suggesting that apoptotic cells potentiate stress response signal transduction in MΦs. In contrast, in the absence of GCN2, IDO1 expression resulted in a prominent reduction in p-eIF2α detectable by Western blot analysis (Fig. 1D and Fig. S1A). Furthermore, coculture with apoptotic cells failed to elicit either p-eIF2α or ATF4, indicating that in the absence of GCN2, neither IDO1 nor apoptotic cells were sufficient to activate integrated stress response signals.
Fig. S1.

Semiquantative assessment of Western blot band intensity. (A and B) Relative band intensity for phospho-eIF2α (A) normalized to total eIF2α and total ATF4 (B) normalized to β-actin for blots shown in Fig. 1D. (C and D) Relative band intensity for phospho-eIF2α (C) normalized to total eIF2α and total IDO1 (D) normalized to β-actin for blots shown in Fig. 3B. Bars represent mean ± SD values for triplicate samples. Experiments were repeated three times, with similar results.
IDO1 expression increased basal IL-12p40 mRNA abundance threefold compared with controls in a GCN2-dependent manner. However, the addition of apoptotic cells increased IL-10 mRNA 10-fold and reduced IL-12p40 mRNA by 10-fold (Fig. 1E). Nevertheless, IL-12p40 message expression was consistently higher in the presence of IDO1, an effect that was dependent on GCN2 (Fig. 1E). GCN2 alters mRNA association with the polyribosome (polysome) modulating translational activity (13); thus, we hypothesized that GCN2 may restrict IL-12p40 translation, which would result in the observed reduction in protein. Therefore, we examined ATF4, IL-10, and IL-12p40 mRNA association with ribosomes as indicators of translation. For this, we subjected lysates of apoptotic cell-stimulated MΦs to fractionation on sucrose gradient, and determined the distribution of mRNA by semiquantitative PCR (sqPCR) as described previously (11). Overall, IDO1 expression reduced mRNA association with polysomes in a GCN2-dependent manner in MΦs (Fig. S2A). In contrast, ATF4 exhibited a shift in mRNA association to high molecular weight polysomes (Fig. 1F). This agrees with the findings of Harding et al. (13), who reported increased ATF4 association with polysomes during amino acid starvation stress. Moreover ATF4 association with polysomes was dependent on GCN2, given that GCN2KO MΦs exhibited an identical mRNA association profile regardless of the presence or absence of IDO1 activity (Fig. 1F). IDO1 had the opposite effect on IL-12p40 mRNA, which showed a decrease in polysome association in a GCN2-driven fashion (Fig. 1F), whereas in contrast, IL-10 mRNA associated with the high molecular weight polysomes in a manner insensitive to either IDO1 or GCN2 (Fig. 1F). This result suggested that metabolic stress induced by consumption of Trp did not impact the translation of IL-10. Taken as a whole, the experiments illustrated in Fig. 1 indicate that IDO1-driven metabolic stress may generate intracellular and microenvironmental conditions conducive to regulatory cytokine translation after apoptotic cell exposure.
Fig. S2.

IDO1 expression decreases RNA association with polysomes in vitro, and apoptotic cell challenge induces IDO1- and GCN2-dependent stress gene expression in MZ MΦs and CD8α+ DCs in vivo. (A) Polysome analysis of IDO1+ MΦs incubated with apoptotic cells as described in Fig. 1. Cell extracts were subjected to sucrose density centrifugation, and RNA association with polysomes was analyzed by measuring the absorbance at 254 nM. Ribosomal peaks at 40 s, 60 s, and 80 s are identified. (B) At 4 h after apoptotic cell challenge (107 in vivo), SignR1+ MZ MΦs and CD11c+CD8α+ DCs were sorted by FACS from the spleen, and message expression for the indicated mRNA species was determined by sqPCR. Bars represent the relative induction vs. controls value for pooled samples from four mice. In one experimental condition, mice were given the IDO1 inhibitor D1MT ad libitum in drinking water as described in SI Materials and Methods. The experiment was repeated four times, with similar results.
GCN2 Is Required for Apoptotic Cell-Driven Tolerogenic Immunity in Vivo.
Apoptotic cells induce prominent CHOP expression in splenic MZ MΦs and CD8α+ DCs that is abrogated by the IDO1 antagonist D1MT (6). This suggests that IDO1 activity is required for apoptotic cell-driven stress responses in MΦs. Similarly, we found that apoptotic cells induced rapid expression of the stress-response genes Gadd34 and Gadd45b in FACS-sorted MZ MΦs and CD8α+ DCs (Fig. S2B). In contrast, GCN2KO mice showed an attenuation of stress gene induction in a manner comparable to IDO1-inhibited groups, indicating a potential link between GCN2 and IDO1 in apoptotic cell-driven stress responses in phagocytes (Fig. S2B).
Apoptotic cell exposure induces TGF-β in CD8α+ DCs and IL-10 in MZ MΦs in vivo (6). To test the requirement of myeloid GCN2 for suppressive cytokine expression after apoptotic cell challenge, we crossed B6.Eif2ak4flox/flox (i.e., GCN2flox/flox) mice with B6.Lysmcre/+ mice to generate myeloid-specific GCN2KO mice (Fig. S3). Apoptotic cell challenge in vivo induced expression of IL-10 mRNA predominately in MZ MΦs (FACS-sorted via SignR1) and TGF-β1 mRNA in CD8α+ DCs; however, total or myeloid-specific GCN2 disruption abrogated regulatory cytokine induction, and the phagocytes instead showed induction of IL-12p40 mRNA (Fig. 2A). Accordingly, examination of splenic lysates after apoptotic cell injection revealed a significant increase in both IL-10 and TGF-β protein, an effect that was blocked by myeloid GCN2 deletion (Fig. 2B), suggesting that GCN2 signals are mechanistically required for apoptotic cell-driven innate regulatory responses.
Fig. S3.

FACS staining for intracellular GCN2 in splenocytes from B6.Gcn2flLysMCRE mice. Shown are representative histograms of splenic cell populations identified with the indicated markers stained for the intracellular presence of GCN2, as described in SI Materials and Methods. The experiment was repeated twice, with the same results. n = 4 mice per group.
Fig. 2.

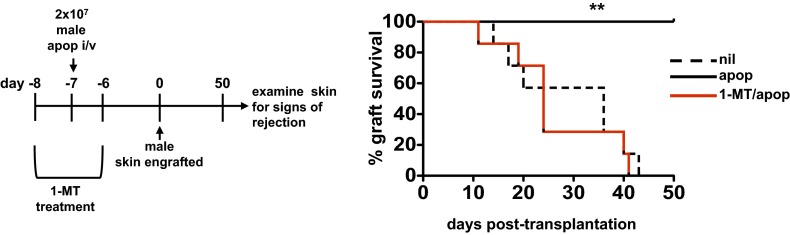
Myeloid GCN2 signals are required to suppress adaptive immunity to apoptotic cells in vivo. (A) At 4 h after apoptotic cell challenge (107 in vivo), SignR1+ MZ MΦs and CD11c+CD8α+ DCs were sorted by FACS, and cytokine message expression for the indicated species was determined by sqPCR. (B) Mice of the indicated phenotype were challenged with 107 apoptotic cells; 18 h later, spleens were collected, and cytokine protein concentrations were determined on whole spleen lysate by ELISA. (C) Mice received 2.5 × 10⁶ MACS-purified CFSE-labeled Thy1.1+CD4+ OTII T cells in vivo, followed by challenge with 107 OVA+ apoptotic cells. At 3 d later, spleens were collected, and CFSE and CD44 intensity in the CD4+Thy1.1+ T cells was determined by flow cytometry. Plots are gated on Thy1.1+CD4+ cells. (D) Splenocytes from mice treated as described in C were restimulated in vitro for 5 h with PMA/ionomycin as described in SI Materials and Methods, after which intracellular FACS analysis for the indicated cytokines in Thy1.1+OTII+ T cells was done. (E) FACS-purified Thy1.1+OTII+ T cells were stimulated with peptide-pulsed CD11c+ DCs, and proliferation was determined by thymidine incorporation. cpm, count per minute. (F) Male B6 thymocytes (107) were adoptively transferred in vivo into mice of the indicated genotype, followed by male skin engraftment 7 d later (as described in SI Materials and Methods), and then monitored for graft rejection for 50 d. n = 10 mice/group. In A, bars represent the value for pooled samples from four mice. In B and D, bars represent mean ± SD values for five mice. In C and D, plots are representative of five mice per group. *P < 0.05, **P < 0.01, Student’s t test. Experiments were repeated four times, with similar results.
We previously reported that apoptotic cell-associated antigens fail to induce adaptive T-cell responses (4, 6, 7). This effect is dependent on IDO1 expression and MZ MΦs, given that Ido1−/− mice or mice depleted of MZ MΦs showed vigorous T-cell responses to apoptotic cells (6). Because we hypothesized that IDO1 inhibits T-cell responses via activation of GCN2, we reasoned that GCN2KO mice would show increased inflammatory T-cell responses to apoptotic cell antigens. To test this, we adoptively transferred carboxyfluorescein succinimidyl ester (CFSE)-labeled transgenic OTII T cells into GCN2flLysMcre mice, followed 24 h later by challenge with apoptotic OVA+ thymocytes, and assessed proliferation (CFSE dye dilution), activation (CD44 induction), cytokine production, and response to restimulation in vitro.
In B6 mice, exposure to OVA+ apoptotic cells did not activate OTII T cells, as demonstrated by the lack of change in splenic OTII T-cell numbers, and no observable change in CFSE fluorescence intensity or CD44 surface expression (Fig. 2C). In contrast, when total GCN2KO or GCN2flLysMcre mice were challenged with OVA+ apoptotic cells, the OTII T cells underwent proliferation and activation, with the majority of T cells exhibiting a CFSElowCD44high phenotype (Fig. 2C). A sizeable portion of the naïve OTII T-cell population expressed IL-10, as determined by FACS analysis (Fig. 2D). IL-10+ OTII T-cell numbers were slightly increased at 5 d after apoptotic cell challenge; however, in GCN2flLysMcre mice, apoptotic cell challenge resulted in a loss of IL-10+ T cells and significant increases in IFN-γ+ and IL-17a+ OTII T cells (Fig. 2D), suggesting that myeloid GCN2 signals suppress inflammatory T-cell responses to apoptotic cell antigens.
Although we have shown that apoptotic cells do not drive adaptive T-cell responses, whether the lack of responsiveness is related to immunologic ignorance or to anergy is unclear. To test whether apoptotic cells induce active suppression of T cells, we restimulated MACS-enriched OTII T cells with OVA-peptide pulsed CD11c+ DCs in vitro and determined proliferation via 3H-thymidine incorporation. Naïve OTII T cells proliferated robustly on stimulation in vitro, whereas OTII T cells purified from OVA+ apoptotic cell-challenged mice failed to proliferate (Fig. 2E). In contrast, if the T cells had seen apoptotic antigens in the absence of myeloid GCN2, suppression failed and there was a twofold increase in thymidine incorporation compared with nonexposed controls (i.e., NIL group) (Fig. 2E), indicating that (i) apoptotic cells drive suppression of OTII T cells and (ii) suppression requires GCN2 signals in myeloid cells.
Systemic apoptotic cell exposure results in long-term tolerance to associated antigens and allografts (7). Given that GCN2flLysMcre mice showed abrogated suppression of inflammatory immunity to apoptotic cells, we reasoned that long-term tolerance would be compromised as well. To test this, we used a model of female recognition to male H-Y antigen, in which exposure to male apoptotic cells leads to long-term tolerance to male skin grafts (7, 16). In agreement with our previous studies, control groups of female mice rejected male skin, with a mean graft survival time of 26 d; in contrast, female mice receiving a single injection of male apoptotic cells before skin engraftment showed tolerance with no graft rejection (Fig. 2F). Tolerance was dependent on both IDO1 and GCN2, as demonstrated by the fact that treatment with D1MT at the time of apoptotic cell challenge abrogated allograft acceptance (Fig. S4), and that GCN2flLysMcre mice receiving male apoptotic cells exhibited graft rejection in a pattern comparable to that seen in control B6 mice (Fig. 2F). Thus, apoptotic cell-driven tolerance manifests through a mechanism that depends on IDO1 induction with subsequent GCN2-dependent metabolic stress signals.
Fig. S4.
IDO1 activity at the time of apoptotic cell exposure is required for generation of stable tolerance and allograft acceptance. Female B6 mice were given the IDO1 inhibitor D1MT ad libitum in drinking water for 2 d before administration of 107 male B6 thymocytes in vivo. Mice were then immediately taken off the D1MT containing water, followed by male skin engraftment 7 d later (as described in SI Materials and Methods), and monitored for graft rejection for 50 d. The experiment was repeated twice, with similar results. n = 10 mice/group.
Myeloid GCN2 Signals Restrict Spontaneous Autoimmune Disease Progression.
In diseases of chronic inflammation such as SLE, IDO1 activity is often elevated, acting as a regulatory mechanism to limit disease pathology (17–21). In accordance with this, we recently identified MZ MΦs and IDO1-driven regulation as key factors limiting SLE manifestation and progression (4, 6). Because the data suggest that GCN2 is the principle downstream molecular effector of the IDO1 response to apoptotic cells in phagocytes, we predicted that GCN2 deletion would accelerate autoimmunity and pathology in lupus. To test this, we fixed myeloid GCN2 deficiency on the B6.FcγR2b−/− background and analyzed the mice for autoimmune disease development and progression.
Female B6.FcγR2b−/− mice (hereinafter referred as R2B) develop fulminant pathology with high-titer αdsDNA IgG, chronic B-cell, MΦ, and DC activation, and 50% mortality at age 9–12 mo due to severe glomerulonephritis (22). R2B mice also develop significant splenomegaly by age 6 mo. Deletion of GCN2 amplified this phenotype, with splenocyte numbers doubled in R2B GCN2flLysMcre mice compared with controls (Fig. 3A). There was constitutive p-eIF2α detectable by Western blot analysis in B6 spleen lysate, which was not increased in R2B mice (Fig. 3B and Fig. S1C); however, when GCN2 was deleted, there was a reduction of p-eIF2α, suggestive of reduced stress signaling (Fig. 3B and Fig. S1C). IDO1 was not detected in B6 spleen; however, IDO1 protein was induced 10-fold in splenic lysates from lupus-prone R2B mice, an effect that was increased by GCN2 deletion (Fig. 3B and Fig. S1D). Given that IDO1 is induced by IFNs and inflammatory reactions (10), this suggests that increased inflammatory activity may be driving the observed increases in IDO1.
Fig. 3.

MZ MΦ and B-cell activation are increased in lupus-prone mice lacking myeloid GCN2 function. (A) Splenocyte numbers from 6-mo-old mice of the indicated genotype. (B) Representative Western blot of whole spleen lysate from two mice per group described in A. m, mouse. (C–E) Flow cytometry analysis of groups described in A. In D, B-cell plots shown are gated on a B220+ population. Graphs in E are gated on the markers indicated above. Bars represent mean ± SD values for eight mice. *P < 0.05, **P < 0.01, Student’s t test. ns, not significant. Experiments were repeated four times, with similar results.
FACS analysis of splenocytes from 6-mo-old R2B GCN2flLysMcre mice revealed an expansion in splenic CD11c+ DCs compared with R2B mice, with specific increases in plasmacytoid DCs and myeloid (i.e., CD11b+) DCs (Fig. 3C). In contrast, CD8α+ DCs were decreased by more than threefold in R2B GCN2flLysMcre mice compared with either R2B or B6 mice (Fig. 3C), suggesting a differential effect of GCN2 deficiency on splenic DC populations. MZ B-cell expansion in R2B mice was not affected by GCN2 disruption; however, CD24low follicular B cells were increased twofold compared with control R2B mice, indicative of increased chronic B-cell activation (Fig. 2D).
F4/80+ MΦs showed increased surface CD86 and MHCII staining in R2B mice compared with B6 controls (Fig. 4E). Deletion of GCN2 in MΦs did not affect MHCII, but CD86+ cell percentages were increased by 50% in the R2B GCN2flLysMcre mice. The effect of GCN2 deletion was more exaggerated in MZ MΦs, which exhibited a significant increase in CD86 and MHCII expression compared with R2B MZ MΦs (Fig. 3E).
Fig. 4.

GCN2 limits inflammatory cytokine production and systemic autoimmune disease in lupus-prone mice. (A) SignR1+ MZ MΦs were sorted from 6-mo-old mice of the indicated genotype by FACS and cytokine message for the indicated species was determined by sqPCR. (B) Whole spleen lysates from 6-mo-old mice of the indicated genotype were collected, and cytokine protein concentrations were determined by ELISA. (C) Total serum IgG from 6-mo-old mice was measured by ELISA. (D) Serum was collected monthly from mice at the indicated ages, and IgG reactivity against dsDNA was measured by ELISA. (E) Urine was collected from 6- to 7- mo-old mice, and protein concentrations were measured as described in Materials and Methods. (F) Survival for mice of the indicated genotype over a 12-mo period was monitored. In A, bars represent the value for pooled samples from four mice. In B and C, bars represent mean ± SD values for eight mice. In D and E, graphs show mean ± SD values for eight mice. In F, n = 10 mice per group, and significance was determined as described in Materials and Methods. *P < 0.05, **P <0.01, ***P < 0.0001, Student’s t test. ns, not significant. Experiments were repeated three times, with similar results, with the exception of the experiment shown in F, which was repeated twice.
CD8α+ DCs were primarily MHCIIhigh and showed higher CD86 expression compared with MΦs. In R2B mice, MHCII staining for CD8α+ DCs was relatively unchanged, but there was an increase in overall CD86high cells (Fig. 3E). In contrast, the majority of CD8α+ DCs had significantly down-regulated MHCII in R2B GCN2flLysMcre mice (Fig. 3E) suggestive of a reduction in antigen presentation as well as overall CD8α+ DC numbers in the absence of GCN2.
When MZ MΦs from R2B mice were FACS-sorted and examined for cytokine message, we found increased mRNA for the inflammatory cytokines IL-12p40, IL-6, and IFN-β1, as well as a 25-fold increase in IL-10 message expression, compared with age-matched B6 MZ MΦs (Fig. 4A). Deletion of GCN2 in MZ MΦs was associated with a twofold increase in IL-12p40 and fourfold increases in IL-6 and IFNβ1 compared with R2B MZ MΦs, indicating increased inflammatory potential. In agreement with Fig. 2A, deletion of GCN2KO was associated with a loss of IL-10 mRNA relative to R2B controls in the MZ MΦs, suggesting compromised regulatory cytokine production, which may exacerbate inflammation (Fig. 4A). Cytokine measurements from whole spleen lysates agreed with the mRNA analysis, with an elevated inflammatory phenotype in R2B GCN2flLysMcre spleen compared with R2B mice (Fig. 4B).
Total serum IgG was increased in R2B mice compared with the B6 mice, but was not affected by GCN2 deletion (Fig. 4C). In contrast, there was a significant increase in serum αdsDNA IgG in R2B GCN2flLysMcre mice beginning at 4 mo of age (Fig. 4D). When kidneys from 6- to 7-mo-old mice were examined for pathology, both R2B and R2B GCN2flLysMcre mice showed global pathology with enlarged and sclerotic glomeruli, tubulointerstitial and perivascular infiltrate, and tubular atrophy with cast formation (Fig. S5A).
Fig. S5.

Renal pathology is increased in lupus-prone mice with deficiencies in myeloid GCN2 function. Kidneys were collected from 6-mo-old female mice of the indicated genotype. (A) Representative PAS-stained sections from the mice. (B) Tubular and glomerular pathology scores from mice in A determined as described in SI Materials and Methods. (C) Kidney cryosections from mice were stained for for IgG, IgM, complement C3, and F4/80. n = 6 mice/group. (Scale bar: 100 μm.)
Whereas both R2B and R2B GCN2flLysMcre mice had similar glomerular pathology scores, R2B GCN2flLysMcre mice exhibited increased tubular injury (Fig. S5B). R2B and R2B GCN2flLysMcre mice had prominent diffuse immune complex deposition in the glomeruli consisting primarily of IgG associated with complement C3 fixation (Fig. S5C). F4/80+ MΦs were conspicuous throughout the tubules, and staining for MΦs was similar in R2B and R2B GCN2flLysMcre mice (Fig. S5C). In agreement with tubular pathology scores, proteinuria was greater in R2B GCN2flLysMcre mice compared with R2B mice, indicative of increased kidney disease (Fig. 4E).
Renal failure is the primary driver of death in murine lupus, and we found increased mortality in the R2B GCN2flLysMcre mice, with 50% mortality at 7.5 mo and 100% mortality at 11 mo, compared with 52% mortality at 12 mo in R2B mice (Fig. 4F), suggesting that myeloid deficiencies in GCN2 enhanced inflammation, ultimately driving pathology and mortality.
FcγRIIb-deficient mice respond abnormally to apoptotic cell challenge in vivo, with increased plasma cell formation and DC responses (23). Based on the foregoing data, we hypothesized that GCN2 deletion would increase the dysfunctional responses to apoptotic cells driving elevated autoantibody production after exposure. To test this, we challenged R2B and R2B GCN2flLysMcre mice four times (once weekly) with 107 apoptotic thymocytes and collected serum 1 d before each apoptotic cell challenge, with a final collection at day 28 (Fig. S6), and measured αdsDNA IgG production by ELISA. By the final collection (day 28), repeated apoptotic cell exposure had increased the αdsDNA IgG concentration 4.5-fold in R2B mice relative to sham-injected controls (Fig. S7A). R2B GCN2flLysMcre mice challenged with apoptotic cells showed a similar fold increase in αdsDNA IgG at day 28 of the experiment; however, the increased baseline autoreactivity (which was twofold higher at day 28 relative to the R2B group) translated to a significant increase in autoreactivity in GCN2KO mice challenged with apoptotic cells (Fig. S7A). These results suggest that the lack of GCN2 signals in myeloid cells potentiates the abnormal apoptotic cell response in R2B mice, promoting a more vigorous autoimmune response to self.
Fig. S6.

Schematic for the experimental approach in Fig. S7A.
Fig. S7.

Autoimmunity is accelerated in myeloid GCN2KO mice exposed to apoptotic cells. (A) 3-mo-old mice of the indicated genotype were injected with 107 B6 apoptotic cells once weekly (four times total). Serum was collected at the indicated time points, and concentrations of total IgG reactive against dsDNA as a marker of systemic autoimmunity were determined by ELISA. (B) R2B and R2B GCN2flLysMcre mice were given HF injections i.p. as described in SI Materials and Methods for a period of 2 mo, after which serum was collected and IgG reactivity to dsDNA was measured by ELISA. In one experimental condition, mice were given the IDO1 inhibitor D1MT ad libitum in drinking water and examined for the impact on autoimmune disease with and without HF treatment. For both experiments, n = 7 mice/group. *P < 0.05, **P < 0.01, Student’s t test. ns, not significant. Experiments were repeated three times, with similar results.
Halofuginone (HF) acts as a GCN2 agonist by inhibiting prolyl-tRNA synthetase (24). Because GCN2 stress signals are a key effector of tolerogenic immunity, we predicted that GCN2 activation with HF would reduce autoimmunity in R2B mice. To test this, we treated 4-mo-old female mice with HF for 2 mo and measured serum αdsDNA IgG at the experimental endpoint. HF reduced αDNA IgG by fivefold, suggesting that GCN2 activation can suppress systemic autoimmunity (Fig. S7B). IDO1 inhibition with D1MT significantly increased αdsDNA serum concentrations in R2B mice (Fig. S7B). In these mice, treatment with HF had an even more pronounced effect, reducing autoreactivity by 10-fold compared with the control D1MT-treated animals. Finally, the effect was dependent on GCN2, given that R2B GCN2flLysMcre mice did not show reductions in αdsDNA IgG concentrations after HF treatment (Fig. S7B). Thus, our data support the prospect of targeted GCN2 manipulation as a therapy for systemic autoimmune disease.
Discussion
The ability to sense the available nutrient supply is an essential component of cellular physiology. As a consequence, multiple mechanisms have evolved to allow cells to respond to fluctuating availability of glucose and ATP, amino acids, and oxygen required for aerobic respiration and biosynthesis. Several of these molecular “sensors” play key roles in immunity, driving cellular expansion, differentiation, and the biosynthesis profile.
The primary sensors of amino acid availability are mTOR and GCN2. mTOR (as a component of mTORC1) interacts with branched-chain amino acids to promote translation and ribosomal assembly (25), whereas GCN2 binds directly to any uncharged tRNA, driving its kinase activity and inhibiting ribosomal assembly on nascent transcripts (10). GCN2 has been identified as a molecular target for IDO1-induced proliferative arrest and anergy in naïve T cells (26). Subsequently, GCN2 was found to be required for IDO1-driven Treg activation (27, 28) indicating a key role as an effector for acquired T-cell tolerance.
We recently reported that IDO1 is required for apoptotic cell-induced tolerance (6). Specifically, IDO1 was rapidly induced in MZ MΦ after apoptotic cell challenge in vivo, suppressing MΦ and DC production of inflammatory cytokines, inhibiting immunity to apoptotic antigens, and limiting autoimmunity in MRLlpr/lpr mice. In apoptotic cell-injected mice, expression of the stress gene CHOP corresponded to the pattern of IDO1 expression, and inhibition of IDO1 abrogated CHOP mRNA induction, suggesting that an IDO1-dependent stress signal was induced in apoptotic cell phagocytes. Because GCN2 is the primary effector of IDO1 stress, this result raises the possibility that GCN2 is required for myeloid responses to apoptotic cells; however, the role of GCN2 in MΦ and DC cell function has not been examined until recently.
We previously found that GCN2 signals have a significant effect on MΦ cytokine production after activation by toll-like receptor ligands, enhancing transcription of IL-6 but providing a translational block by virtue of eIF2α phosphorylation (11). The data from the present study suggest a similarly dominant role for GCN2 in the apoptotic cell response, with the translational block manifested by GCN2 activation serving to prevent inflammatory cytokine production creating a permissive translational environment for IL-10 synthesis and downstream immune suppression.
GCN2 deletion in myeloid cells had a significant effect on systemic autoimmunity, accelerating immune dysfunction and exacerbating pathology and mortality. This is consistent with a role for GCN2 in regulating myeloid inflammatory activity and suggests a function in innate responses to apoptotic cells and restriction of autoimmunity. Sundrud et al. (29) reported that HF inhibits Th17 T-cell differentiation, protecting mice in an experimental model of multiple sclerosis by inducing a GCN2-dependent stress response. A later study found that the mechanism of action was prolyl-tRNA synthetase inhibition mimicking proline starvation (24). We found that treatment of lupus-prone mice with HF significantly reduced autoimmunity. Importantly, when IDO1 was inhibited, HF still had the capacity to potently reduce αdsDNA IgG concentrations in serum, suggesting a bypass of the need for IDO1 to restrict autoimmunity. Moreover, the finding that HF had no affect on humoral autoimmunity in Gcn2flLysMcre mice suggests that agonizing GCN2 activity in myeloid cells can restrict autoimmunity. Nevertheless, this result must be interpreted with caution, because GCN2 is expressed in all cell types. Therefore, we cannot not rule out the possibility of a MΦ-independent role for GCN2 in prevention of inflammatory autoimmunity after HF treatment.
In conclusion, this report provides evidence of a mechanism by which metabolic stress signals delivered by GCN2 inhibit innate inflammatory responses to apoptotic cells, restricting adaptive immunity and preventing autoimmunity. Importantly, the demonstration that GCN2 activation by HF potently reduced autoimmune reactivity suggests GCN2 represents a therapeutic target in autoimmune disease therapy.
Materials and Methods
Animals.
C57BL/6J (B6), B6.Act-mOVA-II (Act-mOVA), B6.LysM-Cre, OTII Thy1.1+, B6.Eif2ak4tm1.2Dron (GCN2−/−), B6.Eif2ak4tm1.1Dron (GCN2flox/flox), and B6.Fcgr2b−/− mice were obtained from a colony maintained at Georgia Regents University, in accordance with Institutional Animal Care and Use Committee guidelines.
Lentiviral Transduction.
BM MΦs were generated as previously described (23). For further description see SI Materials and Methods.
Halofuginone Treatment.
Halofuginone hydrobromide (HF) (Sigma) was resuspended in phosphate buffered saline (PBS) at a concentration of 1 mg/mL. For in vivo administration, mice were injected with HF (1 μg/gm) by intraperitoneal administration twice weekly for a period of 8 wk.
Other Materials and Methods.
All other methods are described in SI Materials and Methods.
SI Materials and Methods
Animals.
C57BL/6J (B6), B6.Act-mOVA-II (Act-mOVA), B6.LysM-Cre, OTII Thy1.1+, B6.Eif2ak4tm1.2Dron (GCN2−/−), B6.Eif2ak4tm1.1Dron (GCN2flox/flox), and B6.Fcgr2b−/− mice were obtained from a colony maintained at Georgia Regents University, in accordance with Institutional Animal Care and Use Committee guidelines.
Lentiviral Transduction.
For lentiviral transduction, IDO1-GFP– or GFP lentivirus-containing media generated as described previously (11) was cultured with BM MΦs (5 × 10⁵ cells/well) in RPMI 1640 containing 10% FBS and seeded in 24-well plates. The cells were infected with lentiviral vectors at an MOI of 10 in the presence of 8 μg/mL polybrene.
Apoptosis Induction and in Vivo Apoptotic Cell Administration.
For the generation of apoptotic cells, thymocytes collected from 8-wk-old female B6 or Act-mOVA mice were exposed to 2,000 cGy of radiation and cultured for 6 h at 37 °C in RPMI 1640 media plus 1% BSA (Sigma-Aldrich). Annexin V and propidium iodine staining confirmed apoptosis induction and revealed that typically >85% of the thymocytes were apoptotic, with <1% of the cells necrotic.
Flow Cytometry.
For sorting of MZ MΦs and DCs, mice were injected with 107 apoptotic B6 thymocytes. At 4–8 h postinjection, spleens were collected and injected with 100 U of collagenase (Sigma-Aldrich) in 2 mL of PBS, and then incubated for 30 min at 37 °C in 5 mL of PBS containing 400 U/mL collagenase. From the digest, single-cell suspensions were generated and incubated with α-SignR1 (Serotec), α-CD8α and α-CD11c (BD Pharmingen), and α-F4/80 (eBioscience) antibodies. The cells were sorted on a Dako Cytomation MoFlo cell sorter into tubes containing RNAprotect reagent (Qiagen).
To measure in vivo T-cell proliferation 2 × 10⁶ 5-(and 6)- carboxyfluorescein diacetate succinimidyl ester-labeled (Invitrogen) OTII+Thy1.1+ T cells were adoptively transferred i.v. into B6 mice via lateral tail vein injection. At 24 h after OTII transfer, mice were injected with 107 apoptotic Act-mOVA thymocytes in 200 μL of PBS in vivo. At 3–5 d after apoptotic cell transfer, spleens were collected, and proliferation was assessed via flow cytometry. To visualize the adoptively transferred OTII cells, 5 × 10⁶ splenocytes were stained with 2.5 μg of anti-CDThy1.1 PE (eBioscience).
For general flow cytometry, 106 splenic cells were stained with αCD86, αCD11c, αCD8α, αMHCII, αCD24, αCD11c, αB220, αCD23, αCD35 (eBioscience), or αCD103 (Pharmingen). For intracellular staining of GCN2, cells were first stained with the indicated surface antigens and permeabilized in CytoFix/CytoPerm buffer (Ebioscience). Cells were then stained with αGCN2 antibody (Cell Signaling Technology), followed by staining with goat anti-rabbit IgG (Abcam). For flow cytometry analysis, ≥105 (106 in the case of adoptive OTII transfer) events were collected on a LSR II flow cytometer (BD Biosciences). Data were analyzed using FlowJo software (Tree Star).
T-Cell Proliferation Assay.
At day 0, 2 × 10⁶ purified OTII+Thy1.1+ T cells were injected into B6 mice. On day +1, 107 apoptotic OVA+ cells were injected in vivo. At 5 d after immunization, splenic OTII+Thy1.1+ T cells were enriched by MACS. Purified T cells (2 × 10⁵) were cocultured for 48 h with a graded number of OVA323-339 peptide-pulsed splenic DCs prepared from naive B6 mice. Proliferation was quantified based on [3H] thymidine (1 μCi/well) uptake during the last 12 h of culture.
Polysome Analysis.
Polysome analysis was done as described previously (11, 30, 31). In brief, 107 cells were homogenized in 2 mL of buffer A (25 mM Tris, 25 mM NaCl, 5 mM MgCl2, 50 μg/mL cycloheximide, 0.2 mg/mL heparin, and 1% Triton X-100; pH 7.5) with 10 strokes through a 26 G needle. The homogenate was centrifuged and decanted into another tube, and an equal volume of buffer B (4 volumes of buffer A diluted with 1 volume of 1 M MgCl2) was added. After incubation on ice for 1 h, 4 mL of the total mixture was layered over a 10-mL linear sucrose gradient [10–50% sucrose (w/v) in 20 mM Tris-HCl pH 8.0, 140 mM KCl, 0.5 mM DTT, 5 mM MgCl2, 0.1 mg/mL cycloheximide, and 0.5 mg/mL heparin) and centrifuged at 27,000 × g. Gradients were collected in 1-mL fractions, mRNA was isolated from the fractions using a commercially available kit (Qiagen) according to the manufacturer’s directions, and sqPCR analysis was done as described above.
Immunoblotting.
Western blot analysis was done as described previously (32). Specific antibodies against phosphor and native eIF2α and β-actin were purchased from Cell Signaling Technology. Specific antibodies against ATF4 were purchased from Santa Cruz Biotechnology, and antibodies against IDO1 were as described previously (6).
sqPCR.
RNA from sorted cells was purified using an RNeasy RNA purification kit (Qiagen), and 250 ng of RNA was reverse-transcribed using a random hexamer cDNA reverse-transcription kit (Clontech). For sqPCR, 1 μL of cDNA was amplified with primers as described previously (33). sqPCR was performed using IQ Syber Green Super Mix (Bio-Rad) on an iQ5 real-time PCR detection system (Bio-Rad), and results were analyzed with the accompanying software according to the manufacturer’s instructions.
Lentiviral Transduction.
IDO1 cDNA was cloned into pEGFPN1 (Clontech). The resulting IDO1-GFP fusion protein was subsequently cloned into the lentiviral vector pLenti (a gift from Yukai He, ). Lentivirus was produced by transient transfection of the IDO1-eGFP pLenti construct into HEK293T cells along with packaging plasmids (pMDLg/pRRE, pRSV-Rev, and pMD2.VSV-G) using Expressfect transfection reagent (Denville Scientific). Virus-containing media was collected at 72 h posttransfection, filtered, and titered. For lentiviral infection, BM MΦs (5 × 10⁵ cells/mL) in RPMI 1640 containing 10% FBS were seeded in 24-well plates. The cells were infected with lentiviral vectors at an MOI of 10 in the presence of 8 μg/mL polybrene.
Kynurenine and Trp Measurements by Reverse-Phase HPLC.
HPLC analysis was performed as described previously (33). In brief, for serum measurements of kynurenine and Trp, 100 μL of serum was diluted with an equal volume of 30 mM NaAc (pH 4.0) and then incubated at room temperature for 2 min. Then 50 μL (1/4 volume) of 30% TCA was added, and the sample mixture was incubated on ice for 5 min before being spun in a precooled (4°C) centrifuge at 10,000 × g. Supernatant was then collected for chromatography.
For cell culture supernatants, 100 μL of culture media was diluted with 10 μL (1/10 volume) of 150 mM NaAc (pH 4.0) and incubated at room temperature for 2 min. Then TCA was added as described above, and the sample mixtures were incubated on ice for 5 min. For HPLC, 50 μL of sample was loaded with a Beckman Coulter 508 autosampler and separated on a Shimadzu C18 column under the following conditions: mobile phase A, 2.5% acetonitrile in 15 mM NaAc (pH 4.0); mobile phase B, 100% acetonitrile; flow rate, 1.2 mL/min. The mobile phase was delivered with a Beckman Coulter 126 solvent module at a flow rate of 1.2 mL/min. Kyurenine was detected with a Beckman Coulter 166 detector at 360 nm, and tryptophan was detected using a Jasco FP-1520 fluorescent detector at 285-nm excitation and 365-nm emission wavelengths.
Skin Transplantation.
Female recipient (B6) mice received 107 apoptotic male thymocytes in vivo. After 1 wk, tail skin from donor male mice (∼1 cm2) was placed onto the left thoracic flank region of female mice as described previously (7). Bandages were removed at 7 d after engraftment, and allografts were observed for 50 d. A graft was scored as rejected when ulceration and/or necrosis was evident in >80% of the graft.
D1MT Treatment.
D1MT (Sigma-Aldrich) was prepared as described previously (26). For in vivo use, D1MT in drinking water at 2 mg/mL (or vehicle control) was administered ad libitum to experimental animal groups for the indicated times (34).
Pathology and Immunohistochemistry.
To assess target organ pathology, kidneys were fixed with 10% formalin in PBS for 48 h and then embedded in paraffin. Kidney sections were stained with periodic acid-Schiff reagent to examine the basement membrane.
To assay for immune deposits, kidneys were embedded in Tissue-Tek OCT compound (Sakura) and snap-frozen. Sections (10 μm) were air-dried, fixed with cold acetone, and stained with a 1:200 dilution in PBS plus 1% normal goat serum of FITC-conjugated anti-mouse IgG, anti-mouse IgM, anti-complement C3 (Sigma-Aldrich), or anti-mouse F4/80 (eBiosciences). Sections were mounted with ProLong Gold antifade reagent with DAPI (Invitrogen). Fluorescent images were captured using a Zeiss LSM 510 Meta confocal microscope equipped with 405-, 488-, 561-, and 633-nm lasers.
Proteinuria measurements were conducted on urine collected using Uristix (Siemens) according to the manufacturer’s directions. Glomerular and renal pathology measurements were done as described previously (35).
Assays for Autoantibodies.
In brief, Immulon II plates (Dynatech) precoated with BSA were coated with 50 μg/mL calf thymus dsDNA (Sigma-Aldrich). To assay for serum autoantibody levels, 50 μL of whole blood was collected from the tail vein, and the serum was separated using blood collection micro tubes (Sarstedt) according to the manufacturer’s directions. The serum was diluted 1:200 and assayed for autoantigen reactivity against the plates described above by incubation for 2 h at room temperature. Bound IgG was detected using a goat HRP anti-mouse IgG and IgG3 detection antibody (Bethyl Laboratories), and visualized at 450 nm using TMB substrate (KPL) according to the manufacturer’s directions.
HF Treatment.
HF (Santa Cruz Biotechnology) was stored as a 10 mg/mL stock solution in DMSO at −20 °C. For the in vivo experiments, HF was diluted in PBS to a concentration of 10 μg/mL and given i.p. (1 μg total) twice weekly.
Image and Statistical Analyses.
Image analysis for relative Western blot band intensity was done using ImageJ software unless indicated otherwise. Means ± SDs and unpaired Student t test results were used to analyze the data. When comparing two groups, a P value < 0.05 was considered significant. Survival data were analyzed with Kaplan–Meier survival plots followed by the log-rank test.
Acknowledgments
We thank Dr. Brad Wouters for assistance in this research report. This work was supported by National Institutes of Health Grants AI092213 and AI105500 (to T.L.M.).
Footnotes
The authors declare no conflict of interest.
This article is a PNAS Direct Submission. I.T. is a guest editor invited by the Editorial Board.
This article contains supporting information online at www.pnas.org/lookup/suppl/doi:10.1073/pnas.1504276112/-/DCSupplemental.
References
- 1.Casciola-Rosen LA, Anhalt G, Rosen A. Autoantigens targeted in systemic lupus erythematosus are clustered in two populations of surface structures on apoptotic keratinocytes. J Exp Med. 1994;179(4):1317–1330. doi: 10.1084/jem.179.4.1317. [DOI] [PMC free article] [PubMed] [Google Scholar]
- 2.Rosen A, Casciola-Rosen L. Autoantigens as substrates for apoptotic proteases: Implications for the pathogenesis of systemic autoimmune disease. Cell Death Differ. 1999;6(1):6–12. doi: 10.1038/sj.cdd.4400460. [DOI] [PubMed] [Google Scholar]
- 3.Colonna L, Lood C, Elkon KB. Beyond apoptosis in lupus. Curr Opin Rheumatol. 2014;26(5):459–466. doi: 10.1097/BOR.0000000000000083. [DOI] [PMC free article] [PubMed] [Google Scholar]
- 4.McGaha TL, Chen Y, Ravishankar B, van Rooijen N, Karlsson MC. Marginal zone macrophages suppress innate and adaptive immunity to apoptotic cells in the spleen. Blood. 2011;117(20):5403–5412. doi: 10.1182/blood-2010-11-320028. [DOI] [PubMed] [Google Scholar]
- 5.Ravishankar B, McGaha TL. O death where is thy sting? Immunologic tolerance to apoptotic self. Cell Mol Life Sci. 2013;70(19):3571–3589. doi: 10.1007/s00018-013-1261-0. [DOI] [PMC free article] [PubMed] [Google Scholar]
- 6.Ravishankar B, et al. Tolerance to apoptotic cells is regulated by indoleamine 2,3-dioxygenase. Proc Natl Acad Sci USA. 2012;109(10):3909–3914. doi: 10.1073/pnas.1117736109. [DOI] [PMC free article] [PubMed] [Google Scholar]
- 7.Ravishankar B, et al. Marginal zone CD169+ macrophages coordinate apoptotic cell-driven cellular recruitment and tolerance. Proc Natl Acad Sci USA. 2014;111(11):4215–4220. doi: 10.1073/pnas.1320924111. [DOI] [PMC free article] [PubMed] [Google Scholar]
- 8.Grönwall C, et al. MAPK phosphatase-1 is required for regulatory natural autoantibody-mediated inhibition of TLR responses. Proc Natl Acad Sci USA. 2012;109(48):19745–19750. doi: 10.1073/pnas.1211868109. [DOI] [PMC free article] [PubMed] [Google Scholar]
- 9.Sharma S, et al. Suppression of systemic autoimmunity by the innate immune adaptor STING. Proc Natl Acad Sci USA. 2015;112(7):E710–E717. doi: 10.1073/pnas.1420217112. [DOI] [PMC free article] [PubMed] [Google Scholar]
- 10.McGaha TL, et al. Amino acid catabolism: A pivotal regulator of innate and adaptive immunity. Immunol Rev. 2012;249(1):135–157. doi: 10.1111/j.1600-065X.2012.01149.x. [DOI] [PMC free article] [PubMed] [Google Scholar]
- 11.Liu H, et al. GCN2-dependent metabolic stress is essential for endotoxemic cytokine induction and pathology. Mol Cell Biol. 2014;34(3):428–438. doi: 10.1128/MCB.00946-13. [DOI] [PMC free article] [PubMed] [Google Scholar]
- 12.Baird TD, Wek RC. Eukaryotic initiation factor 2 phosphorylation and translational control in metabolism. Adv Nutr. 2012;3(3):307–321. doi: 10.3945/an.112.002113. [DOI] [PMC free article] [PubMed] [Google Scholar]
- 13.Harding HP, et al. Regulated translation initiation controls stress-induced gene expression in mammalian cells. Mol Cell. 2000;6(5):1099–1108. doi: 10.1016/s1097-2765(00)00108-8. [DOI] [PubMed] [Google Scholar]
- 14.B’chir W, et al. The eIF2α/ATF4 pathway is essential for stress-induced autophagy gene expression. Nucleic Acids Res. 2013;41(16):7683–7699. doi: 10.1093/nar/gkt563. [DOI] [PMC free article] [PubMed] [Google Scholar]
- 15.Ravindran R, et al. Vaccine activation of the nutrient sensor GCN2 in dendritic cells enhances antigen presentation. Science. 2014;343(6168):313–317. doi: 10.1126/science.1246829. [DOI] [PMC free article] [PubMed] [Google Scholar]
- 16.Simpson E, Scott D, Chandler P. The male-specific histocompatibility antigen, H-Y: A history of transplantation, immune response genes, sex determination and expression cloning. Annu Rev Immunol. 1997;15:39–61. doi: 10.1146/annurev.immunol.15.1.39. [DOI] [PubMed] [Google Scholar]
- 17.Kwidzinski E, et al. Indolamine 2,3-dioxygenase is expressed in the CNS and down-regulates autoimmune inflammation. FASEB J. 2005;19(10):1347–1349. doi: 10.1096/fj.04-3228fje. [DOI] [PubMed] [Google Scholar]
- 18.Anderson G, Rodriguez M. Multiple sclerosis, seizures, and antiepileptics: Role of IL-18, IDO, and melatonin. Eur J Neurol. 2010;18(5):680–685. doi: 10.1111/j.1468-1331.2010.03257.x. [DOI] [PubMed] [Google Scholar]
- 19.Kurz K, et al. Effects of adalimumab therapy on disease activity and interferon-γ-mediated biochemical pathways in patients with rheumatoid arthritis. Autoimmunity. 2011;44(3):235–242. doi: 10.3109/08916934.2010.528476. [DOI] [PubMed] [Google Scholar]
- 20.Gurtner GJ, Newberry RD, Schloemann SR, McDonald KG, Stenson WF. Inhibition of indoleamine 2,3-dioxygenase augments trinitrobenzene sulfonic acid colitis in mice. Gastroenterology. 2003;125(6):1762–1773. doi: 10.1053/j.gastro.2003.08.031. [DOI] [PubMed] [Google Scholar]
- 21.Jasperson LK, et al. Indoleamine 2,3-dioxygenase is a critical regulator of acute graft-versus-host disease lethality. Blood. 2008;111(6):3257–3265. doi: 10.1182/blood-2007-06-096081. [DOI] [PMC free article] [PubMed] [Google Scholar]
- 22.McGaha TL, Sorrentino B, Ravetch JV. Restoration of tolerance in lupus by targeted inhibitory receptor expression. Science. 2005;307(5709):590–593. doi: 10.1126/science.1105160. [DOI] [PubMed] [Google Scholar]
- 23.McGaha TL, Karlsson MC, Ravetch JV. FcgammaRIIB deficiency leads to autoimmunity and a defective response to apoptosis in Mrl-MpJ mice. J Immunol. 2008;180(8):5670–5679. doi: 10.4049/jimmunol.180.8.5670. [DOI] [PubMed] [Google Scholar]
- 24.Keller TL, et al. Halofuginone and other febrifugine derivatives inhibit prolyl-tRNA synthetase. Nat Chem Biol. 2012;8(3):311–317. doi: 10.1038/nchembio.790. [DOI] [PMC free article] [PubMed] [Google Scholar]
- 25.Han JM, et al. Leucyl-tRNA synthetase is an intracellular leucine sensor for the mTORC1-signaling pathway. Cell. 2012;149(2):410–424. doi: 10.1016/j.cell.2012.02.044. [DOI] [PubMed] [Google Scholar]
- 26.Munn DH, et al. GCN2 kinase in T cells mediates proliferative arrest and anergy induction in response to indoleamine 2,3-dioxygenase. Immunity. 2005;22(5):633–642. doi: 10.1016/j.immuni.2005.03.013. [DOI] [PubMed] [Google Scholar]
- 27.Baban B, et al. IDO activates regulatory T cells and blocks their conversion into Th17-like T cells. J Immunol. 2009;183(4):2475–2483. doi: 10.4049/jimmunol.0900986. [DOI] [PMC free article] [PubMed] [Google Scholar]
- 28.Sharma MD, et al. Indoleamine 2,3-dioxygenase controls conversion of Foxp3+ Tregs to TH17-like cells in tumor-draining lymph nodes. Blood. 2009;113(24):6102–6111. doi: 10.1182/blood-2008-12-195354. [DOI] [PMC free article] [PubMed] [Google Scholar]
- 29.Sundrud MS, et al. Halofuginone inhibits TH17 cell differentiation by activating the amino acid starvation response. Science. 2009;324(5932):1334–1338. doi: 10.1126/science.1172638. [DOI] [PMC free article] [PubMed] [Google Scholar]
- 30.Feldman S, et al. In vitro assessment of in vivo absorption of drug complexes. J Pharm Sci. 1974;63(3):454–456. [PubMed] [Google Scholar]
- 31.Palmiter RD. Magnesium precipitation of ribonucleoprotein complexes: Expedient techniques for the isolation of undergraded polysomes and messenger ribonucleic acid. Biochemistry. 1974;13(17):3606–3615. doi: 10.1021/bi00714a032. [DOI] [PubMed] [Google Scholar]
- 32.McGaha TL, Phelps RG, Spiera H, Bona C. Halofuginone, an inhibitor of type-I collagen synthesis and skin sclerosis, blocks transforming growth factor-beta–mediated Smad3 activation in fibroblasts. J Invest Dermatol. 2002;118(3):461–470. doi: 10.1046/j.0022-202x.2001.01690.x. [DOI] [PubMed] [Google Scholar]
- 33.Huang L, et al. Engineering DNA nanoparticles as immunomodulatory reagents that activate regulatory T cells. J Immunol. 2012;188(10):4913–4920. doi: 10.4049/jimmunol.1103668. [DOI] [PMC free article] [PubMed] [Google Scholar]
- 34.Sharma MD, et al. Plasmacytoid dendritic cells from mouse tumor-draining lymph nodes directly activate mature Tregs via indoleamine 2,3-dioxygenase. J Clin Invest. 2007;117(9):2570–2582. doi: 10.1172/JCI31911. [DOI] [PMC free article] [PubMed] [Google Scholar]
- 35.Jha V, et al. Lymphocyte Activation Gene-3 (LAG-3) negatively regulates environmentally-induced autoimmunity. PLoS One. 2014;9(8):e104484. doi: 10.1371/journal.pone.0104484. [DOI] [PMC free article] [PubMed] [Google Scholar]