Significance
We use the common biological additive DMSO to show quantitatively the impact that surface-bound water has on interactions between lipid bilayers, the membranes that separate the interior of cells from the surroundings. We present a number of metrics to gauge the hydration of the bilayer surfaces and show how the metrics are affected by the concentration of DMSO in the solvent. This work further connects measurements of surface forces, surface structure and dynamics, and surface water diffusion with significant and broad implications for soft matter systems.
Keywords: dimethyl sulfoxide, hydration shell, membrane interactions, lipid solvation, hydrodynamic radius
Abstract
Dimethyl sulfoxide (DMSO) is a common solvent and biological additive possessing well-known utility in cellular cryoprotection and lipid membrane permeabilization, but the governing mechanisms at membrane interfaces remain poorly understood. Many studies have focused on DMSO–lipid interactions and the subsequent effects on membrane-phase behavior, but explanations often rely on qualitative notions of DMSO-induced dehydration of lipid head groups. In this work, surface forces measurements between gel-phase dipalmitoylphosphatidylcholine membranes in DMSO–water mixtures quantify the hydration- and solvation-length scales with angstrom resolution as a function of DMSO concentration from 0 mol% to 20 mol%. DMSO causes a drastic decrease in the range of the steric hydration repulsion, leading to an increase in adhesion at a much-reduced intermembrane distance. Pulsed field gradient NMR of the phosphatidylcholine (PC) head group analogs, dimethyl phosphate and tetramethylammonium ions, shows that the ion hydrodynamic radius decreases with increasing DMSO concentration up to 10 mol% DMSO. The complementary measurements indicate that, at concentrations below 10 mol%, the primary effect of DMSO is to decrease the solvated volume of the PC head group and that, from 10 mol% to 20 mol%, DMSO acts to gradually collapse head groups down onto the surface and suppress their thermal motion. This work shows a connection between surface forces, head group conformation and dynamics, and surface water diffusion, with important implications for soft matter and colloidal systems.
Solute additives (e.g., osmolytes or denaturants) often play a key role in modulating biological interactions, where molecules can recognize each other and form assemblies. Dimethyl sulfoxide [DMSO, (O = S)(CH3)2] and DMSO–water mixtures in particular have attracted particular interest in biology and chemistry. DMSO is one of the most commonly used cryoprotectants in cellular systems (1), where it colligatively reduces the melting point of aqueous solutions and exerts additional effects that prevent cellular damage on freezing/vitrification. Additional effects not seen with conventional glycol- and saccharide-based cryoprotectants include an increase in lipid membrane permeability of an array of solutes (2), promotion of cell fusion (3) and differentiation (4), and enhanced membrane resealing after damage (5). These phenomena are well-documented along with their dependence on DMSO concentration, but the molecular behavior of DMSO near lipid membranes remains a mystery.
Bulk properties of DMSO–water mixtures are well-characterized. The oxygen and sulfur atoms of DMSO have a partial negative and positive charge, respectively, giving rise to a dipole moment of 3.96 Debye that exceeds nearly all conventional solvents. Dielectric relaxation spectroscopy (6), molecular dynamics simulations (7), and 1H NMR studies (8) have shown that bulk water forms hydrogen bonds with the oxygen of DMSO in the ratio of 1:2 (DMSO:water), bonds that are approximately five times longer lived than water–water hydrogen bonds (7). Consequently, DMSO–water mixtures near this 1:2 ratio display maxima or minima in density (9), viscosity (9), freezing point (10), and heat of mixing (11) among other properties (8). However, any experimental quantification of the properties of DMSO–water bonds at the lipid membrane surface (let alone as a function of DMSO concentration) remains unknown.
Previous work has primarily focused on DMSO–lipid interactions and the subsequent effects on thermotropic lipid-phase behavior, typically involving the most biologically prevalent class of lipid: phosphatidylcholine (PC). IR spectroscopy experiments (12) have suggested that the partially charged atoms of DMSO associate with oppositely charged moieties of gel-phase dipalmitoylphosphatidylcholine (DPPC) lipid head groups, potentially replacing water–lipid hydrogen bonds. Differential scanning calorimetry studies have found DMSO to monotonically increase the chain melting temperature (Tm) of DPPC lamellae (13). Concentrations of DMSO above 10 mol% (1 DMSO molecule per 9 water molecules) at 25 °C induce a subgel phase (14), which is characterized by different head group ordering. Small-angle X-ray and neutron scattering studies (15–17) have shown that DMSO substantially decreases the solvent gap thickness (equilibrium separation) between lamellae of both gel-phase and fluid PC multilamellar vesicles. Explanations for the phase behavior and equilibrium separation phenomena often implicate some mechanism of head group dehydration/desolvation brought about by DMSO (14, 16, 18).
Recent measurements of translational water diffusivity within ∼1 nm of the surface of unilamellar DPPC (gel phase) and dioleoylphosphatidylcholine (DOPC, fluid phase) vesicles using the Overhauser Dynamic Nuclear Polarization relaxometry technique (19) show a continual increase in water diffusivity with DMSO concentration (20). Water diffusivity, Dw, near the head groups increased ∼50% in going from 0 mol% DMSO (pure water; Dw = 7.7 × 10⁻¹⁰ m2/s) to 7.5 mol% DMSO (Dw = 11.4 × 10⁻¹⁰ m2/s) for DPPC membranes, whereas the mobility and ordering of PC head groups remained constant up to 10 mol% (20). This hydration dynamics study is perhaps the strongest evidence yet of DMSO weakening the cohesion of the surface water, which suggests that head group dehydration is facilitated at DMSO concentrations <10 mol%. Although plausible, no rigorous connection has been experimentally established between solvent dynamics and the forces that govern membrane fusion, permeability, or the equilibrium separation of bilayers in multilamellar lipid membrane systems.
Using the surface forces apparatus (SFA) technique, the force–distance measurements between supported DPPC bilayers presented in this work offer a quantitative description of the effect of DMSO on lipid solvation-length scales. We restrict ourselves to DMSO concentrations <20 mol%, which many of the aforementioned literature studies have done. A pulsed field gradient (PFG) NMR study of molecular diffusion and SFA measurement showing hydration of the choline moiety provide independent support of the quantifications made from fitting the interbilayer forces. Short-range forces (at surface separations <2 nm) are especially informative and sensitive to the DMSO concentration, acting at distances where one would expect effects on membrane rigidity, head group ordering, and solvent structure to manifest themselves. The role of water in short-range bilayer interactions has been a point of contention (21–23), especially in explaining the pseudoexponential repulsion commonly observed below ∼2 nm of separation. It has been argued that solvent-structural “hydration forces” govern this repulsion (24) and conversely, that entropic fluctuations of thermally mobile head groups dominate the interaction (25). Through modulating the solvation of lipid head groups with DMSO, this study provides direct insight into addressing this fundamental question of the existence and origin of hydration forces.
Results and Analysis
Equilibrium Force–Distance Measurements.
To determine the effects of the additive DMSO on the lipid bilayer interactions, the interaction forces were measured with SFA. Briefly, in SFA experiments, the absolute distance between back-silvered mica surfaces in a cross-cylinder geometry is measured with interferometry, and the force, F, is measured by the deflection of a cantilever spring (26). Force–distance profiles are typically shown as the force, F, normalized by the radius of the surfaces, R, plotted against the separation distance, D (i.e., F/R vs. D). Force is converted to the interaction energy between flat plates, W, using the Derjaguin Approximation, W = F/2πR (27) (valid for weak adhesion, which is the case in this work). Before each experiment, the mica sheet thicknesses are measured followed by Langmuir–Blodgett deposition of bilayers as described in Materials and Methods.
The zero distance, D = 0, corresponds to the hypothetical bilayer–bilayer contact in air—a convention often used in SFA and osmotic stress measurements between bilayers (24, 28). Thermal fluctuations of the head groups and their associated hydration in water prevent the surfaces from approaching D = 0 in practice. The single-bilayer anhydrous thickness, To, was found to be 5.0 ± 0.1 nm (the procedure is described in Materials and Methods).
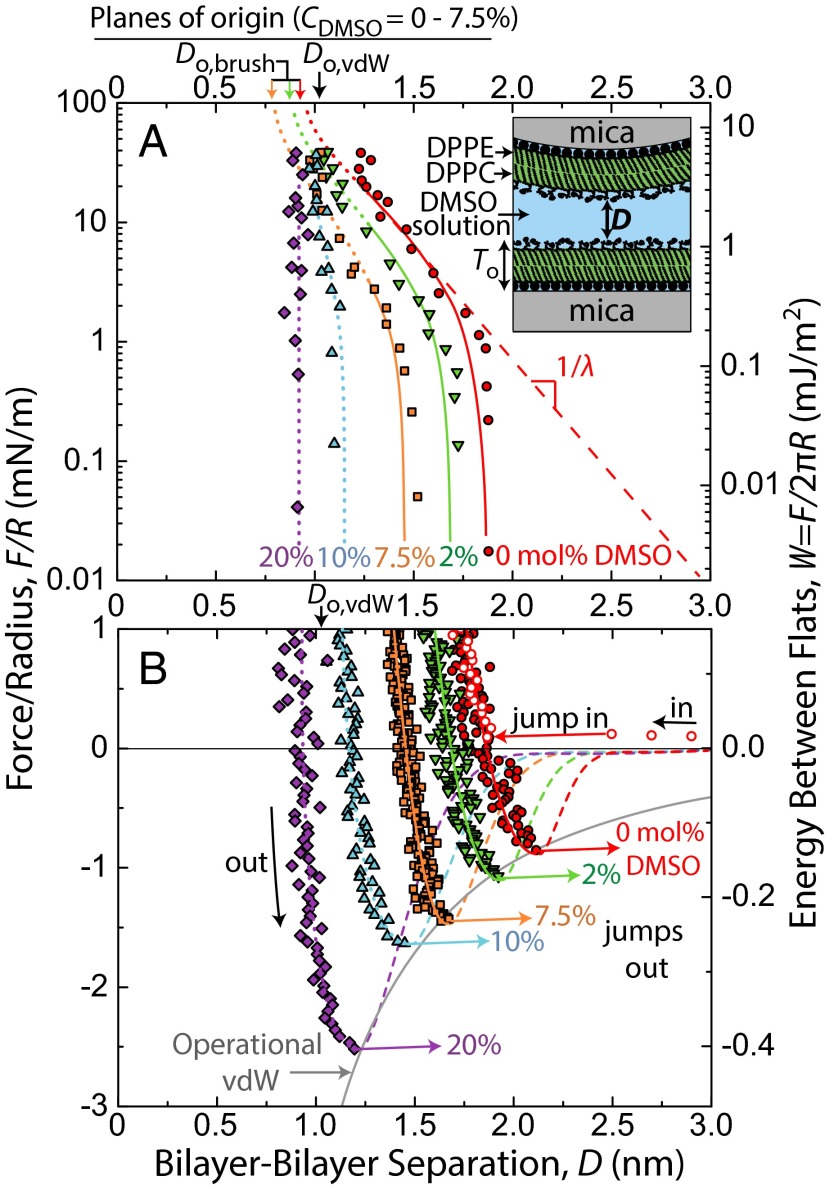
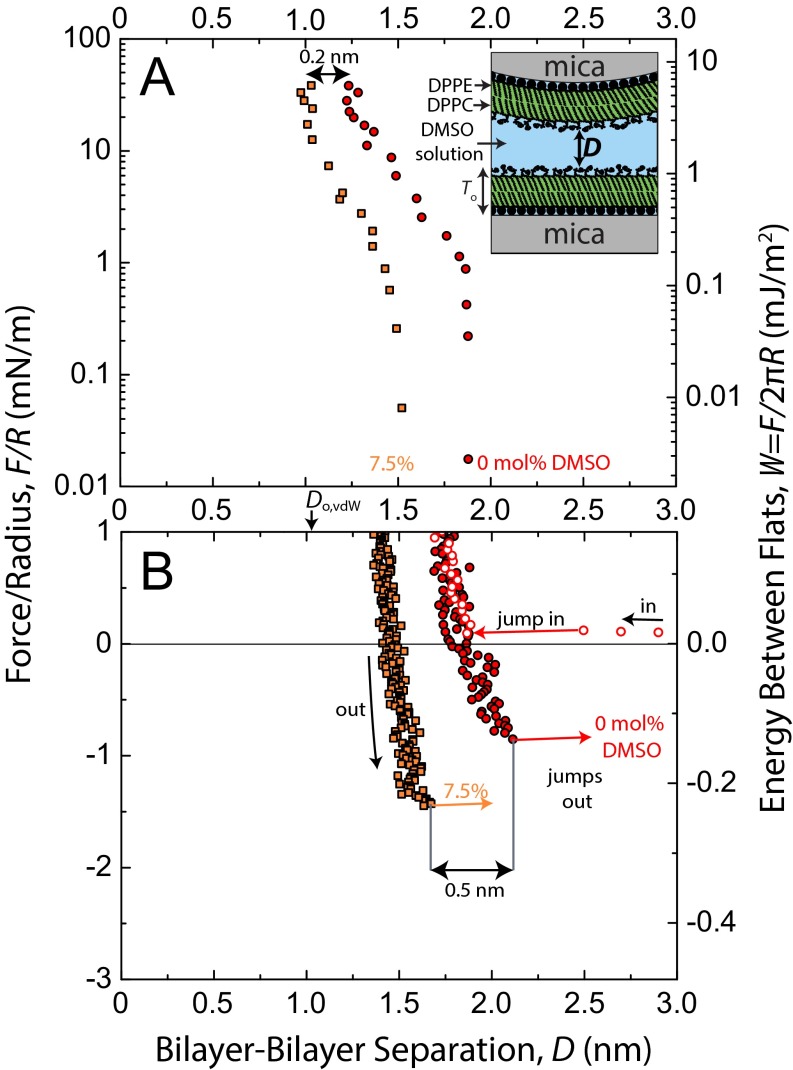
Representative force–distance profiles, F/R vs. D, for DMSO concentrations, CDMSO, between 0 mol% and 20 mol% are shown in Fig. 1. Quasistatic force measurements were taken in the repulsive regime (Fig. 1A) using a piezoelectric crystal to move one surface in steps of 2–20 nm, with subsequent 30 s of equilibration time before the separation distance, D, was measured. In the attractive regime (Fig. 1B), measurements were made dynamically but very slowly, wherein one surface was driven at a constant speed (0.1–0.2 nm/s). Values for the adhesive force, Fad/R, are given by the depth of forces into the attractive regime before the jump out, a mechanical instability dependent on spring stiffness. Dynamic measurements allowed for more accurate determination of adhesive force, Fad/R (±0.1 mN/m), and the corresponding separation distance at which the jump out occurs at Do (±0.1 nm) on separation of the surfaces.
Fig. 1.
Forces, F, measured between mica-supported gel-phase DPPC bilayers in DMSO–water mixtures at 22 °C and pH 6.0 ± 0.2. Solid colored lines corresponding to 0 mol%, 2 mol%, and 7.5 mol% DMSO runs are fits comprised of polymer brush and van der Waals forces. Force curves for 10% and 20% DMSO were unable to be fitted with the polymer brush equation owing to their steepness in the repulsive regime, but corresponding hand-drawn (dotted) lines were included for consistency. (A) Static measurements of repulsive forces on a semilog plot. Values for the fits at D < 1.3 nm were drawn by hand (dotted) because of mathematical divergence of the van der Waals force near Do,vdw. The steep upturns of forces above 20 mN/m in the 0–7.5 mol% data series occurred when the surfaces began deforming noticeably, resulting in inaccurate R values. (B) Adhesion forces, Fad, measured on slow separation of the surfaces. Dashed lines show a reduced van der Waals force resulting from screening of the Hamaker constant by the zwitterionic head groups (28). The solid gray line corresponds to a van der Waals force (Do,vdw = 0 nm, A = 2.3 × 10⁻²⁰ J), which may be operationally used to describe adhesion forces in this system but was not used in the full fits of the force curves.
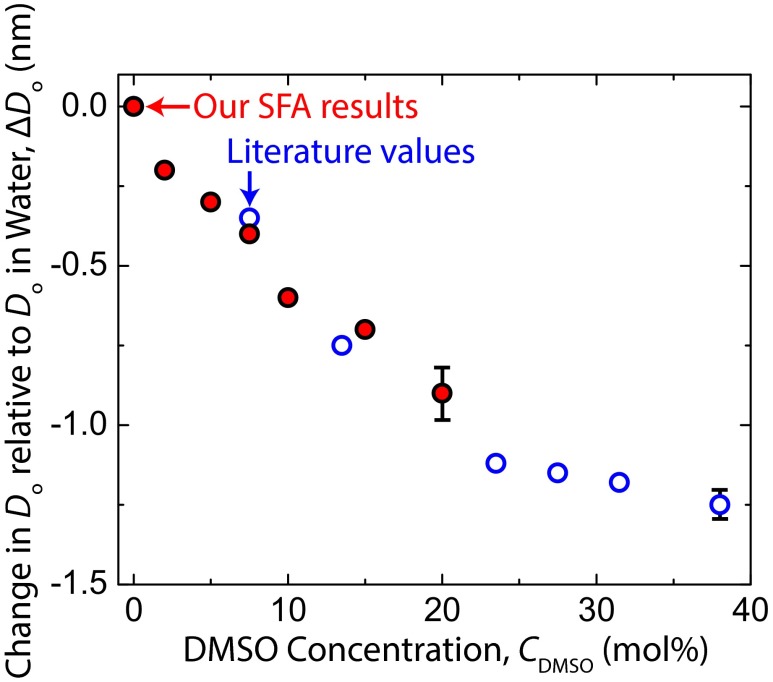
Adhesive forces/energies increased monotonically with CDMSO, and the value at CDMSO = 20 mol% (Fad/R = −2.6 mN/m, Wad = −0.41 mJ/m2) was approximately three times that in water (Fad/R = −0.9 mN/m, Wad = −0.14 mJ/m2). The separation where the adhesive force is measured, Do, corresponds to the equilibrium separation (i.e., the energy minimum) between flat plates by way of the Derjaguin Approximation. Do decreased monotonically with CDMSO. Explanations for these trends are given in Discussion and Conclusions. The equilibrium water gap thickness between lamellae of gel-phase multilamellar vesicles has been measured as a function of DMSO concentration by using small-angle neutron scattering (15), with quantitative values comparable with our Do values (Fig. S1).
Fig. S1.
Comparison of Do values measured in SFA experiments with the values for water gap thickness measured between lamellae of gel-phase dimyristoylphosphatidylcholine multilamellar vesicles using small-angle neutron scattering (15). Because of different conventions for defining D = 0 between our measurements and the literature scattering measurements, the y axis is the change in Do relative to the Do in pure water, with this change denoted as ΔDo. Characteristic errors are shown as the rightmost point of each data series.
Forces between bilayers in DMSO–water mixtures have been measured one time before (29). SFA measurements of DOPC bilayers in a 10 mol% DMSO solution showed that Fad/R approximately doubled in going from 0 mol% to 10 mol% DMSO, which is in agreement with our measurements. Because the measurements were done on fluid-phase bilayers, additional effects, such as bilayer fusion and nonreversible structural disruption, were observed that do not appear in our gel-phase measurements.
Fitting Models for Force Curves.
The measured force–distance profiles for CDMSO ≤ 7.5 mol% can be fitted with a high degree of accuracy in the range 1.3 nm < D < 2.2 nm using two components of force, an attractive van der Waals force, and a repulsive hydrated head group overlap (polymer brush) force. The van der Waals equation is as follows (Eq. 1):
| [1] |
where A is the Hamaker constant, which can be fitted and also calculated from the dielectric constant and refractive index of the bilayers and solution, and Do,vdw is the plane of origin from which the force effectively originates owing to the head groups that protrude ∼0.5 nm out from the anhydrous thickness, D = 0, of each bilayer. The head group overlap force contribution, slightly modified to account for hydration-excluded volume effects, is as follows (Eq. 2) (30):
| [2] |
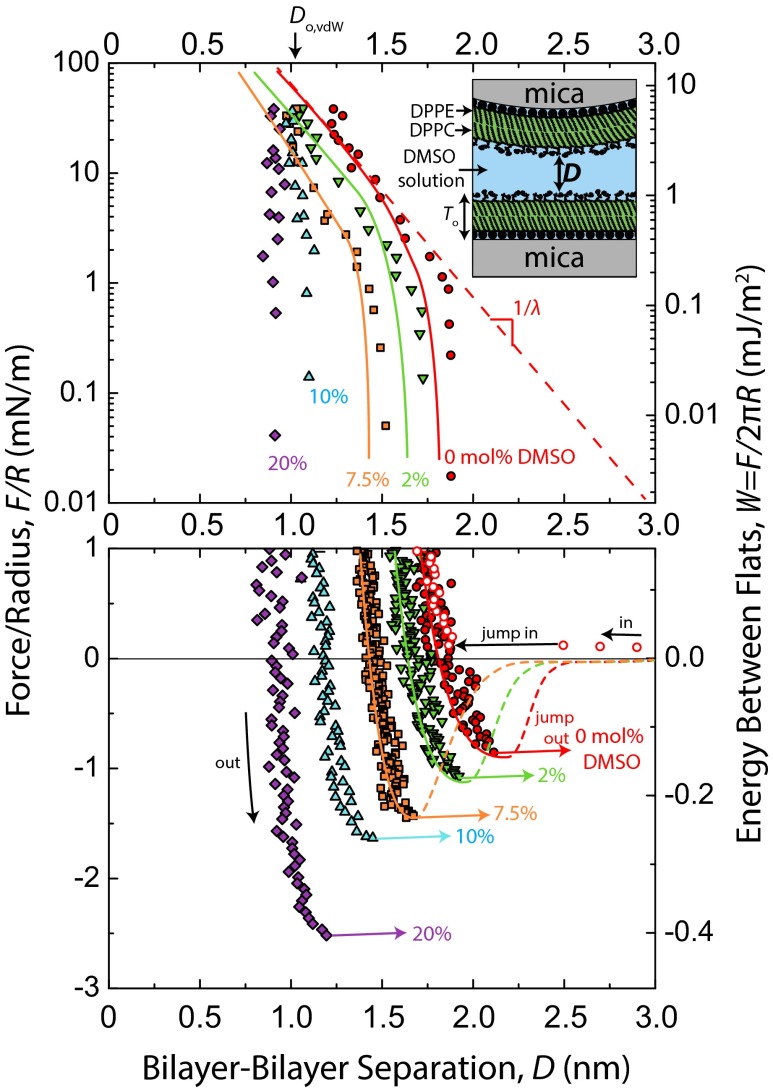
over the range Do,brush < D < Do,brush + 2L, where Do,brush is the plane of origin of the force, L is the height of the hydrated head group brush, and s is the lateral separation between head groups. Hydration effects are often not explicitly accounted for, because typical brush heights greatly exceed solvent dimensions. The Do,brush term is included here to account for such effects, analogous to the van der Waals excluded volume correction to the pressure of a gas; becomes [V(1 − b/V)]−1, which is used to calculate finite ion sizes in surface forces measurements (27). Fitting parameters and associated SDs used in Eqs. 1 and 2 are shown in Table 1. For D/2L in the range 0.2–0.9, Eq. 2 is roughly exponential, with a decay length λ = L/π. Fits using this exponential approximation are given in Fig. S3 and Table S1. At concentrations CDMSO ≥ 10 mol%, the repulsive force was too steep to obtain an accurate value of λ or L.
Table 1.
| Mol% DMSO | Brush length,* L (±0.03 nm) | Lateral head group separation, s (±0.1 nm) | Plane of origin, Do,brush (±0.1 nm) | Hamaker constant, A (×10−21 J) | |
| Fitted,† ±0.4 | Theoretical‡ | ||||
| 0 | 0.64 | 1.4 | 0.9 | 7.0 | 7.0 |
| 2 | 0.57 | 1.3 | 0.9 | 6.2 | 6.4 |
| 5 | 0.53 | 1.2 | 0.8 | 5.1 | 5.4 |
| 7.5 | 0.47 | 1.1 | 0.8 | 4.3 | 4.9 |
| 10 | § | § | § | 2.6 | 4.4 |
| 15 | § | § | § | 2.3 | 3.7 |
| 20 | § | § | § | 0.8 | 3.2 |
Corresponding decay lengths (λ; ±0.01 nm) in the exponential regions are 0.20, 0.18, 0.17, and 0.15 nm, respectively.
Fitted A values were calculated using a constant Do,vdw of 1.05 nm (28).
Theoretical values for A calculated using values of dielectric constant (ε1 = 3.8) and refractive index (n1 = 1.464) for bilayers and bulk values of ε3 and n3 for the solvent (9) (Fig. S2).
Meaningful fitting parameters could not be obtained because of the steepness of the force in the repulsive regimes.
Fig. S3.
Force, F, measured between mica-supported gel-phase DPPC bilayers in DMSO–water mixtures at 22 °C and pH 6.0 ± 0.2 (same data as in Fig. 1). Solid colored lines corresponding to 0 mol%, 2 mol%, and 7.5 mol% DMSO runs are fits comprised of an exponential repulsion (as opposed to the power law of polymer brush) and van der Waals forces. Fits at D <1.3 nm were drawn by hand.
Table S1.
Parameters for exponential repulsion and Van der Waals (Eq. 1) fits
| Mol% DMSO | Decay length, λ (±0.01 nm) | Prefactor, P (×105 mN/m) | Hamaker constant (×10−21 J) | |
| Fitted* (±0.4) | Theoretical | |||
| 0 | 0.20 | 0.3 | 10.4 | 7.0 |
| 2 | 0.17 | 0.7 | 8.7 | 6.4 |
| 5 | 0.16 | 1.0 | 7.6 | 5.4 |
| 7.5 | 0.13 | 3.8 | 5.8 | 4.9 |
| 10 | — | — | 2.6 | 4.4 |
| 15 | — | — | 2.3 | 3.7 |
| 20 | — | — | 0.8 | 3.2 |
Fitted A values were calculated using a constant Do,vdw of 1.05 nm.
For all of the data series corresponding to CDMSO ≤ 7.5 mol% in Fig. 1, forces at D < 1.3 nm were not fitted, and thus, the fits in this range are drawn by hand. At separations D < 1.3 nm, the sum of Eqs. 1 (for van der Waals) and 2 (for head group overlap) begins to diverge strongly toward negative values of F because of the D−2 dependence of the van der Waals contribution. This divergence has never been observed experimentally, likely because of a reduction in Do,vdw on compression of the bilayers. Forces on approach at separations D > Do (shown only for CDMSO = 0%) were not fitted with Eq. 1 or Eq. 2 but likely contain contributions from the van der Waals force reduced by a factor of ∼6 because of screening of the zero-frequency contribution of A by the zwitterionic head groups (28) and a weak electrostatic repulsion. The electrostatic repulsion is caused by either a residual potential from the mica surface (corresponding to a surface potential ψ ∼ 30 mV) or traces of charged lipid impurities in the bilayer (ψ ∼ 20 mV). The latter has been observed several times previously (31, 32).
At CDMSO ≤ 7.5 mol%, fitted and theoretical values of A are in good agreement with each other using a constant van der Waals plane of origin, Do,vdw = 1.05 nm (28). The discrepancy at CDMSO ≥ 10 mol% could be caused by a large difference in the dielectric properties between the interfacial and bulk solvent, but one might expect this difference to exist at the lower DMSO concentrations as well. Alternatively, a slight reduction of Do,vdw for CDMSO ≥ 10 mol% would rationalize the difference. The values for Do,vdw, which make the fitted and theoretical A values match, are, for 10, 15, and 20 mol% DMSO, 0.9 ± 0.1, 0.9 ± 0.1, and 0.7 ± 0.1 nm, respectively. These values for A correspond physically to a change in head group conformation, resulting in Do,vdw for each bilayer shifting ∼0.1 nm inward toward the respective hydrocarbon regions relative to Do,vdw in CDMSO < 7.5 mol% solutions.
The adhesive force between the bilayers increases monotonically with CDMSO, despite a monotonically decreasing value of A (shown in Table 1), which indicates that the increased attraction is caused by a decreased range of the repulsive force. A similar conclusion was reached by Claesson et al. (33) in measurements of forces between poly(ethylene oxide) (PEO) monolayers in water. With an increase in temperature, Claesson et al. (33) observed an increase in adhesion and a decrease in Do, which were shown to be a result of a decreased range of the steric hydration force caused by dehydration of PEO groups rather than augmentation of the attractive van der Waals force. In this work, at CDMSO < 10 mol%, values for L and Do,brush decreased with increasing CDMSO, suggesting either a gradual collapse of the head groups or more likely, a gradual decrease in head group hydrated excluded volume, which is addressed in Discussion and Conclusions. The fitted head group separation, s, decreased slightly as well but always exceeded the predetermined value of 0.72 nm according to head group density. Even in grafted polymer brush systems, fitted values of s are known to vary from actual values for a number of reasons (25, 30, 34). In this case, the effect of lateral diffusion of head groups and their short length compared with the typical polymer brush make the trend in s difficult to interpret physically.
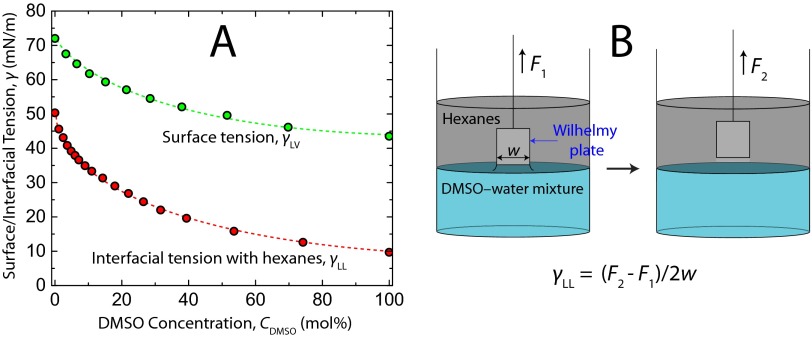
It is worth noting the other potential contributions to short-range bilayer interaction that are often considered but do not seem to be of significance in our results. Four main contributions to the steric hydration repulsion between bilayers have been identified in the literature (25): undulation (Helfrich), protrusion, peristaltic (bilayer compression), and head group overlap. The entropic nature of these forces allows one to include hydration-excluded volume effects through shifts in planes of origin without the addition of a separate hydration force. The undulation force arises from the suppression of long-wavelength thermal ripples in the free-standing membranes on surface approach and can be ruled out in measurements between supported bilayers, which is the case in this work. The protrusion force arises from suppression of molecular-scale protrusions of lipids into the solution. It is approximately exponential at D > 1.1 nm, and the decay length is inversely proportional to the interfacial energy of the solvent–hydrocarbon interface (25). This interfacial energy, however, decreases monotonically with DMSO concentration (Fig. S4), a trend that would dictate a longer decay length with increasing DMSO concentration, and therefore, changes in the protrusion force alone cannot explain the presented trends. Bilayer compressibility is not explicitly known as a function of DMSO concentration, but in pure water, McIntosh and Simon (35) found through X-ray diffraction that gel-phase DPPC bilayer thickness does not change by more than 3% on approach to 0.2-nm separation. Moreover, Marra and Israelachvili (28) found only a 0.1-nm decrease in the thickness of fluid-phase egg PC bilayers on compressing to F/R > 20 mN/m (D = 0.9 nm) in water through refractive index measurements. Therefore, contributions from the peristaltic force are also neglected. Thus, head group overlap is left as the primary contributor to the repulsive force.
Fig. S4.
(A) Surface tension (50) and hydrocarbon interfacial tension, γLL, of DMSO–water mixtures at 25 °C and (B) the Wilhelmy plate method used to measure interfacial tensions in a glass beaker.
With such large DMSO concentrations, one might expect significant contributions from a depletion force in our measurements, but we believe that this is not the case. DMSO depletion would dictate adhesive forces ∼100 times larger than those observed experimentally. Additional reasoning is given in SI Text, section S5.
Regardless of the fitting equation(s) used, the trend of the repulsive forces becoming shorter-ranged with added DMSO is apparent, and semiquantitative statements about the role of hydration forces can be made. For example, looking at Fig. 1A and Fig. S5 for more detail, one could say that, at F/R ∼ 20 mN/m, the interaction force in 0% solution is shifted ∼0.1 nm outward (to higher D values) per bilayer more than that in 7.5 mol% solution, despite a difference of 0.2–0.3 nm in extension of the uncompressed and fully hydrated head groups into solution (based on Do values), suggesting that approximately one layer of bound/hydration water is removed from the interfacial region in 0% DMSO solution on compression to 20 mN/m. The presented method of analysis offers a number of parameters that aid in physical interpretation: L, Do,brush, and fitted A (or shifts in Do,vdw), but it is difficult to definitively conclude from SFA measurements alone how much DMSO affects the hydrated excluded volume of the head groups, whereas it is clear that DMSO reduces the interbilayer repulsion.
Fig. S5.
SFA measurements between DPPC bilayers in 0 mol% and 7.5 mol% DMSO solutions (data identical to those shown in Fig. 1). (A) The difference between separations at compressions >20 mN/m is 0.2 nm and (B) the difference between equilibrium separations, Do, where the head groups are uncompressed, is 0.5 nm.
NMR Measurements of Phosphate and Tetramethylammonium Hydrodynamic Radius.
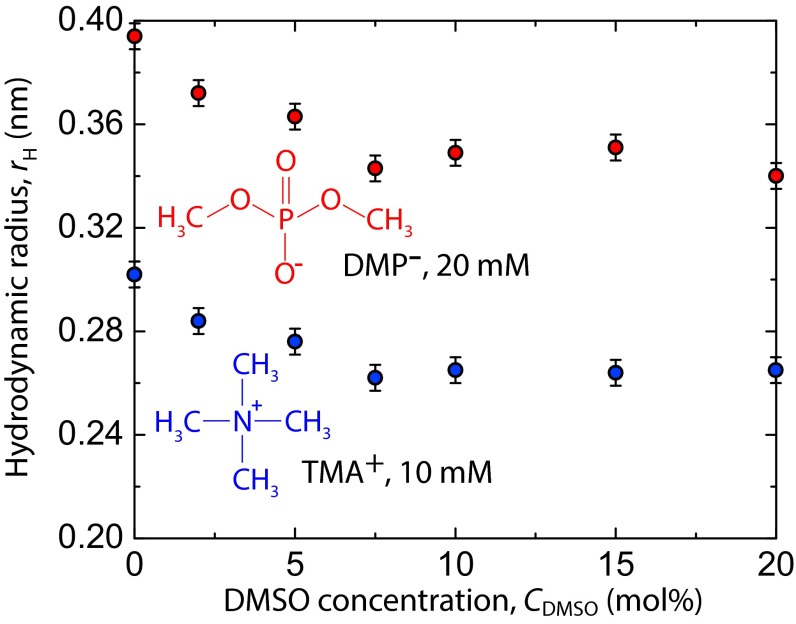
PFG NMR is a well-established technique to measure bulk solute diffusivity averaged over milliseconds to seconds observation times, from which an effective hydrated solute size, time-averaged over the applied observation window, can be extracted (36). The effect of DMSO on the solvated radius of the lipid head group was examined by diffusion NMR measurements on model PC head group moieties in bulk solution: dimethyl phosphate (DMP−) and tetramethylammonium (TMA+) molecules. The measured solvent viscosities (Table S2) and solute diffusivities were used to calculate the solute hydrodynamic radius, rH, using the Stokes–Einstein equation (Materials and Methods). Fig. 2 shows solute rH at values of CDMSO, where the SFA measurements were conducted.
Table S2.
Viscosity of DMSO-d6–D2O mixtures at 25 °C
| Mol% DMSO-d6 | Viscosity, η (±0.005 cP) |
| 0 | 1.1044 |
| 2 | 1.3259 |
| 5 | 1.6276 |
| 7.5 | 1.9219 |
| 10 | 2.2492 |
| 15 | 2.9152 |
| 20 | 3.5430 |
Fig. 2.
Hydrodynamic radii, rH, of DMP− and TMA+ as calculated from bulk NMR diffusion measurements in DMSO-d6–D2O–salt mixtures at 25 °C. Measurements were made on solutions containing 20 mM NaDMP (∼0.05 mol%) and 10 mM TMACl (∼0.025 mol%).
Values of rH steadily decreased for both ions up to CDMSO = 7.5 mol%, after which point values remained constant within error. The decrease in DMP− solvated volume was 0.1 nm3 in going from CDMSO = 0 mol% to 10 mol%, perhaps corresponding to an equivalent shedding of approximately seven water molecules from the solvation shell. The decrease in TMA+ solvated volume was 0.04 nm3 over the same range of CDMSO, which corresponds to approximately three water molecules. The diffusion NMR measurements, although not quantitatively transferable to SFA fitting parameters, show a solvation contribution to the decreased range of the repulsion observed in SFA measurements on increasing CDMSO from 0 mol% to 7.5 mol%.
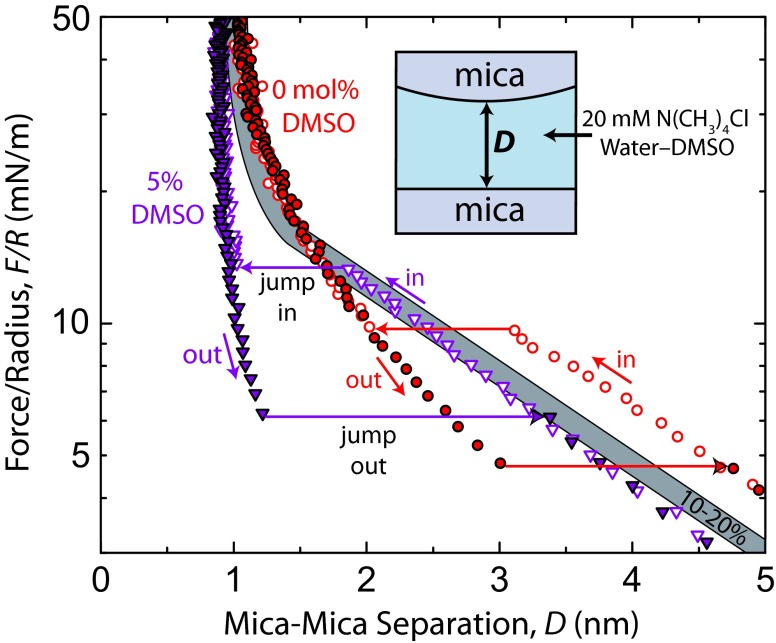
In addition to bulk NMR measurements, SFA measurements between mica surfaces (without lipids) in aqueous salt solutions can give clear information about cation hydration. Cations adsorb to the negatively charged mica surfaces, and upon bringing the surfaces together, dehydration of the adsorbed cations gives rise to a repulsive hydration force—the magnitude and range of which are larger for more hydrated cations (37). SFA measurements between mica surfaces in ternary mixtures of water, DMSO, and TMACl are shown in Fig. S6. The results show a decreased range of the hydration force in going from 0 mol% to 10 mol% DMSO and little effect beyond, which corroborates the trend in rH values for TMA+ measured with NMR.
Fig. S6.
Forces measured between muscovite mica surfaces in TMACl–DMSO–water mixtures (at 20 mM TMACl concentration) at 22 °C and pH 6.0 ± 0.2 presented on a semilog plot. Force runs at 10 mol%, 15 mol%, and 20 mol% DMSO overlapped and are displayed with the gray bar. Corresponding mica surface potentials, ψ, and charge densities, σ, for 0 mol%, 5 mol%, and 10–20 mol% DMSO are ψ = 110 mV (σ = 1 e−/2.3 nm2), 80 mV (1 e−/4.2 nm2), and 85 mV (1 e−/3.8 nm2), respectively.
Discussion and Conclusions
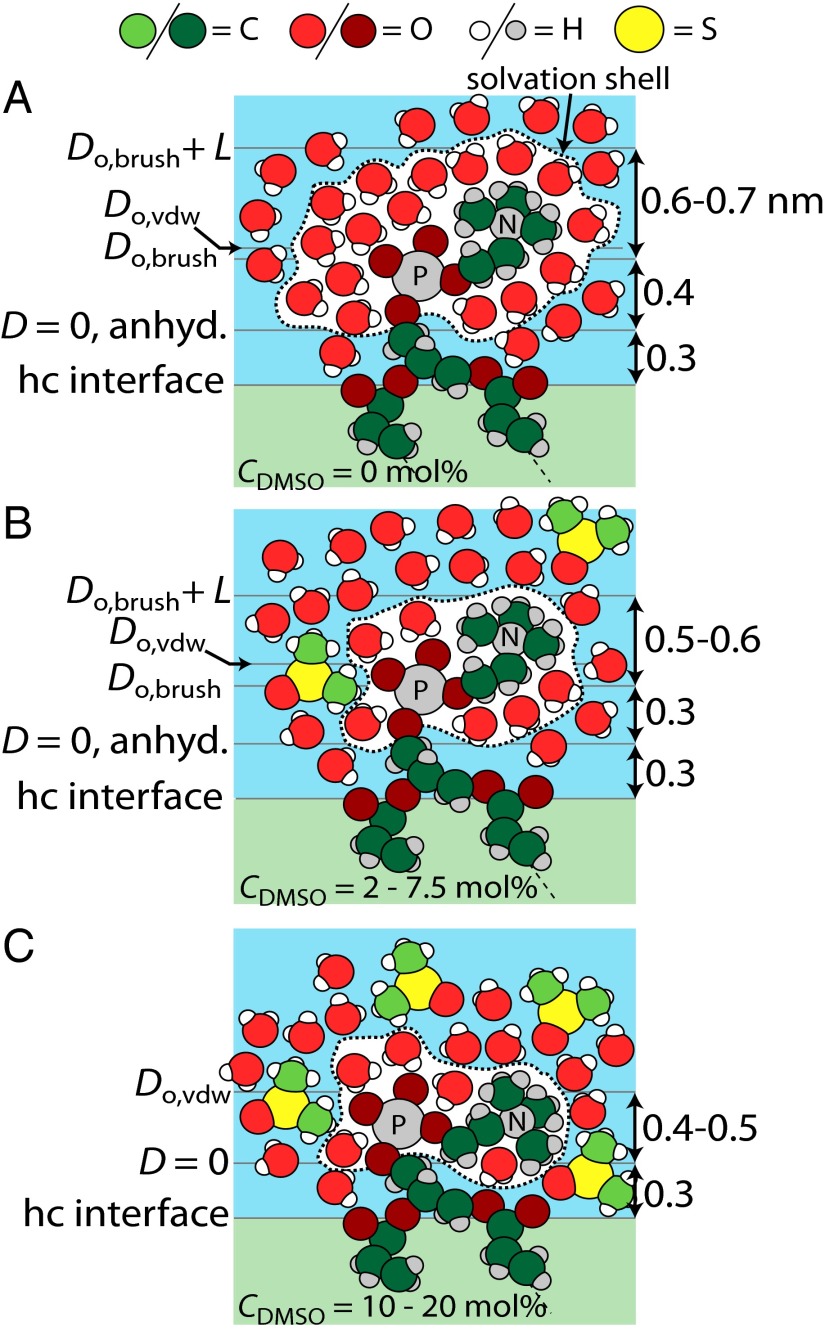
The SFA and NMR measurements described above, in addition to literature observations, suggest two regimes of DMSO interaction with the PC head group. The first regime, illustrated in Fig. 3B (CDMSO = 2–7.5 mol%), is partly characterized by unchanging head group ordering and dynamics according to 31P NMR anisotropy measurements and the electron paramagnetic resonance (EPR) line shape of nitroxide spin probes tethered to the PC group (20). Scattering studies in the literature, although relatively insensitive to choline position, have also shown no indication of a change in head group conformation over this concentration range (14). Based on this knowledge, the presented SFA and NMR measurements show a gradual decrease in the solvated size of the PC head group that occurs in this regime of DMSO concentration. The decrease in L and Do,brush observed in the SFA measurements may have a small contribution from a gradual collapse of the head groups but is mostly caused by a decrease in PC head group-excluded volume because of its desolvation. It follows that the decreasing range of the repulsion between bilayers shown in this work in going from 0 to 7.5 mol% DMSO is a desolvation effect.
Fig. 3.
Schematic views of the PC head group in DMSO–water mixtures with various dimensions and planes of origin drawn to scale in (A) pure water, (B) 2–7.5 mol% DMSO, and (C) 10–20 mol% DMSO. Atoms labeled P and N represent phosphorous and nitrogen, respectively. The hydrocarbon/head group interface labeled “hc interface” is drawn at the height of the carbonyl groups. The van der Waals plane of origin, Do,vdw, is located at the same height in A and B, because the position of the choline is relatively unchanged between the two scenarios. Brush length, L, and brush plane of origin, Do,brush, are smaller in B than in A because of a decrease in head group-excluded volume (i.e., dehydration). Do,vdw is smaller in C than in B, reflecting gradual collapse of the choline at large DMSO concentrations and orientation of the P-N vector parallel with the plane of the bilayer. In C, the corresponding bilayer displays little to no polymer brush character in SFA measurements.
In the second regime, illustrated in Fig. 3C (CDMSO = 10–20 mol%), head groups are gradually collapsed down onto the surface, and their mobility suppressed, which is, once again, corroborated by the EPR and NMR measurements in ref. 20. The repulsive force in Fig. 1A rises steeply and can no longer be described by Eq. 2 for brushes. The van der Waals plane of origin, Do,vdw, subsequently shifts inward ∼0.1 nm for each bilayer. However, the NMR measurements suggest that the solvated radius remains constant within this regime, indicating that the mobility of the head groups is suppressed while they remain solvated to a similar degree.
Although our measurements cannot directly probe the placement and conformation of DMSO around the head groups, we can deduce that DMSO must not be strongly bound to either the phosphate or choline. If the DMSO molecule, approximately a sphere with a diameter of 0.58 nm (38), were to bind strongly and replace water tightly bound to the charged moieties of the head group, one would expect the hydrodynamic radius (as probed by NMR) and excluded volume to increase. Rather, the DMSO competes with the PC head group for hydrogen bonds and favorable electrostatic interactions with water. Recalling that water–DMSO hydrogen bonds are stronger than water–water hydrogen bonds (7), it follows that such competition tends to draw bound water out of its strongly oriented and tightly bound state. The driving force for the change in head group conformation above 10 mol% DMSO is unclear, but based on the SFA fitting parameters, we propose that DMSO gradually collapses the PC head group and thus, decreases the angle between the membrane plane and P-N vector as illustrated in Fig. 3C. Perhaps the DMSO dehydrates the carbonyl or glycerol portions of the lipid in this regime, allowing for collapse of the head group. It should be noted that the above mechanisms are not general to all cryoprotectants or polar cosolvents, which is shown in a control experiment using glycerol instead of DMSO (Fig. S7).
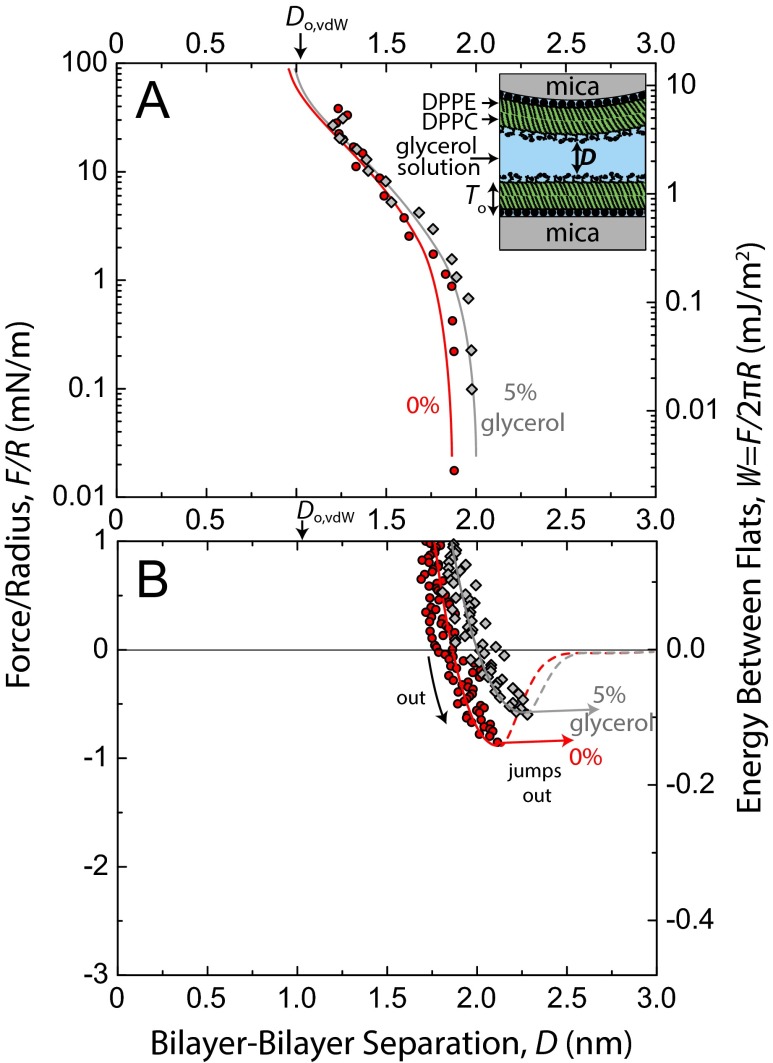
Fig. S7.
Force curves and fits (head group overlap + van der Waals) between DPPC bilayers in 0 mol% and 5 mol% glycerol solutions in (A) the repulsive regime and (B) the attractive regime. Average fitting parameters for 5% glycerol force runs were as follows: L = 0.68 ± 0.03 nm, s = 1.5 ± 0.1 nm, Do,brush = 0.96 ± 0.04 nm, fitted A = (5.3 ± 0.3) × 10−21 J, theoretical A = 5.4 × 10⁻²¹ J, and Do,vdw = 1.05 nm.
By concluding that the shortening of the range of the repulsive force in going from 0 mol% to 7.5 mol% DMSO is primarily a solvation effect, we infer that the role of water in lipid membrane interactions is to extend the range and decay length of the interaction, a conclusion reached several times previously by experimental and theoretical methods (22, 25, 39). This extension is generally not referred to as a separate hydration force, but rather as an excluded volume correction to a steric force. Hydration force is typically used to describe forces wherein surface-bound water is removed on compression (i.e., a shrinking head group-excluded volume on compression), giving rise to a characteristic exponential decay length of 0.3–1.0 nm (37). Fitting our data with an additional exponential hydration force (in addition to Eqs. 1 and 2) results in poorer fits than those shown in Fig. 1, regardless of the fitting parameters. However, replacing Eq. 2 (head group overlap) with an exponential force yields acceptable results (Fig. S3). As mentioned above, it does appear that a small amount of bound water is evicted on compression. The true role of water remains a subtle one, but nonetheless seems to be captured in our fitting model.
The acknowledgment of a solvation contribution to measured forces allows for comparison with interfacial solvent properties and in particular, water diffusivity. We see now that the monotonically increasing vesicle surface water diffusivity in going from 0 mol% to 7.5 mol% DMSO, as measured in ref. 20, coincides with a decreased range of repulsive forces and subsequently greater adhesion. DMSO weakens water binding to the head groups, which causes the interfacial water to diffuse faster (more like water diffuses in the bulk) and a shortened range of the repulsive force through a decrease in hydrated excluded volume. Quantitatively establishing a correlation between surface or head group water diffusivity and surface forces would require overcoming the hurdles of rigorous thermodynamic and/or kinetic treatment. Our results reveal the potential for such a correlation, which could be useful in using local water diffusivity as a predictive tool for the stability of colloids and complex fluid systems.
Materials and Methods
Before each SFA experiment, the two mica surfaces were brought into contact in air to calibrate the absolute zero of separation distance. Next, the mica surfaces were coated with the lipid bilayers using Langmuir–Blodgett deposition and transferred under water to the SFA. The bilayers in the SFA experiments were composed of an inner leaflet monolayer of dipalmitoylphosphatidylethanolamine (DPPE, deposited at 28 mN/m surface pressure, 0.42 nm2 per lipid) and an outer leaflet monolayer of DPPC (19 mN/m, 0.52 nm2). The single-bilayer thickness, To, was calculated from SFA measurements of the thickness of two DPPE monolayers in air and two DPPC monolayers in air both at the same surface pressure as the bilayers in the force measurements.
The salt NaDMP was synthesized from trimethylphosphate and sodium iodide as previously reported (40) and confirmed to have ∼96% purity by NMR. NMR diffusion measurements were done using a PFG One-Shot Experiment (Doneshot; Varian), for which a detailed explanation can be found in ref. 41. Hydrodynamic radii were calculated using a modified Stokes–Einstein equation for scenarios when solute size is comparable with solvent size (42). Viscosity measurements were done using a Lovis 2000 M Anton Parr Viscometer with a 1.59-mm (400 µL) glass capillary tube and stainless steel ball. Interfacial tension measurements were made using a Wilhelmy plate. The following materials were purchased from commercial suppliers and used without additional purification: DPPC, DPPE, DMSO, DMSO-d6, D2O, and TMACl.
SI Text
Section S1: Comparison of SFA Do Values with Equilibrium Separations in Multilamellar Vesicles.
By way of the Derjaguin Approximation, W = F/2πR, the separation at which the jump out occurs in SFA measurements, Do, also corresponds to the equilibrium separation between flat plates (Fflats = 0). We can, thus, compare Do values with the values for equilibrium water gap thickness (interbilayer distance) obtained with scattering measurements in the literature (15), shown in Fig. S1.
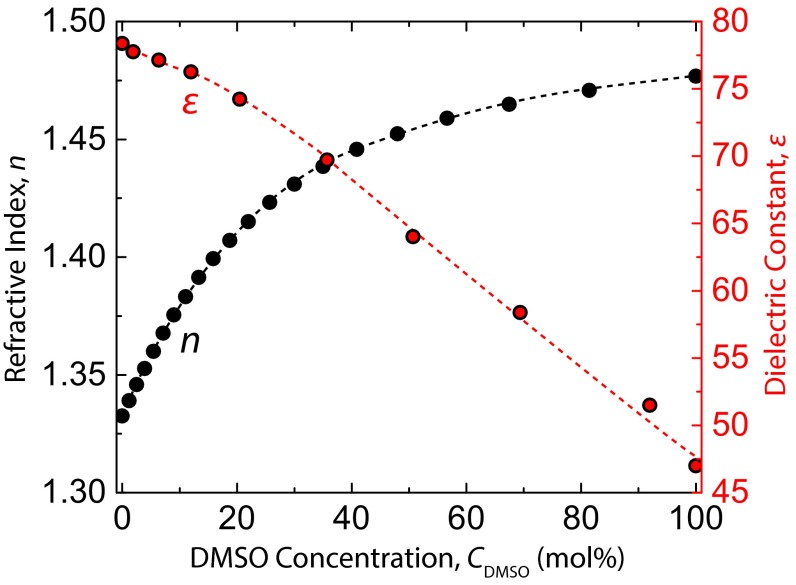
Section S2: Optical Properties of DMSO–Water Mixtures.
The refractive index and dielectric constant of DMSO–water mixtures were used for the calculation of the theoretical Hamaker constant (27). Values from the literature, with DMSO concentrations converted to mole percentage, are plotted in Fig. S2.
Fig. S2.
Plot of refractive index and dielectric constant of DMSO–water mixtures at 25 °C. Data are acquired from refs. 9 and 49.
Section S3: Extended Fitting Parameters for DPPC vs. DPPC SFA Force Measurements.
As an alternative to using the polymer brush (head group overlap) equation to model the repulsive force in our SFA measurements, we also used an exponential repulsion, F/R = Pexp(−D/λ), where P is the prefactor and λ is the decay length. Using an exponential repulsion effectively models the film as polymer mushrooms (27) rather than as a polymer brush. The fitted force curves and fitting parameters are shown in Fig. S3 and Table S1.
One method to optimize fits was to minimize β, the average absolute difference between logarithms of modeled and measured forces:
| [S1] |
where i denotes any discrete data point (corresponding to single D and F values), and n is the total number of data points in the region to be fitted. Using the residual of logarithms (a “log transformation”) is useful when a quasiexponential dependence of F/R on D is observed over multiple orders of magnitude in F/R. In Fig. S3, Upper, β-values for the 0 mol%, 2 mol%, and 7.5 mol% curves were 0.34, 0.39, and 0.15, respectively. Using the polymer brush equation, which was presented in the text, gives corresponding β-values of 0.21, 0.35, and 0.13, respectively. As justified in the text, only forces measured at D > 1.3 nm were used for the calculation of β. By comparing β-values between exponential and brush fits (and by simple inspection), the brush equation seems to fit the data best. Performing this analysis in the attractive regime (except using absolute values for all forces) gives a similar result.
Section S4: Interfacial Tension of the Hydrocarbon/DMSO–Water Interface.
Measurements of the interfacial tension between a hydrocarbon phase and a DMSO-water (aqueous) phase were required to know how the decay length of the exponential protrusion force should scale with DMSO concentration. The decay length of the protrusion force scales with 1/γLL, where γLL is the interfacial tension. The results in Fig. S4 would dictate a longer decay length with increasing DMSO concentration, and therefore, changes in the protrusion force cannot explain the presented trends in the SFA measurements.
Section S5: Discussion of a Depletion Force in the SFA Measurements.
If DMSO was depleted from the interfacial region, one would expect the SFA measurements to show a depletion attraction that increases with bulk DMSO concentration. However, we believe a depletion force is negligible in our results and cannot explain the trends that we observe. The location of the energy minimum, Do, decreases monotonically from 2.2 (in 0% DMSO solution) to 1.2 nm (20 mol% DMSO). If a depletion force is comparable or larger than the other forces acting on surfaces at Do, the value of Do generally remains constant with bulk concentration of the depletant (43). Our measured adhesion forces are well-described with reasonable and theoretically predicted Hamaker constants, indicating that van der Waals forces dominate the attractive interaction. Additionally, our adhesion forces cannot be explained by depletion theory, which dictates that the adhesion force is Fad/R = 2πRgkT, where Rg can be taken as the diameter of a DMSO molecule (0.58 nm), and is the bulk number density of DMSO (1.05 M or 6.32 × 1026 m−3 at 2% DMSO) (27, 38). At 2 mol% DMSO, this calculation gives Fad/R = 95 mN/m, which greatly exceeds the experimental value of 1.1 mN/m. The discrepancy grows at higher DMSO concentrations. Lastly, depletion forces often show a weak repulsion at larger separations than the attraction (43). We do see weak repulsions in our measurements, but they fit well with double-layer theory. Thus, the van der Waals interaction is assumed to be the only attractive force in our fitting.
Section S6: Separations Between Force Curves for DPPC vs. DPPC SFA Force Measurements.
The difference in equilibrium separations, Do, between force curves in 0 mol% and 7.5 mol% DMSO solutions is 0.5 nm, which is indicated in Fig. S5. This difference perhaps indicates that the uncompressed and fully hydrated head groups of a single bilayer extend 0.2–0.3 nm further into solution in 0% solution than they do in 7.5% solution, which is shown to be a hydration-excluded volume effect in the text. Comparing the two force curves at any given compression above 20 mN/m, the difference in separations is 0.2 nm, corresponding to a difference of 0.1 nm per bilayer, and suggesting that ∼1 total layer of bound/hydration water is removed from the interfacial region in 0% DMSO solution on compression to 20 mN/m (∼0.5 layers per bilayer).
Section S7: Viscosity of DMSO-d6–D2O Mixtures.
Viscosity measurements of deuterated DMSO–water mixtures were carried out for use in the Stokes–Einstein equation. A Lovis 2000 M Anton Parr Viscometer was used with a 1.59-mm (400 µL) glass capillary tube and stainless steel ball. Similar viscosity measurements have been made in ref. 44 and are in agreement with our measurements, which are shown in Table S2.
Section S8: Mica–Mica SFA Measurements in DMSO–Water–TMACl Mixtures.
To further gauge the propensity of DMSO as a dehydrating agent and understand its effect on interfacial water, a series of force measurements between mica surfaces in TMA salt solutions was done and is presented in Fig. S6. The ability of the mica–mica experiment to monitor cation hydration through observation of hydration forces is essentially ideal, lacking any thermally fluctuating and protruding groups from the surfaces, with the exception of the ions themselves at D < 0.5 nm. Details of the exact mechanism behind the short-range repulsion between mica surfaces in aqueous electrolyte are debated, but there is agreement on the general origin being dehydration of adsorbed cations (secondary hydration) (45) as well as layering of confined solvent molecules, which is seen between rigid, smooth surfaces (primary hydration) (46). Hydration forces at D < 1.5 nm in Fig. S6 appear to be greatly reduced (in range) in going from 0 mol% to 5 mol% DMSO. The range of the short-range repulsion increases in going from 5% to 10–20% DMSO but always remains weaker than that in 0% DMSO solution.
The long-range forces at D > 2 nm arise from the electric double-layer repulsion, which is quasiexponential with distance. Cations in solution are preferentially distributed near the negatively charged mica surface, and confinement of this ionic atmosphere on compression gives rise to an osmotic repulsion. Methods of fitting the double-layer force are well-understood and described in detail elsewhere (47). Fitting the long-range forces with standard equations for a van der Waals attraction and double-layer repulsion, we see that the surface potential decreases from 110 mV in 0% solution to 85 mV in solutions of 10–20 mol% DMSO, which indicates that more cations adsorb to the mica surfaces in DMSO solutions than in pure water (0.78 TMA ions per 1 nm2 in 0% solution and 0.87 TMA ions per 1 nm2 in 10–20% solution). Following from the mass-action model for ion exchange at the mica surface developed by Pashley (37), at a bulk salt concentration of 20 mM, the most likely explanation for the differences in surface potential is a difference in the hydrated volume of the TMA cation. Smaller hydrated volumes facilitate higher ion packing densities on the mica surface and thus, lower surface potentials, indicating that DMSO dehydrates the TMA cation. Additional experiments would be required to quantify the hydrated volumes of the ions, but this trend in surface potential nonetheless qualitatively agrees with the DMSO-induced ion dehydration behavior presented in the text.
Section S9: DPPC–DPPC SFA Measurements in Water–Glycerol Mixtures.
An SFA measurement between DPPC bilayers was made in a glycerol–water mixture of 5 mol% glycerol (results shown in Fig. S7). Just like DMSO, glycerol is a commonly used cryoprotectant in cellular systems. However, literature scattering measurements have shown that glycerol (up to 20 mol%) increases the equilibrium interbilayer distance in multilamellar systems (48), perhaps indicating that glycerol associates with lipid membranes in a very different way than DMSO. The forces and fitting parameters in Fig. S7 suggest that glycerol may strengthen steric hydration forces between the bilayers, but few conclusions can be made without a full analysis, which was done with DMSO.
Acknowledgments
We thank M. E. Helgeson and J. Kim for assistance in the viscosity measurements. This work was supported by Materials Research Science and Engineering Centers (MRSEC) Program of the National Science Foundation Award DMR 1121053.
Footnotes
The authors declare no conflict of interest.
This article contains supporting information online at www.pnas.org/lookup/suppl/doi:10.1073/pnas.1512325112/-/DCSupplemental.
References
- 1.Lovelock JE, Bishop MWH. Prevention of freezing damage to living cells by dimethyl sulphoxide. Nature. 1959;183(4672):1394–1395. doi: 10.1038/1831394a0. [DOI] [PubMed] [Google Scholar]
- 2.Anchordoguy TJ, Carpenter JF, Crowe JH, Crowe LM. Temperature-dependent perturbation of phospholipid bilayers by dimethylsulfoxide. Biochim Biophys Acta. 1992;1104(1):117–122. doi: 10.1016/0005-2736(92)90139-d. [DOI] [PubMed] [Google Scholar]
- 3.Ahkong QF, Fisher D, Tampion W, Lucy JA. Mechanisms of cell fusion. Nature. 1975;253(5488):194–195. doi: 10.1038/253194a0. [DOI] [PubMed] [Google Scholar]
- 4.Lyman GH, Preisler HD, Papahadjopoulos D. Membrane action of DMSO and other chemical inducers of Friend leukaemic cell differentiation. Nature. 1976;262(5567):361–363. doi: 10.1038/262360a0. [DOI] [PubMed] [Google Scholar]
- 5.Shi R, Qiao X, Emerson N, Malcom A. Dimethylsulfoxide enhances CNS neuronal plasma membrane resealing after injury in low temperature or low calcium. J Neurocytol. 2001;30(9-10):829–839. doi: 10.1023/a:1019645505848. [DOI] [PubMed] [Google Scholar]
- 6.Lu Z, Manias E, Macdonald DD, Lanagan M. Dielectric relaxation in dimethyl sulfoxide/water mixtures studied by microwave dielectric relaxation spectroscopy. J Phys Chem A. 2009;113(44):12207–12214. doi: 10.1021/jp9059246. [DOI] [PubMed] [Google Scholar]
- 7.Luzar A, Chandler D. Structure and hydrogen bond dynamics of water–dimethyl sulfoxide mixtures by computer simulations. J Chem Phys. 1993;98(10):8160–8173. [Google Scholar]
- 8.Baker ES, Jonas J. Transport and relaxation properties of dimethyl sulfoxide-water mixtures at high pressure. J Phys Chem. 1985;89(9):1730–1735. [Google Scholar]
- 9.LeBel RG, Goring DAI. Density, viscosity, refractive index, and hygroscopicity of mixtures of water and dimethyl sulfoxide. J Chem Eng Data. 1962;7(1):100–101. [Google Scholar]
- 10.Havemeyer RN. Freezing point curve of dimethyl sulfoxide--water solutions. J Pharm Sci. 1966;55(8):851–853. doi: 10.1002/jps.2600550822. [DOI] [PubMed] [Google Scholar]
- 11.Fox MF, Whittingham KP. Component interactions in aqueous dimethyl sulphoxide. J Chem Soc Faraday Trans 1. 1975;71:1407–1412. [Google Scholar]
- 12.Shashkov SN, Kiselev MA, Tioutiounnikov SN, Kiselev AM, Lesieur P. The study of DMSO/water and DPPC/DMSO/water system by means of the X-ray, neutron small-angle scattering, calorimetry and IR spectroscopy. Physica B Condens Matter. 1999;271(1-4):184–191. [Google Scholar]
- 13.Yu ZW, Quinn PJ. Phase stability of phosphatidylcholines in dimethylsulfoxide solutions. Biophys J. 1995;69(4):1456–1463. doi: 10.1016/S0006-3495(95)80015-9. [DOI] [PMC free article] [PubMed] [Google Scholar]
- 14.Tristram-Nagle S, Moore T, Petrache HI, Nagle JF. DMSO produces a new subgel phase in DPPC: DSC and X-ray diffraction study. Biochim Biophys Acta. 1998;1369(1):19–33. doi: 10.1016/s0005-2736(97)00197-1. [DOI] [PubMed] [Google Scholar]
- 15.Gorshkova JE, Gordeliy VI. Investigation of the interaction of dimethyl sulfoxide with lipid membranes by small-angle neutron scattering. Crystallography Reports. 2007;52(3):535–539. [Google Scholar]
- 16.Kiselev MA, Lesieur P, Kisselev AM, Grabielle-Madelmond C, Ollivon M. DMSO-induced dehydration of DPPC membranes studied by X-ray diffraction, small-angle neutron scattering, and calorimetry. J Alloys Compd. 1999;286(1-2):195–202. [Google Scholar]
- 17.Gordeliy VI, Kiselev MA, Lesieur P, Pole AV, Teixeira J. Lipid membrane structure and interactions in dimethyl sulfoxide/water mixtures. Biophys J. 1998;75(5):2343–2351. doi: 10.1016/S0006-3495(98)77678-7. [DOI] [PMC free article] [PubMed] [Google Scholar]
- 18.Chang HH, Dea PK. Insights into the dynamics of DMSO in phosphatidylcholine bilayers. Biophys Chem. 2001;94(1-2):33–40. doi: 10.1016/s0301-4622(01)00206-x. [DOI] [PubMed] [Google Scholar]
- 19.Franck JM, Pavlova A, Scott JA, Han S. Quantitative cw Overhauser effect dynamic nuclear polarization for the analysis of local water dynamics. Prog Nucl Magn Reson Spectrosc. 2013;74:33–56. doi: 10.1016/j.pnmrs.2013.06.001. [DOI] [PMC free article] [PubMed] [Google Scholar]
- 20.Cheng C, Song J, Pas J, Meijer L, Han S. DMSO induces dehydration near lipid membrane surfaces. Biophys J. 2015;109(2):330–339. doi: 10.1016/j.bpj.2015.06.011. [DOI] [PMC free article] [PubMed] [Google Scholar]
- 21.Donaldson SH, Jr, et al. Developing a general interaction potential for hydrophobic and hydrophilic interactions. Langmuir. 2015;31(7):2051–2064. doi: 10.1021/la502115g. [DOI] [PubMed] [Google Scholar]
- 22.McIntosh TJ, Simon SA. Contributions of hydration and steric (entropic) pressures to the interactions between phosphatidylcholine bilayers: Experiments with the subgel phase. Biochemistry. 1993;32(32):8374–8384. doi: 10.1021/bi00083a042. [DOI] [PubMed] [Google Scholar]
- 23.Israelachvili JN, Wennerström H. Hydration or steric forces between amphiphilic surfaces? Langmuir. 1990;6(16):873–876. [Google Scholar]
- 24.LeNeveu DM, Rand RP. Measurement and modification of forces between lecithin bilayers. Biophys J. 1977;18(2):209–230. doi: 10.1016/S0006-3495(77)85608-7. [DOI] [PMC free article] [PubMed] [Google Scholar]
- 25.Israelachvili JN, Wennerström H. Entropic forces between amphiphilic surfaces in liquids. J Phys Chem. 1992;96(2):520–531. [Google Scholar]
- 26.Israelachvili J, et al. Recent advances in the surface forces apparatus (SFA) technique. Rep Prog Phys. 2010;73(3):1–16. [Google Scholar]
- 27.Israelachvili JN. Intermolecular and Surface Forces. 3rd Ed Elsevier; San Diego: 2011. [Google Scholar]
- 28.Marra J, Israelachvili J. Direct measurements of forces between phosphatidylcholine and phosphatidylethanolamine bilayers in aqueous electrolyte solutions. Biochemistry. 1985;24(17):4608–4618. doi: 10.1021/bi00338a020. [DOI] [PubMed] [Google Scholar]
- 29.Pincet F, Perez E, Wolfe J. Do trehalose and dimethyl sulfoxide affect intermembrane forces? Cryobiology. 1994;31(6):531–539. doi: 10.1006/cryo.1994.1064. [DOI] [PubMed] [Google Scholar]
- 30.Kuhl TL, Leckband DE, Lasic DD, Israelachvili JN. Modulation of interaction forces between bilayers exposing short-chained ethylene oxide headgroups. Biophys J. 1994;66(5):1479–1488. doi: 10.1016/S0006-3495(94)80938-5. [DOI] [PMC free article] [PubMed] [Google Scholar]
- 31.Pincet F, Cribier S, Perez E. Bilayers of neutral lipids bear a small but significant charge. Eur Phys J B. 1999;11(1):127–130. [Google Scholar]
- 32.Hemmerle A, et al. Controlling interactions in supported bilayers from weak electrostatic repulsion to high osmotic pressure. Proc Natl Acad Sci USA. 2012;109(49):19938–19942. doi: 10.1073/pnas.1211669109. [DOI] [PMC free article] [PubMed] [Google Scholar]
- 33.Claesson PM, Kjellander R, Stenius P, Christenson HK. Direct measurement of temperature-dependent interactions between non-ionic surfactant layers. J Chem Soc Faraday Trans 1. 1986;82(9):2735–2746. [Google Scholar]
- 34.De L, Costello BA, Luckham PF, Tadros ThF. Forces between adsorbed low molecular weight graft copolymers. J Colloid Interface Sci. 1993;156(1):72–77. [Google Scholar]
- 35.McIntosh TJ, Simon SA. Hydration force and bilayer deformation: A reevaluation. Biochemistry. 1986;25(14):4058–4066. doi: 10.1021/bi00362a011. [DOI] [PubMed] [Google Scholar]
- 36.Stejskal EO, Tanner JE. Spin diffusion measurements: Spin echoes in the presence of a time-dependent field gradient. J Chem Phys. 1965;42(1):288–292. [Google Scholar]
- 37.Pashley RM. DLVO and hydration forces between mica surfaces in Li+, Na+, K+, and Cs+ electrolyte solutions: A correlation of double-layer and hydration forces with surface cation exchange properties. J Colloid Interface Sci. 1981;83(2):531–546. [Google Scholar]
- 38.Pacak P. Polarizability and molecular radius of dimethyl sulfoxide and dimethylformamide from refractive index data. J Solution Chem. 1987;16(1):71–77. [Google Scholar]
- 39.Schneck E, Sedlmeier F, Netz RR. Hydration repulsion between biomembranes results from an interplay of dehydration and depolarization. Proc Natl Acad Sci USA. 2012;109(36):14405–14409. doi: 10.1073/pnas.1205811109. [DOI] [PMC free article] [PubMed] [Google Scholar]
- 40.Bunton CA, Mhala MM, Oldham KG, Vernon CA. The reactions of organic phosphates. Part III. The hydrolysis of dimethyl phosphate. J Chem Soc. 1960;0:3293–3301. [Google Scholar]
- 41.Pelta MD, Morris GA, Stchedroff MJ, Hammond SJ. A one-shot sequence for high-resolution diffusion-ordered spectroscopy. Magn Reson Chem. 2002;40(13):S147–S152. [Google Scholar]
- 42.Chen HC, Chen SH. Diffusion of crown ethers in alcohols. J Phys Chem. 1984;88(21):5118–5121. [Google Scholar]
- 43.Kuhl T, et al. Direct measurement of polyethylene glycol induced depletion attraction between lipid bilayers. Langmuir. 1996;12(12):3003–3014. [Google Scholar]
- 44.Sacco A, Matteoli E. Isotopic substitution effects on the volumetric and viscosimetric properties of water-dimethylsulfoxide mixtures at 25° C. J Solution Chem. 1997;26(5):527–535. [Google Scholar]
- 45.Pashley RM. Hydration forces between mica surfaces in aqueous electrolyte solutions. J Colloid Interface Sci. 1981;80(1):153–162. [Google Scholar]
- 46.Pashley RM, Israelachvili JN. Molecular layering of water in thin films between mica surfaces and its relation to hydration forces. J Colloid Interface Sci. 1984;101(2):511–523. [Google Scholar]
- 47.Parsegian VA, Gingell D. On the electrostatic interaction across a salt solution between two bodies bearing unequal charges. Biophys J. 1972;12(9):1192–1204. doi: 10.1016/S0006-3495(72)86155-1. [DOI] [PMC free article] [PubMed] [Google Scholar]
- 48.McDaniel RV, McIntosh TJ, Simon SA. Nonelectrolyte substitution for water in phosphatidylcholine bilayers. Biochim Biophys Acta. 1983;731(1):97–108. [Google Scholar]
- 49.Kaatze U, Pottel R, Schäfer M. Dielectric spectrum of dimethyl sulfoxide/water mixtures as a function of composition. J Phys Chem. 1989;93(14):5623–5627. [Google Scholar]
- 50.Catalán J, Díaz C, García-Blanco F. Characterization of binary solvent mixtures of DMSO with water and other cosolvents. J Org Chem. 2001;66(17):5846–5852. doi: 10.1021/jo010415i. [DOI] [PubMed] [Google Scholar]


