Significance
Wealthy individuals play an important role in charitable giving. We present evidence that millionaires give more than any other group studied in the literature. This holds particularly in a clear giving situation. In our study, millionaires either participated in a dictator game or an ultimatum game and they either interacted with another millionaire or with a low-income individual. In the dictator game, the millionaire decides how to split an amount between herself and a recipient who has no power. In the ultimatum game, the receiver needs to approve the proposer’s proposal; otherwise, both players are paid zero. Millionaires give more to a low-income participant in the dictator game than in the more strategic ultimatum game.
Keywords: philanthropy, donations, experimental economics, dictator game, ultimatum game
Abstract
This paper studies conditions influencing the generosity of wealthy people. We conduct incentivized experiments with individuals who have at least €1 million in their bank account. The results show that millionaires are more generous toward low-income individuals in a giving situation when the other participant has no power, than in a strategic setting, where the other participant can punish unfair behavior. Moreover, the level of giving by millionaires is higher than in any other previous study. Our findings have important implications for charities and financial institutions that deal with wealthy individuals.
Why are we sometimes very generous and sometimes rather parsimonious? For example, we almost always tip in a restaurant, only sometimes in coffee places, such as Starbucks, but almost never in fast-food chains, such as McDonald’s. The difference in our tipping behavior implies that generosity depends on the context. We thus need to understand the context effects and some general rules concerning possible influencing factors of our perception of generosity and our subsequent behavior in markets.
In this paper, we worked with a large Dutch bank to expand the study of generosity to people who have more than €1 million in their bank accounts (from here on, we call this group of participants “millionaires”). Because a large fraction of charity donations stems from millionaires, understanding what motivates them to donate is important. For example, in The Netherlands, where the current experiment was conducted, 80% of donations are being made by the richest 20% of donators (1).
An obvious problem with studying such behavior in a regular experimental laboratory with students is the degree to which students, who are rich only in relative and not absolute terms and who have limited experience with giving, represent real wealthy individuals (2). One major contribution of our study is that, to our knowledge, we are the first to investigate social preferences in a controlled incentivized experiment with a sample of objectively wealthy people.
Our results show that the financial position of individuals outside of the experiment plays a fundamental role in their decisions within the experiment. The first experiment we focus on is the “dictator game” (3, 4). Each millionaire is asked to propose how to allocate €100 between herself and a recipient. This proposal is then implemented with some probability. In one treatment we inform the proposer that the recipient is another millionaire, whereas in a different treatment we inform the millionaire that the recipient is a low-income individual.
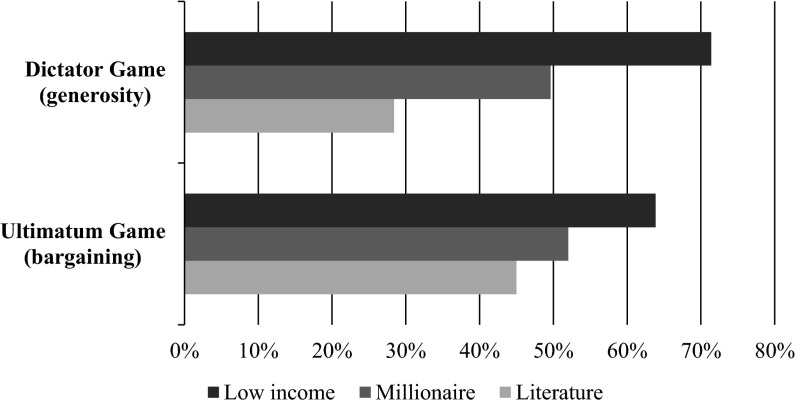
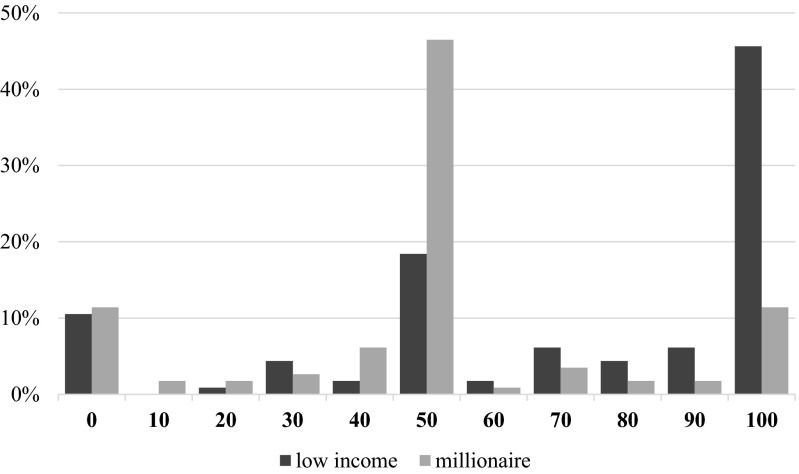
The upper part of Fig. 1 shows the average amount allocated by millionaires in the dictator game for these two scenarios. In addition, we show the average amount that is given in dictator game experiments based on a recent meta-analysis (5). Whereas the millionaires allocated €49.61 on average to other millionaires, they gave €71.40 when matched to low-income individuals (Mann–Whitney, P < 0.001, Kolmogorov–Smirnov test, P < 0.001). Hence, millionaires were significantly more generous toward low-income participants than to other millionaires (Fig. S1). This result indicates that giving in a dictator game is highly dependent upon the financial position of recipients (see also refs. 6 and 7).
Fig. 1.
Giving of millionaires compared with previous studies. It was randomly determined whether a millionaire acted as an allocator in the dictator game or as a proposer in the ultimatum game. In both games, the millionaire was endowed with €100 and was asked how to split this money between herself and another participant. It was randomly determined whether the recipient was another millionaire or a low-income individual and the millionaire was informed about this characteristic of the recipient. One in 10 pairs of participants was selected for payment of the earnings in the experiment. The graph shows the average giving of millionaires when matched to a low-income individual and when matched to a millionaire. The graph also depicts the average amount given in previous studies with the dictator game (5) and in previous studies with the ultimatum game (17).
Fig. S1.
Giving behavior of millionaires toward low-income individuals and millionaires in the dictator game. It was randomly determined whether a millionaire acted as an allocator in the dictator game (generosity) or as a proposer in the ultimatum game (bargaining). In both games, the millionaire was endowed with €100 and asked how to split this money between herself and another participant. It was randomly determined whether the recipient was another millionaire or a low-income individual and the millionaire was informed about this characteristic of the recipient. One in 10 pairs of participants was selected for payment of the earnings in the experiment. This figure shows the full distribution of the amount given by millionaires in the dictator game for those matched to a low-income individual and those matched to another millionaire.
Result 1: In the Dictator Game, Millionaires Give a Higher Amount to Low-Income Participants than to Other Millionaires
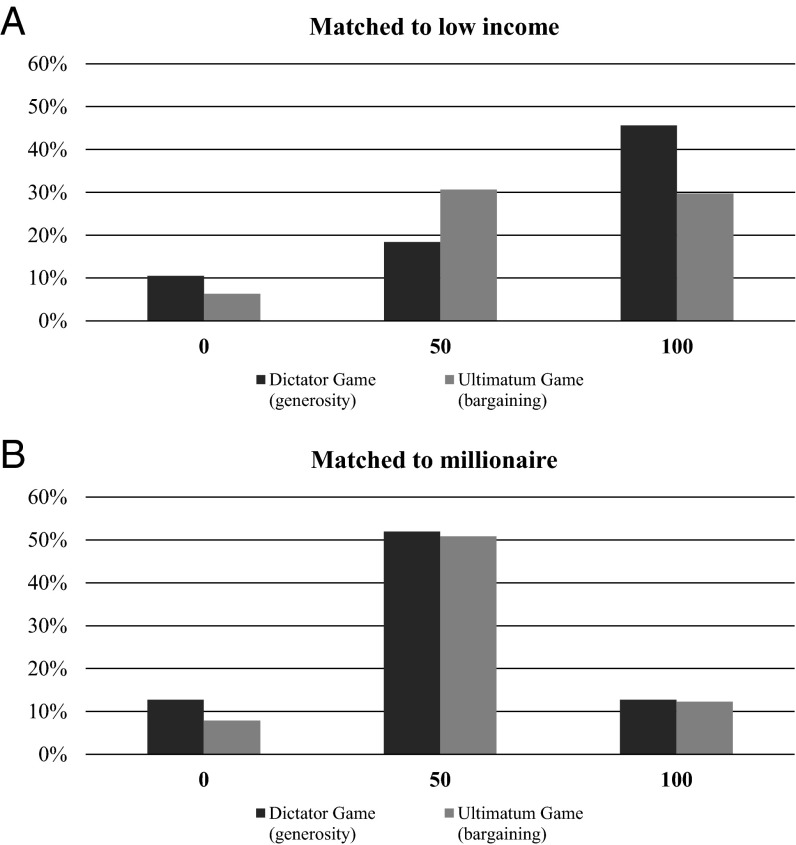
Interestingly, the level of giving by the millionaires is much higher than in any other experiment we are aware of in the literature. When matched with low-income recipients, the millionaires in our dictator game gave on average 71.4% of the money, with 45.6% giving the entire €100 to the recipient. In comparison, in a meta-analysis conducted with more than 100 dictator game experiments, proposers gave away on average 28.4%, whereas only 5.4% of dictators gave the full amount to the other participant (5). As Fig. 2A shows, 45.6% of the millionaires in our study gave away everything when matched to low-income participants; we are not aware of such a result in the literature.
Fig. 2.
Giving by millionaires in a giving situation compared with a bargaining situation. It was randomly determined whether a millionaire acted as an allocator in the dictator game (generosity) or as a proposer in the ultimatum game (bargaining). In both games, the millionaire was endowed with €100 and asked how to split this money between herself and another participant. It was randomly determined whether the recipient was another millionaire or a low-income individual and the millionaire was informed about this characteristic of the recipient. One in 10 pairs of participants was selected for payment of the earnings in the experiment. (A) The distribution of the amount given in both games when matched to a low-income individual. (B) The distribution of the amount given by millionaires in the dictator and ultimatum game when matched to another millionaire. For expositional reasons, we only display the most frequently given amounts: €0, €50, and €100. Figs. S2 and S3 show the full distributions.
Result 2: In the Dictator Game, Millionaires Who Are Matched to a Low-Income Participant Give Away More than in any Other Example in the Literature
The second element of our paper relates to strategic behavior. We compare the behavior of millionaires in the dictator game to that in the ultimatum game. In the ultimatum (8) game, the receiver needs to approve the proposer’s proposal; otherwise, both players are paid zero. Although this difference may seem small, it has a big effect on the framing of interactions. In the dictator game, the proposer is acting out of generosity, with a given set of norms that go along with such behavior. In contrast, the proposer’s decision in the ultimatum game has a strategic element: the need for the receiver to accept the proposal.
This strategic element changes the nature of the interaction; whereas in the dictator game the interaction could be classified as “communal,” in the ultimatum game it is classified as “exchange” (9). The literature has shown that this difference in framing results in strong behavioral differences (10–14).
Two forces are working in opposite directions when moving from the dictator to the ultimatum game. The first we call the “exchange force,” which makes proposers less generous, because it puts them in an exchange mode. The second, which we call the “strategic force,” is a result of the risk of making low offers, because the receiver could reject them. This strategic force makes proposing low amounts risky and thus forces the proposer to increase the proposed amount.
Similar to the results of the dictator game, the lower part of Fig. 1 reports the average proposals of millionaires in the ultimatum game. In line with what we find in the dictator game, millionaires propose a larger piece of the pie to the responder than the average offer in the literature (17), and they propose more to a low-income individual than to another millionaire.
Moreover, in the literature, proposals in ultimatum games are larger than those in dictator games (5, 15–17). This difference indicates that the strategic force in the ultimatum game outweighs the exchange force. In contrast to the literature, as Fig. 1 shows, in our experiment proposals to low-income participants are higher in the dictator game (71.4% of the pie) than in the ultimatum game (63.9%; Mann–Whitney, P = 0.035, Kolmogorov–Smirnov test, P = 0.044). Thus, the exchange force outweighs the strategic force in a setting with large differences in wealth among participants.
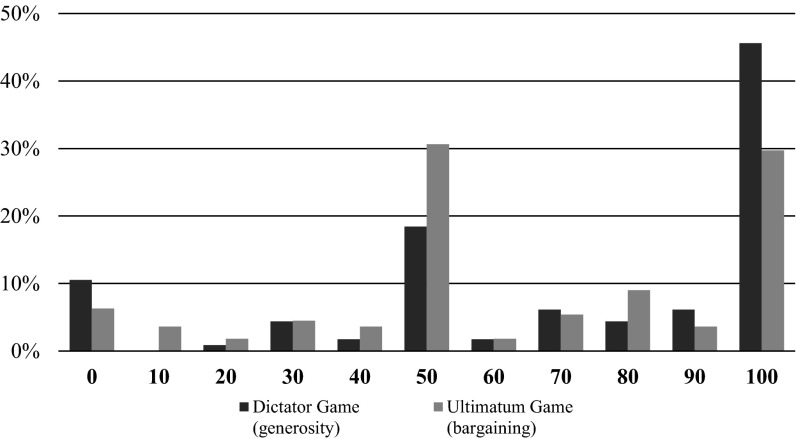
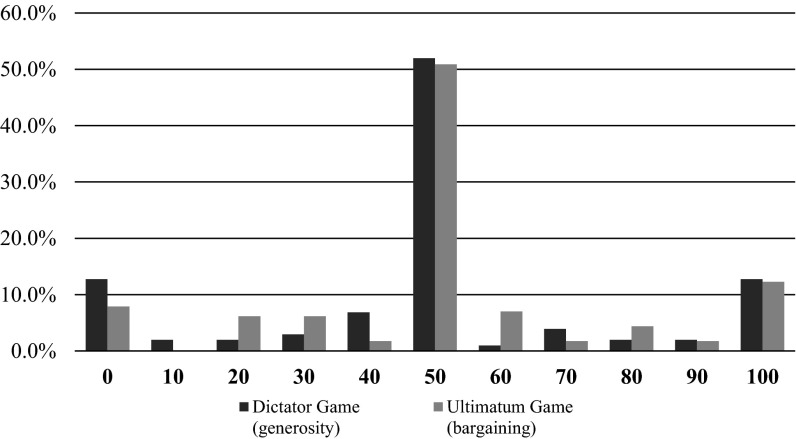
The fact that we observe a strong shift from choosing a 50–50 split in the ultimatum game to choosing a 0–100 split in the dictator game further supports our findings (Fig. 2A). In the ultimatum game, 30.6% of the millionaires chose a 50–50 split, whereas only 29.7% gave away the full amount. In the dictator game, the 50–50 split was chosen by only 18.4% (χ2 test, P = 0.033), whereas a significantly higher share of 45.6% of the millionaires, chose to give away the entire €100 (χ2 test, P = 0.014). See Figs. S2 and S3 for the full distributions. Millionaires give the same in the dictator and ultimatum game when matched to another millionaire (Fig. S3).
Fig. S2.
Full distribution of amounts given by millionaires when matched to a low-income recipient. It was randomly determined whether a millionaire acted as an allocator in the dictator game (generosity) or as a proposer in the ultimatum game (bargaining). In both games, the millionaire was endowed with €100 and asked how to split this money between herself and another participant. It was randomly determined whether the recipient was another millionaire or a low-income individual and the millionaire was informed about this characteristic of the recipient. One in 10 pairs of participants was selected for payment of the earnings in the experiment. This figure shows the full distribution of the amount given by millionaires in both games when matched to a low-income individual.
Fig. S3.
Full distribution of amounts given by millionaires when matched to another millionaire. It was randomly determined whether a millionaire acted as an allocator in the dictator game (generosity) or as a proposer in the ultimatum game (bargaining). In both games, the millionaire was endowed with €100 and asked how to split this money between herself and another participant. It was randomly determined whether the recipient was another millionaire or a low-income individual and the millionaire was informed about this characteristic of the recipient. One in 10 pairs of participants was selected for payment of the earnings in the experiment. This figure shows the full distribution of the amount given by millionaires in both games when matched to another millionaire.
These findings indicate that wealthy individuals are most generous when matched to a low-income person in a clear giving situation. In a strategic environment, wealthy individuals give relatively less to a low-income individual.
Result 3: Millionaires Are More Generous Toward Low-Income Participants in the Dictator Game than in the Ultimatum Game
These results suggest that millionaires are less generous when they are in the “exchange mode” compared with when they are in the “communal mode.” However, there could be factors driving this difference other than the change in modes. A potential explanation is that millionaires give less in the ultimatum game than in the dictator game because it could be “face threatening” (7) for a millionaire to have an offer rejected by a low-income person. Relatedly, a millionaire could think that a low-income responder might reject a too-high offer, because the person perceives the millionaire to pity him or her.
To investigate these explanations, we used an open questionnaire that millionaires were asked to answer after the experiment, in which we asked them to indicate the reason for their decision. Only 1 of 106 millionaire proposers who were matched to a low-income individual in the ultimatum game indicated that he or she did not want to appear as if he or she pitied the low-income individual. Only six participants indicated a concern that the low-income individual would accept the offer. None of the millionaires indicated that they would feel ashamed if their offer was rejected. Taking these data together, we find no evidence that millionaires give less in the ultimatum game because it could be “face threatening” to them to have an offer rejected by a low-income person. Nor do we find evidence that millionaires give less in the ultimatum game because they felt pity for low-income individuals.
If the dictator game puts millionaires more in a “communal mode” relative to the ultimatum game, we expect answers that are more related to giving in the dictator game than in the ultimatum game. To test this theory we asked two independent research assistants, who were blind to the hypothesis, to code the responses to the open question on the extent to which the answer is related to giving. An answer was rated as a “3” if the motivation of the millionaire was clearly related to giving, as a “2” if it was somehow related to giving, and as a “1” if it was not related to giving. For the dictator game, the correlation between the assigned codes of the two research assistants is 0.76, with a Cronbach’s α of 0.87. For the ultimatum game, the correlation is 0.79 with a Cronbach’s α of 0.88.
The dictator game answers are rated as related to giving with 2.24 compared with 1.79 for the ultimatum game. The difference between these two scores is statistically significant (two-sided t test, P < 0.001). This evidence supports the hypotheses that millionaires are more in a “communal mode” in the dictator game than in the ultimatum game.
Discussion
Our findings have implications for organizations interested in raising money for charity from wealthy individuals. In particular, wealthy people may be more generous in donating to charity if they expect no direct benefits. Once a strategic element is added to the environment—for example, a minimum required donation amount—they might become less generous.
Another promising implication relates to the return on investment for microfinance investments or socially responsible mutual funds. Our results suggest that framing microfinance investments as charity (giving environment) with a chance to get some money back, rather than framing microfinance as an investment product (strategic environment), could be more effective. In this light, it has been shown that socially responsible investments without tax benefits attract more prosocial investors than socially responsible funds with tax benefits (18). Future research can test how the framing of such microfinance and socially responsible investment products affects their attractiveness to investors.
More broadly, our results show that the behavior of wealthy individuals is substantially different from that of other groups, like students and members from representative survey panels. Because wealthy individuals can have a large influence on economic outcomes, it is worth studying their behavior in other contexts. Laboratory experiments with students have studied how being “rich” influences giving by, for example, looking at social class differences within a student sample (19, 20). These experiments found that in a dictator game “upper-class” individuals give less than “lower-class” individuals (19). The authors define social class using income, education, and job prestige. Moreover, students with lower income in an experiment redistribute more than students with a higher income (21).
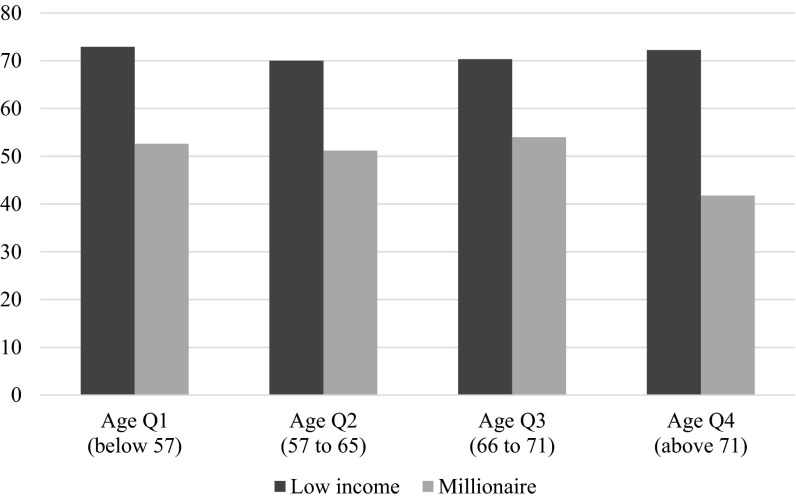
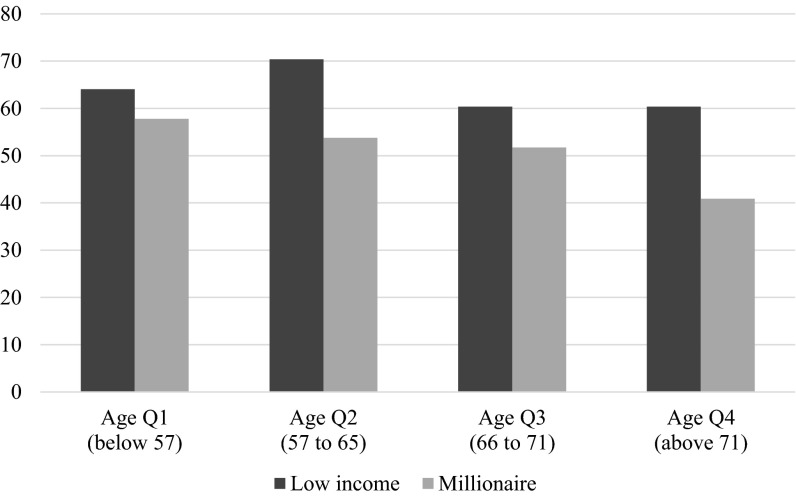
Given that most millionaires are relatively old, we cannot rule out that age effects explain the high level of giving by millionaires. For example, older people tend to give more in dictator games (5) and to be more trustworthy in trust games compared with younger people (22, 23). We explore the relation between age and the amount given in the dictator game in our sample, and find no statistically significant relation (Fig. S4). Similarly, we find no significant relation between age and the amount offered to a low-income responder in the ultimatum game (Fig. S5). This finding suggests that, at least within the sample of millionaires, old people give as much as younger people. However, the average age of millionaires in our sample is 64.2 y and the SD is 10.7, which is drastically older than in most studies in the literature.
Fig. S4.
Age differences in giving in the dictator game. This figure shows the average amounts given by millionaires in the dictator game when matched to a low-income participant or millionaire, respectively. The sample is split into quartiles based on the age of the millionaire. The P values below the graph correspond to two-tailed t tests for differences between the age quartiles.
| P values | Low income | Millionaire |
| Age Q2–Q1 | 0.7907 | 0.8490 |
| Age Q3–Q2 | 0.9743 | 0.7081 |
| Age Q4–Q3 | 0.8090 | 0.1326 |
| Age Q4–Q1 | 0.9357 | 0.1869 |
Fig. S5.
Age differences in giving in the ultimatum game. This figure shows the average amounts given by millionaires in the ultimatum game when matched to a low-income participant or millionaire respectively. The sample is split into quartiles based on the age of the millionaire. The P values below the graph correspond to two-tailed t tests for differences between the age quartiles.
| P values | Low income | Millionaire |
| Age Q2–Q1 | 0.3567 | 0.5330 |
| Age Q3–Q2 | 0.2603 | 0.8035 |
| Age Q4–Q3 | 1.0000 | 0.1315 |
| Age Q4–Q1 | 0.6539 | 0.0041 |
The stakes in our experiment are relatively small, given the wealth of millionaires, and behavior in ultimatum games may depend on the size of the stakes (24). However, we observe that the action of millionaires in the dictator game significantly differs from behavior in the ultimatum game when matched to a participant with a low income, even when stakes are relatively small. A significant number of millionaires propose a 50–50 split in the ultimatum game, even when matched to a low-income participant, whereas many millionaires give everything to a low-income individual in the dictator game.
Combined, our results suggest two key findings. First, when studying generosity, we should be careful when extrapolating from student populations to the behavior of real millionaires. Second, when millionaires are in a “communal” interaction, they appear to be more generous than when strategic elements are added. These findings also have implications for other settings. For example, forcing others to give can reduce the level of generosity (14). Monitoring millionaires might be even more harmful than monitoring students.
Methods
Participants.
This study was approved by the School of Business and Economics of Maastricht University and by the bank ABN AMRO MeesPierson. All participants provided informed consent.
The participants in our experiment are clients of a large Dutch private bank where they have private banking accounts. Individuals must have a net worth of at least €1 million of liquid wealth (not in real estate) at the moment they opened an account.
Table 1 presents the summary statistics for our sample of millionaires, showing that 77.3% are men, the average age is 64.2 y, they have 2.04 children on average, and 69.1% are married. Millionaires are well educated, with 60.5% of them holding a university degree. Table 1 also provides information on the wealth distribution of the millionaires in our sample: 39.0% reported wealth between €1 million and €2 million; 26.3%, €3 million to €5 million; and 14.3%, more than €5 million. At the time of the experiment, 7.8% of the sample had less than €1 million of wealth. A likely explanation is that they had €1 million when they opened their accounts, and by the time they participated in our experiment, they had consumed or lost part of their wealth. At the time of the experiment, 27.9% of the millionaires had an annual income between €50,000 and €99,000, more than 40% had an annual income of more than €100,000, and 2.6% had an income below €20,000. The explanation for this relatively low average income is that many of the millionaires are retired (52.1%). Some millionaires got rich by owning their own companies (47.6%), followed by an inheritance (33.6%) and salary (32.4%). These numbers do not add up to 100% because respondents could select multiple answers.
Table 1.
Characteristics of millionaires in our sample
| Characteristics | Mean |
| Observations | 633 |
| Male | 77.3% |
| Age | 64.2 |
| Retired | 52.1% |
| University degree | 60.5% |
| Married | 69.1% |
| No. of children | 2.04 |
| Wealth (€) | |
| Less than 1 million | 7.8% |
| 1–2 million | 39.0% |
| 3–5 million | 26.3% |
| 6–10 million | 10.0% |
| More than 10 million | 4.3% |
| Do not want to tell | 12.6% |
| Income (€) | |
| Less than 20k | 2.6% |
| 20–49k | 11.5% |
| 50–99k | 27.9% |
| 100–149k | 19.6% |
| 150–500k | 21.5% |
| More than 500k | 2.8% |
| Do not want to tell | 14.2% |
| Source of wealth | |
| Own company | 47.6% |
| Inheritance | 33.6% |
| Salary | 32.4% |
| Gift from parents | 15.9% |
| Patent/invention | 0.8% |
| Lottery winnings | 0.1% |
| Other | 9.7% |
| Do not want to tell | 7.6% |
Individuals from a representative panel of low-income individuals in The Netherlands were the second type of participants in the experiment. Flycatcher, a certified online research panel, administers this group. The panel members are regularly asked for their gross annual household income. Participants in our “low-income” group had a yearly income below €12,500. We invited all 1,360 individuals on the Flycatcher panel who had stated having a low income in the previous round of the panel survey. Of those, 584 (42.9%) individuals participated.
Procedure.
The bank sent out an email that contained a link to an online survey. The first block of questions targeted demographic characteristics, such as sex, age, number of children, and marital status. Then, the participants took part in the experiments (dictator and ultimatum game) followed by an open question on the motivation for the decisions in the experiments. The final part of the survey consisted of a set of questions related to giving and investments. During or after answering these questions, it was not possible to return to the experiments.
Participants were informed that payments as a result of their individual choices in the experiment would be randomly determined at the end of the survey (with a pay-out probability of 10%). The participants that were selected for payment received their earnings via bank transfer at the moment the data collection was completed. The authors’ university and the bank guaranteed the payments to survey participants.
We invited 5,000 millionaires, of which 328 had no valid email address, giving us a total of 4,672 usable email addresses. Eventually, 633 (13.5%) millionaires completed the experiment.
The millionaires who agreed to participate in our experiment were randomly assigned to participate in a dictator game or in an ultimatum game, and were assigned to a certain role. This assignment method resulted in 216 (33.5%) millionaires allotted to the role of an allocator in the dictator game, 225 (34.9%) to the role of a proposer in the ultimatum game, and 203 (31.5%) to the role of a responder in the ultimatum game.
In the ultimatum game (see refs. 17, 24, and 25 for a recent survey) the proposer received €100 and was asked to allocate the amount between herself and the responder in increments of €10, including €0 and €100. The responder could then either accept or reject the proposer’s offer. If the responder accepted the split, it was implemented; otherwise, both players received €0. In our experiment, responders made their choices via the strategy method. The responder indicated a willingness to either accept or reject the offer for each of the 11 amounts the proposer could propose: from €0 to €100.
In the dictator game, the proposer was asked to make a unilateral decision on how to divide €100. The other player (the recipient) had no decision to make.
We used a between-participants design in which each participant played one role in one game; that is, one role in either the dictator or the ultimatum game. Participants were informed that they would only make one decision and that all participants of the experiment would remain anonymous during and after the experiment. See Supporting Information for the full set of instructions and Datasets S1 and S2 for specific data regarding the questions and responses in the experiments.
Experimental Instructions
Dictator Game: Allocator.
The experiment is fully covered on this page.
Your decision.
You are randomly matched to another participant. The person to whom you are matched has (less than €12,500 gross income per year/more than €1 million in the bank account). You and the person to whom you are matched can earn real money in the experiment. You receive €100. The person to whom you are matched initially receives nothing. You are asked to send an amount to the other person between €0 and €100. The other person is told that you received €100, the choice you had, and the decision you made. He or she does not make any decision.
Earnings in the experiment.
The earnings of the other participant are the amount you send to the person. Your earnings are the remainder of the amount, so €100 minus the amount you send to the other person. Select one of the following amounts that you want to send to the other person:
€0
€10
€20
€30
€40
€50
€60
€70
€80
€90
€100
Payment.
At the end, the computer will decide randomly whether you and the person to whom you are matched get paid. The chance is at least 10%. If you are selected for payment, the person to whom you are matched gets paid too. You remain anonymous, also to the other participant. Moreover, the outcomes will be analyzed anonymously. ABN AMRO MeesPierson and Maastricht University guarantee that payments will be correct and as described in the instructions. At the end, you can provide details on your bank account to where we will transfer the money.
Ultimatum Game: Proposer.
The experiment is fully covered on this page.
Your decision.
You are randomly matched to another participant. The person to whom you are matched has (less than €12,500 gross income per year/more than €1 million in the bank account). You and the person to whom you are matched can earn real money in the experiment. You receive €100. The person to whom you are matched initially receives nothing. You are asked to send an amount to the other person between €0 and €100. The other person decides whether to accept or reject the amount you send to him/her. Before the other person makes a decision, he or she is told that you received €100 and that you could send an amount between €0 and €100 in steps of €10. The other person is also informed about his or her earnings and your earnings in case the person accepts or rejects the offer.
Earnings in the experiment.
In case the other person accepts the amount you send, the earnings of the other participant is the amount you send to the person. In that case, your earnings are the remainder of the amount, so €100 minus the amount you send to the other person. If the other person rejects the amount you send, you both earn nothing. Select one of the following amounts that you want to send to the other person:
€0
€10
€20
€30
€40
€50
€60
€70
€80
€90
€100
Payment.
At the end, the computer will decide randomly whether you and the person to whom you are matched get paid. The chance is at least 10%. If you are selected for payment, the person to whom you are matched gets paid too. You remain anonymous, also to the other participant. Moreover, the outcomes will be analyzed anonymously. ABN AMRO MeesPierson and Maastricht University guarantee that payments will be correct and as described in the instructions. At the end, you can provide details on your bank account to where we will transfer the money.
Ultimatum Game: Responder.
The experiment is fully covered on this page.
Your decision.
You are randomly matched to another participant. The person to whom you are matched has (less than €12,500 gross income per year/more than €1 million in the bank account). You and the person to whom you are matched can earn real money in the experiment. The other person is asked to divide €100 between you and himself/herself in steps of €10. We ask you to decide whether to accept or reject the amount the other person sent to you.
Earnings in the experiment.
Accept.
In case you accept the amount the other person sent, your earnings are the amount the other person sent to you. In that case, the earnings of the other person is the remainder of the amount, so €100 minus the amount he or she sent to you.
Reject.
If you reject the offer, you both earn nothing.
Example 1.
The other person sends €30 to you. If you accept, you earn €30 and the other person earns €70. If you reject, you and the other person get nothing.
Example 2.
The other person sends €80 to you. If you accept, you earn €80 and the other person earns €20. If you reject, you and the other person get nothing.
Please now indicate your choice. Click in the second/third columns for each amount the other person could send to you the word “accept” or “reject.”
| Accept | Reject | |
| €0 | ||
| €10 | ||
| €20 | ||
| €30 | ||
| €40 | ||
| €50 | ||
| €60 | ||
| €70 | ||
| €80 | ||
| €90 | ||
| €100 |
More information on the matching to the other person.
Before the other person makes a decision, he or she is told what your and his or her options are and what the corresponding earnings are.
Participants in your role will be matched to a participant in the other role at the end of the experiment. At the moment you make the decision, you will not yet know how much the other person sent to you. We therefore ask you to decide whether to accept or reject each amount the other person could send you. After you have been matched to the other person, we will pay you and the other person based on the actual amount the person sent you and the decision you made for that amount.
Payment.
At the end, the computer will decide randomly whether you and the person to whom you are matched get paid. The chance is at least 10%. If you are selected for payment, the person to whom you are matched gets paid too. You remain anonymous, also to the other participant. Moreover, the outcomes will be analyzed anonymously. ABN AMRO MeesPierson and Maastricht University guarantee that payments will be correct and as described in the instructions. At the end, you can provide details on your bank account to where we will transfer the money.
Supplementary Material
Acknowledgments
U.G. acknowledges funding by the John Templeton Foundation through the Science of Philanthropy Initiative.
Footnotes
The authors declare no conflict of interest.
This article is a PNAS Direct Submission.
This article contains supporting information online at www.pnas.org/lookup/suppl/doi:10.1073/pnas.1507949112/-/DCSupplemental.
References
- 1.Bekkers R. De vermogende gever. In: Schuyt T, editor. Geven in Nederland. Reed Business; Amsterdam: 2013. pp. 205–226. [Google Scholar]
- 2.Trautmann ST, van de Kuilen G, Zeckhauser RJ. Social class and (un)ethical behavior: A framework, with evidence from a large population sample. Perspect Psychol Sci. 2013;8(5):487–497. doi: 10.1177/1745691613491272. [DOI] [PubMed] [Google Scholar]
- 3.Kahneman D, Knetsch JL, Thaler R. Fairness as a constraint on profit seeking: Entitlements in the market. Am Econ Rev. 1986;76(4):728–741. [Google Scholar]
- 4.Forsythe R, Horowitz JL, Savin NE, Sefton M. Fairness in simple bargaining experiments. Games Econ Behav. 1994;6(3):347–369. [Google Scholar]
- 5.Engel C. Dictator games: A meta-study. Exp Econ. 2011;14(4):583–610. [Google Scholar]
- 6.Cappelen AW, Moene KO, Sørensen E, Tungodden B. Needs versus entitlements: An international fairness experiment. J Eur Econ Assoc. 2013;11(3):574–598. [Google Scholar]
- 7.Cappelen AW, Halvorsen T, Sørensen E, Tungodden B. Face-Saving or Fair Minded: What Motivates Moral Behavior? Norwegian School of Economics and Business Administration; Bergen, Norway: 2013. Available at papers.ssrn.com/sol3/papers.cfm?abstract_id=2229899. Accessed July 24, 2015. [Google Scholar]
- 8.Güth W, Schmittberger R, Schwarze B. An experimental analysis of ultimatum bargaining. J Econ Behav Organ. 1982;3(4):367–388. [Google Scholar]
- 9.Fiske AP. The four elementary forms of sociality: Framework for a unified theory of social relations. Psychol Rev. 1992;99(4):689–723. doi: 10.1037/0033-295x.99.4.689. [DOI] [PubMed] [Google Scholar]
- 10.Gneezy U, Rustichini A. Pay enough or do not pay at all. Q J Econ. 2000;115(3):791–810. [Google Scholar]
- 11.Frey BS, Jegen R. Motivation crowding theory. J Econ Surv. 2001;15(5):589–611. [Google Scholar]
- 12.Heyman J, Ariely D. Effort for payment. A tale of two markets. Psychol Sci. 2004;15(11):787–793. doi: 10.1111/j.0956-7976.2004.00757.x. [DOI] [PubMed] [Google Scholar]
- 13.Fehr E, List JA. The hidden costs and returns of incentives—Trust and trustworthiness among CEOs. J Eur Econ Assoc. 2004;2(5):743–771. [Google Scholar]
- 14.Falk A, Kosfeld M. The hidden costs of control. Am Econ Rev. 2006;96(5):1611–1630. [Google Scholar]
- 15.Güth W, Kocher MG. More than thirty years of ultimatum bargaining experiments: Motives, variations, and a survey of the recent literature. J Econ Behav Organ. 2014;108:396–409. [Google Scholar]
- 16.Cappelen AW, Nygaard K, Sørensen E, Tungodden B. Social preferences in the lab: A comparison of students and a representative population. Scand J Econ. 2015 doi: 10.1111/sjoe.12114. [DOI] [Google Scholar]
- 17.Oosterbeek H, Sloof R, van de Kuilen G. Cultural differences in ultimatum game experiments: Evidence from a meta-analysis. Exp Econ. 2004;7(2):171–188. [Google Scholar]
- 18.Riedl A, Smeets P. 2014. Why Do Investors Hold Socially Responsible Mutual Funds?. CESifo Working Paper no. 4403.
- 19.Piff PK, Kraus MW, Côté S, Cheng BH, Keltner D. Having less, giving more: The influence of social class on prosocial behavior. J Pers Soc Psychol. 2010;99(5):771–784. doi: 10.1037/a0020092. [DOI] [PubMed] [Google Scholar]
- 20.Piff PK, Stancato DM, Côté S, Mendoza-Denton R, Keltner D. Higher social class predicts increased unethical behavior. Proc Natl Acad Sci USA. 2012;109(11):4086–4091. doi: 10.1073/pnas.1118373109. [DOI] [PMC free article] [PubMed] [Google Scholar]
- 21.Erkal N, Gangadharan L, Nikiforakis N. Relative earnings and giving in a real-effort experiment. Am Econ Rev. 2011;101(7):3330–3348. [Google Scholar]
- 22.Sutter M, Kocher MG. Trust and trustworthiness across different age groups. Games Econ Behav. 2007;59:364–382. [Google Scholar]
- 23.Sutter M. Outcomes versus intentions: On the nature of fair behavior and its development with age. J Econ Psychol. 2007;28:69–78. [Google Scholar]
- 24.Andersen S, Ertaç S, Gneezy U, Hoffman M, List J. Stakes matter in ultimatum games. Am Econ Rev. 2011;101(3):3427–3439. [Google Scholar]
- 25.van Damme E, et al. How Werner Güth’s ultimatum game shaped our understanding of social behavior. J Econ Behav Organ. 2014;108:292–318. [Google Scholar]
Associated Data
This section collects any data citations, data availability statements, or supplementary materials included in this article.


