Abstract
Skeletal muscles are composed of heterogeneous muscle fibers that have different physiological, morphological, biochemical, and histological characteristics. In this work, skeletal muscles extensor digitorum longus, soleus, and whole gastrocnemius were analyzed by matrix-assisted laser desorption/ionization mass spectrometry to characterize small molecule metabolites of oxidative and glycolytic muscle fiber types as well as to visualize biomarker localization. Multivariate data analysis such as principal component analysis (PCA) and partial least squares discriminant analysis (PLS-DA) were performed to extract significant features. Different metabolic fingerprints were observed from oxidative and glycolytic fibers. Higher abundances of biomolecules such as antioxidant anserine as well as acylcarnitines were observed in the glycolytic fibers, whereas taurine and some nucleotides were found to be localized in the oxidative fibers.
Introduction
Skeletal muscles compose over 40% of the human body mass and are a major contributor to overall metabolic homeostasis [1-4]. Various conditions and diseases affect skeletal muscle function, and thus, the physical performance and health of the organism. For instance, the Duchene muscular dystrophy is found in 1 of 3,500 males in their early childhood, in which rapid degeneration of the muscles occurs followed by death in the patient's early twenties [1, 2, 5]. Decrease in muscle quality, mass, and strength arising from conditions such as aging and obesity have been observed as well [5-11]. Diagnostic imaging methodologies may enhance our ability to identify metabolic and structural abnormalities contributing to these diseases states.
Skeletal muscles are heterogeneous in nature, and are composed of a mixture of muscle fibers that can be distinguished based on different physiological, morphological, biochemical, and histological characteristics. Historically, skeletal muscle fibers were divided into two types: slow-twitch and fast-twitch fibers, which correspond to their speed of shortening [12, 13]. The two types are also known as red and white fibers, respectively, for their different appearance in color, where the red color arises from the higher amount of myoglobin and higher number of capillaries in slow-twitch fibers [13, 14]. In the 1960s, with the use of ATPase histochemical staining analysis, the two fiber types were found to have different ATPase activity. The slow-twitch fibers rely predominantly on oxidative metabolism, whereas the fast-twitch fibers have higher glycolytic capacity [12, 13]. Subsequently, subtypes (i.e., IIa and IIb) of fast-twitch fibers were found by the use of the succinate dehydrogenase staining method [12, 14]. In the late 1980s, the analysis of muscle myosin heavy chain (MyHC) composition with monoclonal antibodies revealed the four MyHC isoforms, type I, type IIa , type IIx , and type IIb [13, 14]. It is important to note that not all animals express all four types, and nor does each fiber type express similar properties across different species [12-14].
Metabolomics, a comprehensive investigation of the metabolome perturbation resulting from the biological or environmental stimuli, has gained attention in the field of systems biology [15, 16]. This approach of study involves large-scale identification and quantitation of small molecules (metabolites) such as amino acids, nucleotides, fatty acids, and lipids [16, 17]. While several analytical platforms and techniques are available for conducting metabolomics analysis, mass spectrometry has proven to be highly valuable due to its high selectivity and sensitivity [15, 16]. A general workflow of a metabolomics analysis involves (1) collecting the appropriate samples, (2) sample preparation for the analytical method of choice, (3) sample analysis, (4) data processing and analysis (which typically involves multivariate statistical analysis such as principal component analysis (PCA) or partial least squares discriminant analysis (PLS-DA)), (5) biomarker structural elucidation and identification, (6) and biological interpretation [16, 18]. Several mass spectrometry based proteomic analysis of skeletal fiber types and their responses to conditions and disease such as aging [19] and immobilization-induced atrophy [20] have been reported; however, very limited metabolomics studies have been conducted. Thus, metabolomic characterization of skeletal muscle fiber types may provide valuable insight into biology and disease.
Mass spectrometric imaging (MSI) is a microprobe technique that detects and maps a large number of biomolecules directly from the tissue sections [21, 22]. More importantly, MSI is a label-free technique that does not require the use of radiolabeling or fluorescent tagging as in whole-body autoradiography and fluorescence microscopy, respectively [21]. The use of matrix-assisted laser desorption/ionization (MALDI) is perhaps the most common ionization source used for biomolecule MSI analysis [21, 22]. Briefly, a typical MALDI MSI experiment involves (1) collecting appropriate samples (i.e., samples with structural or spatial information), (2) sample preparation (e.g., cryostat sectioning, drying, matrix coating), (3) tissue analysis by raster underneath the laser to collect mass spectra at discrete positions, (4) mass analysis by identifying mass-to-charge (m/z) values of analytes of interest, and (5) ion image generation by plotting the intensity of the m/z versus the X,Y position. This work reports the metabolomic analysis of oxidative and glycolytic skeletal muscles by MALDI MSI and the correlation to histochemical analysis.
Experimental Section
Chemical and Material
2, 5-dihydroxybenzoic acid (DHB) and 9-aminoacridine (9AA) were purchased from Sigma-Aldrich (St. Louis, MO). HPLC grade water (H2O), chloroform (CHCl3), methanol (MeOH), and phosphate buffered saline (PBS) were purchased from Fisher Scientific (Fair Lawn, NJ), while 100% ethanol (EtOH) was purchased from Decon Labs (King of Prussia, PA). Two different matrix solutions were prepared for positive and negative ion mode analyses. For positive ion mode, 0.5 M DHB in 100% MeOH was used, whereas 10 mg/mL 9AA in 70:30 (v:v) EtOH:H2O was prepared for negative ion mode analysis. For the multicolor immunofluorescence analysis, primary antibodies BAF8, SC-71, and BF-F3 were purchased in 1 mL supernatant form from the Developmental Studies Hybridoma Bank at the University of Iowa (Iowa City, Iowa). Secondary antibodies Alexa Fluor 350 Goat Anti-Mouse IgG2b (γ2b), Alexa Fluor 488 Goat Anti-Mouse IgG1 (γ1), Alexa Fluor 555 Goat Anti-Mouse IgM (μ chain), and Prolong Gold antifade reagent were purchased from Life Technologies (Grand Island, NY).
Animals and Sample Preparation
Six month old male Fisher 344 x Brown Norway (F344BN) rats were purchased from the National Institute on Aging Colony at Harlan Laboratories (Indianapolis, IN). This rat strain is known for its increased lifespan along with decreased cumulative lesion compared with other strains, as well as age-related increase in adiposity and decreased lean body mass [23, 24].The animals were housed individually on a 12-h light/dark cycle in a specific pathogen-free facility accredited by the American Association for Accreditation of Laboratory Animal Care. Animals were fed with a standard rodent chow (18% kcal from fat, no sucrose, 3.1 kcal/g, diet 2018, Harlan Teklad; Madison, WI), and were housed for four weeks to adapt to their housing conditions for establishing baseline health, body composition, and food intake prior to sacrifice. Health status, body weight, and food intake were monitored daily. All experimental protocols were approved by the University of Florida's Animal Care and Use Committee, and in accordance with the “Guide for the Care and Use of Laboratory Animals”. Rats were sacrificed by rapid decapitation using a guillotine; soleus (SOL), extensor digitorum longus (EDL), and gastrocnemius (GAS) muscles were removed and subsequently flash frozen in liquid nitrogen. All muscle blocks were stored in an −80 °C freezer until further preparation. SOL, EDL, and GAS muscles were selected for this study because of their characteristic fiber type compositions. SOL and EDL are mainly composed of type 1 and type 2 fibers, respectively [25, 26]. GAS is composed of a mixture of type 1 and type 2 fibers, with the regionalization of oxidative type 1 fibers in the deeper region of the muscle group [27].
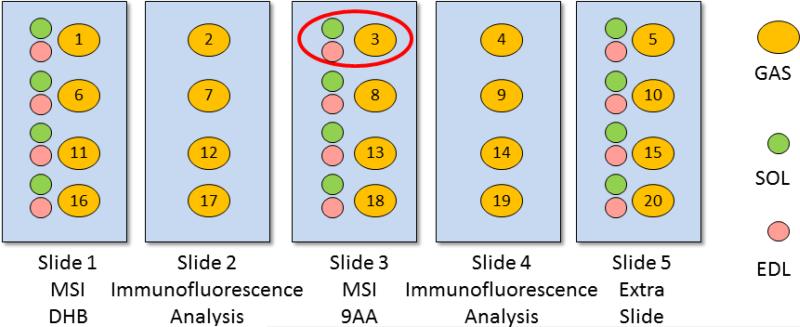
All muscle blocks were sectioned using a Microm HM 505E cryostat (Waldorf, Germany). A drop of HPLC-grade water was used to freeze the tissue block onto the cutting stage in the cryostat camber, which was held at −25° C. Serial muscle cross sections were collected at 10 μm thickness and thaw-mounted atop glass microscope slides for positive and negative ion mode MSI and multicolor immunofluorescence analyses. Every three consecutive sections from the GAS muscle were prepared as a group, with the first and third sections used for MSI analysis, and the middle sections used for immunofluorescence analysis. In addition, SOL and EDL were also prepared for MSI analysis, as shown in Figure 1; however, SOL and EDL sections were not submitted for immunofluorescence analysis. The SOL and EDL sections were placed next to a GAS section on the MSI slides; the three muscle cross sections were analyzed by MSI as a group, indicated by the red circle.
Figure 1.
Muscle cross section preparation and arrangement for mass spectrometric imaging and immunofluorescence analyses and correlation. For MSI, SOL, EDL, and GAS were analyzed together as a group as indicated by the red circle.
For MSI analysis, tissue sections were placed in a vacuum desiccator for 1 hour to remove moisture and subsequently coated with 0.5 M DHB in 100% MeOH or 10 mg/mL 9AA in 70:30 EtOH:H2O matrix solutions. The slides were spray coated with matrix solutions using a glass Type A Meinhard nebulizer (Golden, CO) using nitrogen gas at a pressure of 30 psi and a flow rate of 3 mL/min.
For multicolor immunofluorescence analysis, tissue sections were first air dried for 1 hour. Multicolor immunofluorescence staining analysis for the MHC expression was performed according to Bloemberg and Quadrilatero [28]. Briefly, the 10 μm-thick cross-sections were set at room temperature to air dry for at least 10 minutes. The cross-sections were blocked with 10% goat serum in PBS, incubated at room temperature for 60 minutes inside the staining humidity chamber. The primary antibody cocktail was prepared as described in Table 1, and applied to cover the cross sections; the tissue sections were incubated for 60 minutes. Cross sections were then washed three times, 5 minutes each time, with PBS before the application of the secondary antibody cocktail solution. The cross sections were treated with the secondary antibody cocktail solution, and the incubation was performed in dark for 60 minutes. Before mounting the coverslips with Prolong Gold antifade reagent, three PBS washes were performed. All cocktail solutions were prepared in 10% goat serum in PBS.
Table 1.
Primary and secondary antibody cocktails and concentrations for rat muscle fiber myosin heavy chain immunofluorescence staining. All cocktails are prepared in 10% normal goat serum in PBS.
| Primary Antibody Cocktail | Concentration | MyHC Reactivity | Secondary Antibody Cocktail | Concentration | Fluorescence |
|---|---|---|---|---|---|
| BA-FA | 1 :50 | I | Alexa Fluor 350 IgG2b | 1:500 | Blue |
| SC-71 | 1:600 | IIa | Alexa Fluor 488 IgG1 | 1:500 | Green |
| BF-F3 | 1:100 | IIb | Alexa Fluor 555 IgM | 1:500 | Red |
Instrumentation
Multicolor Immunofluorescence Analysis
An Aperio ScanScope FL (Vista, CA) with an XCite mercury light source and an Olympus 20X/0.75 Plan Apo objective was used for scanning the fluorescent stained tissues and capturing the image at 20X; the resolution is approximately 0.468 μm/pixel.
Mass Spectrometry and Imaging Analysis
All MS experiments were performance using a Thermo LTQ XL (San Jose, CA) equipped with a Lasertechnik Berlin MNL 106-LD N2 laser (Berlin, Germany) with a repetition rate of 60 Hz, wavelength at λ = 337 nm, and laser spot size at approximately 100 μm in diameter. All tissue sections were rastered with a step size of 100 μm. A laser energy of 3 μJ and 3 laser shots per spot were used for all MS experiments.
Image Generation and Data Analysis
Multicolor Immunofluorescence Analysis
All multicolor immunofluorescence images were generated using Aperio ImageScope (Vista, CA). Image and contrast were adjusted to allow best visualization of different fluorescent color.
Statistical Analysis
Multivariate data analysis was performed to extract features in the datasets. Comparison was made among four sample groups, SOL, EDL, oxidative region of GAS (GasOx), and glycolytic region of GAS (GasGly). PCA and PLS-DA were performed using the MetaboAnalyst web server [29, 30]. From centroid data, the m/z values and intensity lists were exported from QualBrowser into Microsoft Excel and saved as .csv files. Each m/z and intensity list was an average of 10 mass spectra (or scans). At least 10 lists per sample group were used for PCA and PLS-DA. A mass tolerance of 0.5 m/z was used to match peaks across samples. Known m/z values from the MALDI matrix were removed from the dataset. Finally, the dataset was auto-scaled and normalized by sum prior to PCA and PLSDA. Scores and loadings from PCA and PLS-DA were evaluated for significant m/z values for further analysis.
MS Imaging
The MS images were extracted from position specific mass spectra using Thermo ImageQuest v1.0.1 software (San Jose, CA). All MS images were generated by normalizing ion intensity to the total ion current (TIC) at each pixel.
Compound Identification
Compounds were identified using an in-group database as well as by tandem MS (MSn) using collision-induced dissociation (CID) or pulsed Q collision-induced dissociation (PQD). For MS2, the isolation window was set at 1.5 amu with a collision energy of 35 to 40 arbitrary units normalized to m/z 400.
Results
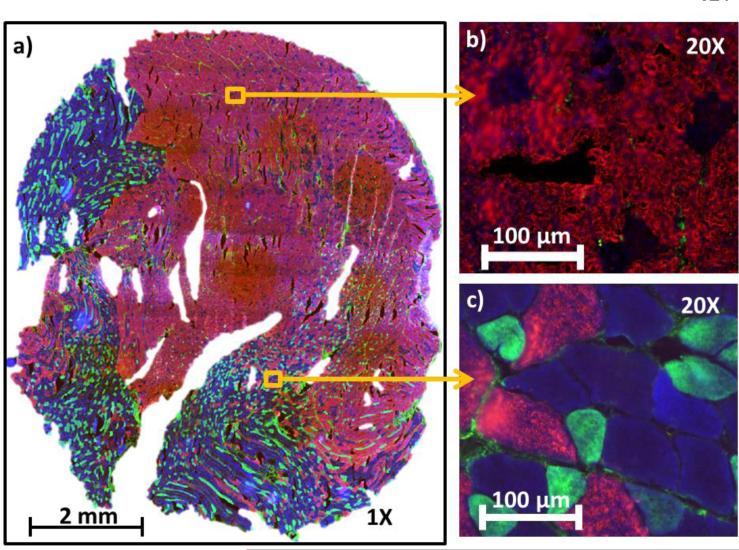
An image captured from one of the MyHC immunofluorescence stained gastrocnemius cross-section is shown in Figure 2. As described in Table 1, muscle cross sections were stained with antibodies emitting a blue fluorescence for type I fibers, green fluorescence for type IIa fibers, and red fluorescence for type IIb fibers. Type IIx fibers existed in small number and were left unstained, and hence emitted no fluorescence and appeared black. As previously mentioned, regionalization of oxidative fibers (i.e., type I in blue and type IIa in green) exists in GAS muscles, and can be visualized from the fluorescence image. The immunofluorescence stained image was used to define the area of interest, i.e., the oxidative (blue and green) and the glycolytic (red and black) regions.
Figure 2.
Myosin heavy chain (MyHC) immunofluorescence stained GAS muscle from a 6-month old rat. The fibers were stained with antibodies that emitted fluorescence as described in Table 1. There are 4 different MyHC expressions in rat, type I (blue), IIa (green), IIx (black), and IIb (red). Type IIx fibers, which existed in small in this cross section, were left unstained and hence emitted no fluorescence. Figure 2a) shows the image at 1X, whereas b) and c) show the zoom in at 20X of selected areas indicated by the yellow squares.
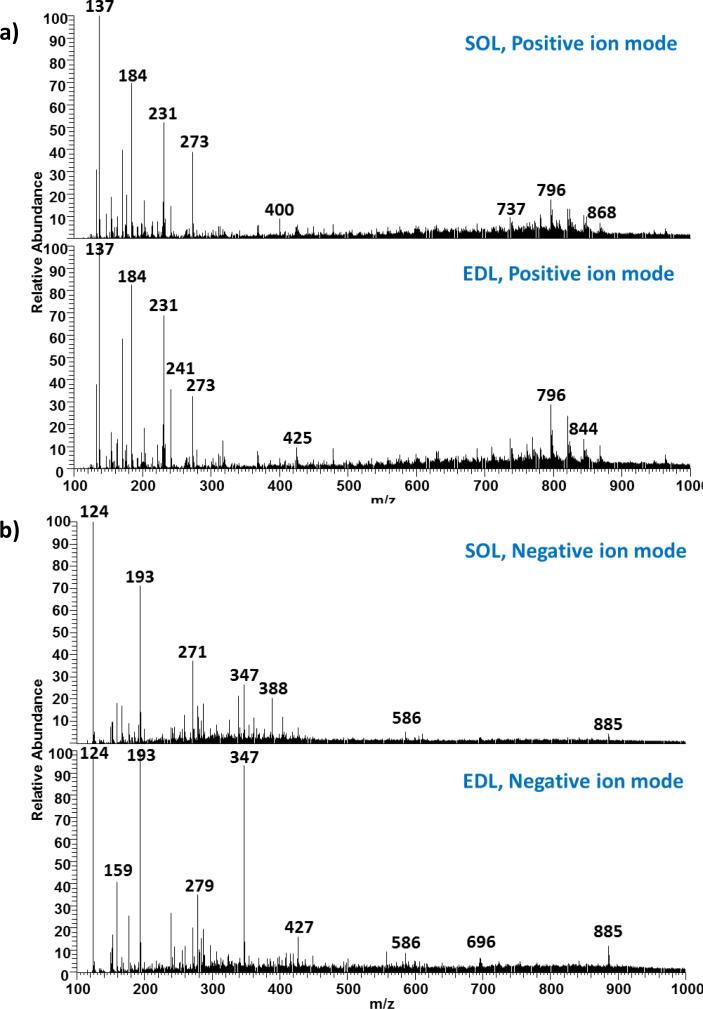
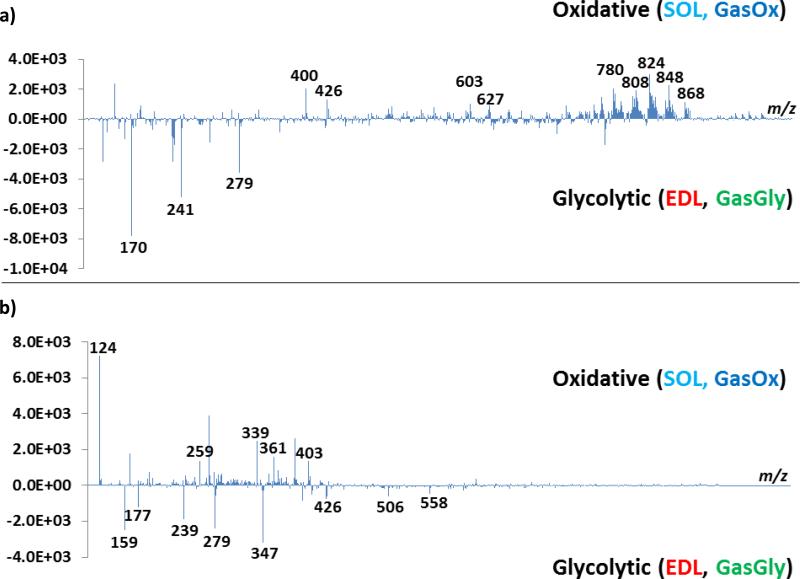
As an initial investigation, averaged mass spectra of 10 scans collected from SOL and EDL from positive and negative ion modes were compared, as shown in Figure 3a and b, respectively. Differences can be extracted by simple comparison between the spectra; however, the process is tedious and time-consuming. Furthermore, ions of significance or low intensity can be masked by higher intensity ions. As a result, PCA and PLS-DA were performed to aid in feature extraction.
Figure 3.
Comparison between SOL and EDL in a) positive ion mode, and b) negative ion mode. Each mass spectrum is an averaged spectrum of 10 consecutive scans collected form the corresponding tissue.
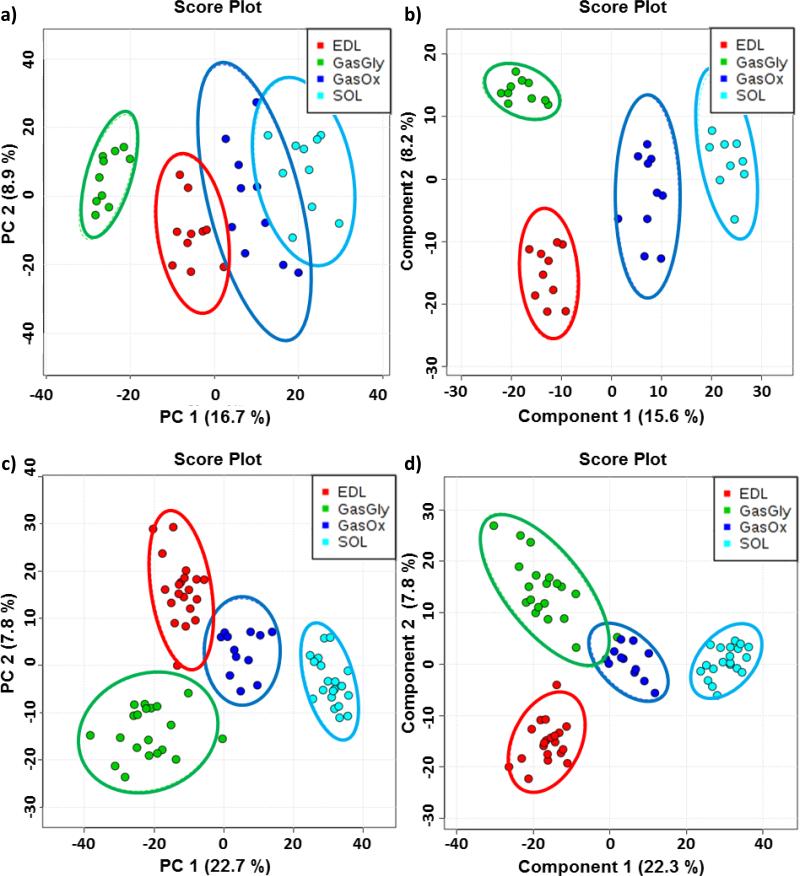
At least 10 averaged spectra were extracted from SOL, EDL, oxidative region of GAS (GasOx), and glycolytic region of GAS (GasGly) and submitted for PCA and PLS-DA. Each spectrum is an average of 10 consecutive scans from the corresponding tissue or region. The 2D score plots are shown in Figure 4; a) displays the score plot of principal component 2 (PC2) versus principal component (PC1) from PCA, whereas b) shows the score plot of component 2 versus component 1 from the PLS-DA; both analyses were performed on the positive ion mode dataset. PCA and PLS-DA were also performed on the negative ion mode dataset (Figures 4c) and 4d), respectively). Although the first two principal components carried less than 23% of the total variance in both positive and negative ion mode, complete separation between oxidative fibers and glycolytic fibers sample points can be observed by PC1 from both ion modes; the same result was observed from the PLSDA, with tighter grouping of the sample points within each group.
Figure 4.
PCA and PLS-DA results from the mean-centered and auto scaled dataset. Figure a) and b) display the score plots between the first two components from PCA and PLS-DA, respectively, on the positive ion mode dataset. The two analyses were also performed on the negative ion mode dataset and are shown in c) and d). Each data point represents one averaged spectrum of 10 scans collected at the area of interest; the colored circles around the data points represent the 95% confidence interval of the sample grouping
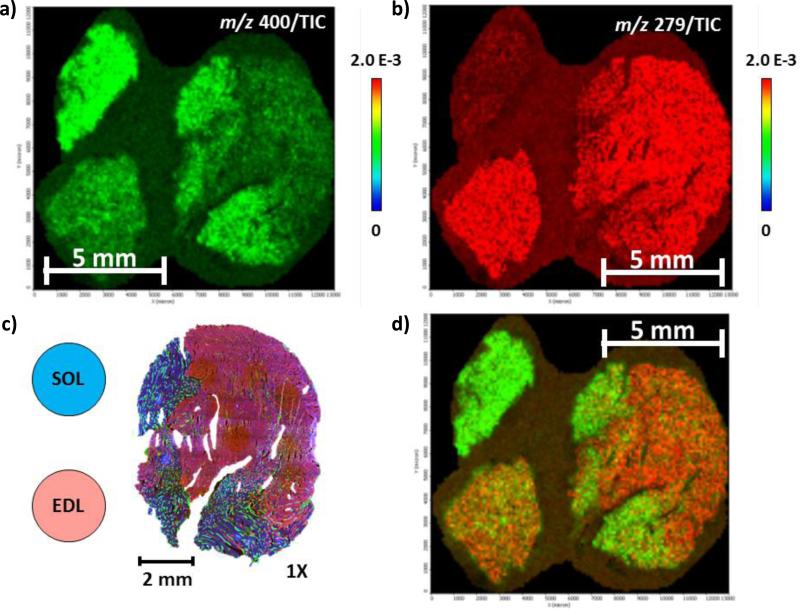
The loadings of PC1 (for PCA) were evaluated for significant m/z values that contributed to the separation of the groupings, and the loadings plots are shown in Figure 5a) and b) for positive and negative ion mode datasets, respectively. The m/z values contributing significantly to the separation are labeled in the plots, and the features, along with their putative identifications, extracted from positive and negative ion modes are listed in Table 2 and 3, respectively. Comparing Figures 3 and 5, it is apparent that PCA and PLS-DA are invaluable at identifying the m/z values (and hence the biomarkers) that vary significantly between the fiber types. Furthermore, the MS images of the identified m/z values are displayed in Figure 6.
Figure 5.
PC1 loadings plots from a) positive and b) negative ion mode PCA. The labeled m/z peaks are those that show significant localization in the MS images.
Table 2.
Features extracted and putatively identified from positive ion mode analysis and the direction of loading in the PCA.
| Positive Ion Mode | |||
|---|---|---|---|
| m/z | Adduct | Identification | Higher Loading Area |
| 170 | [M+H]+ | Methyl histidine | Glycolytic |
| 241 | [M+H]+ | Anserine | Glycolytic |
| 279 | [M+K]+ | Anserine | Glycolytic |
| 400 | [M+H]+ | Palmitoyl carnitine | Oxidative |
| 426 | [M+H]+ | Oleoyl carnitine | Oxidative |
| 603 | - | Fragment from phosphatidylcholine (18:1/18:1) | Oxidative |
| 627 | - | Fragment from phosphatidylcholine (18:2_20:4) | Oxidative |
| 780 | [M+Na]+ | Phosphatidylcholine (16:0_18:2) | Oxidative |
| 808 | [M+Na]+ | Phosphatidylcholine (18:1/18:1) | Oxidative |
| 824 | [M+K]+ | Phosphatidylcholine (18:1/18:1) | Oxidative |
| 848 | [M+K]+ | Phosphatidylcholine (18:0_20:4) | Oxidative |
| 868 | [M+Na]+ | Phosphatidylcholine (20:0/20:0) | Oxidative |
Table 3.
Features extracted and putatively identified from negative ion mode analysis and the direction of loading in the PCA.
| Negative Ion Mode | |||
|---|---|---|---|
| m/z | Adduct | Identification | Higher Loading Area |
| 124 | [M-H]− | Taurine | Oxidative |
| 259 | [M-H]− | Glucose monophosphate (GMP) | Oxidative |
| 339 | [M-H]− | Fructose bisphosphate (FBP) | Oxidative |
| 361 | [M+Na-2H]− | Fructose bisphosphate (FBP) | Oxidative |
| 403 | [M-H]− | Uridine diphosphate (UDP) | Oxidative |
| 159 | - | HP2O6− fragment | Glycolytic |
| 177 | - | H3P2O7− fragment | Glycolytic |
| 239 | - | H2P3O9− fragment | Glycolytic |
| 347 | [M-H]− | Inosine monophosphate (IMP) | Glycolytic |
| 426 | [M-H]− | Adenosine diphosphate (ADP) | Glycolytic |
| 506 | [M-H]− | Adenosine triphosphate (ATP) | Glycolytic |
| 558 | [M-H]− | Adenosine diphosphate-ribose (ADP-ribose) | Glycolytic |
Figure 6.
Representative positive ion mode MS images of a) m/z 400, palmitoyl carnitine, and b) m/z 279, anserine, showing the localization of biomarkers in the oxidative and glycolytic areas, respectively. d) shows the overlay image of m/z 279 and 400. c) shows the arrangement of the three tissues SOL (oxidative), EDL (glycolytic), and GAS (gastrocnemius) with the circles indicate where the SOL and EDL were positioned for MSI relative to the GAS, which is shown with the immunofluorescence image.
Discussion and Summary
Different metabolomics fingerprints were observed from oxidative and glycolytic skeletal muscles. Methyl histidine ([M+H]+ at m/z 170) and anserine ([M+H]+ at m/z 241) were found to be higher in glycolytic fibers. These two biomolecules are known to be present in skeletal muscles and are high in antioxidant activity [31, 32]. These two biomolecules and other histidine derivatives such as carnosine are known to be higher in animals with sprinter characteristic that require fast turnover of energy [31, 32], which explains the higher abundance in the glycolytic fibers that are responsible for fast, explosive movements. Other biomolecules localized in the glycolytic region include IMP, ADP, and ATP ([M-H]− ions at m/z 347, 426, and 506, respectively). Nucleotides can degrade to nucleosides by 5'-nucleotidase by dephosphorylation of AMP ribose and IMP, which can be produced from AMP by AMP deaminase. This leads to the accumulation of IMP in the skeletal muscles as the activity of AMP deaminase is higher than that of 5'-nucleotidase [33]. The difference between the glycolytic and oxidative region in the abundance of IMP may due to the slower salvage rate in the glycolytic fibers compared oxidative fibers [33]. In the case of ATP, this present study is in agreement with several studies on muscle biopsies of human and animals that showed higher ATP content per gram of wet weight in a predominantly fast-twitch muscle when compared to muscle composed of predominantly slow-twitch fibers [34]. Interestingly, based on our previous and current studies, we found that small metabolites such as ATP and ADP have limited stability such that they are readily detectable by MALDI MS from fresh-cut cross sections that were immediately coated with matrix upon drying. If the cross sections were stored in the −80 °C prior to coating, the signals fluctuate. We are currently working on testing this observation.
For the oxidative region, palmitoyl (16:0) and oleoyl (18:1) carnitines ([M+H]+ at m/z 400 and 426, respectively) were found to be higher abundance when compared to the glycolytic region. This observation may be due to the fact that oxidative fibers generate most energy (i.e., ATP) by oxidative phosphorylation using fatty acid as the primary substrate [12]. Fatty acids are supplied to the fiber either by fatty acids bound to albumin or by hydrolyzed triacylglycerides [35]; they were converted to acyl CoA, and then finally to acylcarnitines to enter the mitochondrial where they can undergo ß oxidation [35]. In terms of phosphatidylcholines (PCs), most of the identified PCs showed localization and higher abundance in the oxidative region were composed of 18:1 (oleic) fatty acid tail; this observation is also in concordance with literatures [36, 37] that showed higher amount of oleic fatty acid as PC fatty acid tail in SOL. One explanation to this difference in PC fatty acid tail composition between oxidative and glycolytic regions is that there is a greater number of long-chain fatty acid transporters in oxidative muscles compared to glycolytic [38]; this difference in fatty acid transporter population also explains the differences in acycarnitine abundance between the two regions.
Taurine is a sulfonic amino acid found in high concentrations in skeletal muscles and serves several functions in osmoregulation, nerve excitement modulation, antioxidation, and Ca2+ homeostasis [39, 40]. While its abundance varies across muscles and animals species, taurine is found to be higher in slow-twitch fibers (i.e., oxidative fibers) [39, 40], and this pattern is also observed in this study. However, because the resting levels of GMP, FBP and UDP are not documented in the literatures, their localization to the oxidative region remains an empirical question. One speculation may be that because oxidative fibers are able to generate almost all of the energy they need by oxidative phosphorylation [12], almost no glycolytic metabolism would occur in the oxidative fibers, leading to the accumulation of the precursor molecules GMP and FBP.
This work demonstrates the use of MALDI MSI in skeletal muscle composition analysis and reports different metabolic profiles of various muscle fiber types. MALDI MSI offers significant advantages over traditional histological staining methods since both the chemical and spatial information of the cross section are preserved and can be analyzed in the same cross section. Coupled with multivariate data analysis, MALDI MSI can be a useful tool in the study of skeletal muscle in biomarker discovery.
Acknowledgements
This work was supported by the National Institute of Health grant P30 AG028740, Clinical and Translational Science Institute (CTSI, UL1 TR000064), and Southeast Center for Integrated Metabolomics (SECIM, NIH grant #U24 DK097209). The authors would also like thank Dr. Paramita Chakrabarty from the Department of Neuroscience, Center for Translational Research in Neurodegenerative Disease (CTRND), University of Florida, for the assistance in acquiring immunofluorescence image.
References
- 1.Squire JM. Muscle: Design, Diversity, and Disease. The Benjamin/Cummings Publishing Company, Inc.; Menlo Park, California: 1986. pp. 319–322. [Google Scholar]
- 2.Wortmann RL. Diseases of Skeletal Muscle. 8-12. Lippincott Williams & Wilkins; Philadelphia, PA: 2000. pp. 208–209. [Google Scholar]
- 3.Jackson SN, Woods AS. Direct profiling of tissue lipids by MALDITOFMS. Journal of chromatography. B, Analytical technologies in the biomedical and life sciences. 2009;877(26):2822–2829. doi: 10.1016/j.jchromb.2008.11.033. [DOI] [PMC free article] [PubMed] [Google Scholar]
- 4.Schiller J. In: MALDI-MS of Lipids. MALDI MS, editor. Wiley-VCH Verlag GmbH & Co.; KGaA: 2007. pp. 215–243. [Google Scholar]
- 5.Tahallah N, Brunelle A, De La Porte S, Laprévote O. Lipid mapping in human dystrophic muscle by cluster-time-of-flight secondary ion mass spectrometry imaging. Journal of Lipid Research. 2008;49(2):438–454. doi: 10.1194/jlr.M700421-JLR200. [DOI] [PMC free article] [PubMed] [Google Scholar]
- 6.Frontera WR, Reid KF, Phillips EM, Krivickas LS, Hughes VA, Roubenoff R, Fielding RA. Muscle fiber size and function in elderly humans: a longitudinal study. Journal of Applied Physiology. 2008;105(2):637–642. doi: 10.1152/japplphysiol.90332.2008. [DOI] [PMC free article] [PubMed] [Google Scholar]
- 7.Alnaqeeb MA, Goldspink G. Changes in fibre type, number and diameter in developing and ageing skeletal muscle. Journal of Anatomy. 1987;153:31–45. [PMC free article] [PubMed] [Google Scholar]
- 8.Goodpaster BH, Wolf D. Skeletal muscle lipid accumulation in obesity, insulin resistance, and type 2 diabetes. Pediatric Diabetes. 2004;5(4):219–226. doi: 10.1111/j.1399-543X.2004.00071.x. [DOI] [PubMed] [Google Scholar]
- 9.Kim DH, Choi J-W, Joo JI, Wang X, Choi DK, Oh TS, Yun JW. Changes in expression of skeletal muscle proteins between obesity-prone and obesity-resistant rats induced by a high-fat diet. Journal of Proteome Research. 2010;10(3):1281–1292. doi: 10.1021/pr101048q. [DOI] [PubMed] [Google Scholar]
- 10.Thompson LV. Age-Related Muscle Dysfunction. Experimental gerontology. 2009;44(0):106–111. doi: 10.1016/j.exger.2008.05.003. [DOI] [PMC free article] [PubMed] [Google Scholar]
- 11.Turpin SM, Ryall JG, Southgate R, Darby I, Hevener AL, Febbraio MA, Kemp BE, Lynch GS, Watt MJ. Examination of ‘lipotoxicity’ in skeletal muscle of high-fat fed and ob/ob mice. The Journal of Physiology. 2009;587(Pt 7):1593–1605. doi: 10.1113/jphysiol.2008.166033. [DOI] [PMC free article] [PubMed] [Google Scholar]
- 12.Schiaffino S, Reggiani C. Fiber types in mammalian skeletal muscles. Physiological Reviews. 2011;91(4):1447–1531. doi: 10.1152/physrev.00031.2010. [DOI] [PubMed] [Google Scholar]
- 13.Scott W, Stevens J, Binder-Macleod SA. Human skeletal muscle fiber type classifications. Physical Therapy. 2001;81(11):1810–1816. [PubMed] [Google Scholar]
- 14.Marini M, Veicsteinas A. The exercised skeletal muscle: a review. European Journal of Translational Myology. 2010;20(3) [Google Scholar]
- 15.Courant F, Antignac J-P, Dervilly-Pinel G, Le Bizec B. Basics of mass spectrometry based metabolomics. PROTEOMICS. 2014;14(21-22):2369–2388. doi: 10.1002/pmic.201400255. [DOI] [PubMed] [Google Scholar]
- 16.Dettmer K, Aronov PA, Hammock BD. Mass spectrometry-based metabolomics. Mass Spectrometry Reviews. 2007;26(1):51–78. doi: 10.1002/mas.20108. [DOI] [PMC free article] [PubMed] [Google Scholar]
- 17.Milne SB, Mathews TP, Myers DS, Ivanova PT, Brown HA. Sum of the Parts: Mass Spectrometry-Based Metabolomics. Biochemistry. 2013;52(22):3829–3840. doi: 10.1021/bi400060e. [DOI] [PMC free article] [PubMed] [Google Scholar]
- 18.Patti GJ, Yanes O, Siuzdak G. Innovation: Metabolomics: the apogee of the omics trilogy. Nat Rev Mol Cell Biol. 2012;13(4):263–269. doi: 10.1038/nrm3314. [DOI] [PMC free article] [PubMed] [Google Scholar]
- 19.Chaves DFS, Carvalho PC, Lima DB, Nicastro H, Lorenzeti FM, Siqueira-Filho M, Hirabara SM, Alves PHM, Moresco JJ, Yates JR, Lancha AH. Comparative proteomic analysis of the aging soleus and extensor digitorum longus rat muscles using TMT labeling and mass spectrometry. Journal of Proteome Research. 2013;12(10):4532–4546. doi: 10.1021/pr400644x. [DOI] [PMC free article] [PubMed] [Google Scholar]
- 20.Isfort RJ, Wang F, Greis KD, Sun Y, Keough TW, Bodine SC, Anderson NL. Proteomic analysis of rat soleus and tibialis anterior muscle following immobilization. Journal of Chromatography B. 2002;769(2):323–332. doi: 10.1016/s1570-0232(02)00021-1. [DOI] [PubMed] [Google Scholar]
- 21.Chughtai K, Heeren RMA. Mass Spectrometric Imaging for biomedical tissue analysis. Chemical reviews. 2010;110(5):3237–3277. doi: 10.1021/cr100012c. [DOI] [PMC free article] [PubMed] [Google Scholar]
- 22.Stoeckli M, Chaurand P, Hallahan DE, Caprioli RM. Imaging mass spectrometry: A new technology for the analysis of protein expression in mammalian tissues. Nat Med. 2001;7(4):493–496. doi: 10.1038/86573. [DOI] [PubMed] [Google Scholar]
- 23.Lipman RD, Chrisp CE, Hazzard DG, Bronson RT. Pathologic characterization of Brown Norway, Brown Norway × Fischer 344, and Fischer 344 × Brown Norway rats with relation to age. The Journals of Gerontology Series A: Biological Sciences and Medical Sciences. 1996;51A(1):B54–B59. doi: 10.1093/gerona/51A.1.B54. [DOI] [PMC free article] [PubMed] [Google Scholar]
- 24.Rice K, Linderman J, Kinnard R, Blough E. The Fischer 344/NNiaHSd X Brown Norway/BiNia is a better model of sarcopenia than the Fischer 344/NNiaHSd: a comparative analysis of muscle mass and contractile properties in aging male rat models. Biogerontology. 2005;6(5):335–343. doi: 10.1007/s10522-005-4808-0. [DOI] [PubMed] [Google Scholar]
- 25.Alnaqeeb MA, Goldspink G. Changes in fibre type, number and diameter in developing and ageing skeletal muscle. Journal of Anatomy. 1987;153:31–45. [PMC free article] [PubMed] [Google Scholar]
- 26.Soukup T, Zachařová G, Smerdu V. Fibre type composition of soleus and extensor digitorum longus muscles in normal female inbred Lewis rats. Acta Histochemica. 2002;104(4):399–405. doi: 10.1078/0065-1281-00660. [DOI] [PubMed] [Google Scholar]
- 27.Wang LC, Kernell D. Quantification of fibre type regionalisation: an analysis of lower hindlimb muscles in the rat. Journal of Anatomy. 2001;198(Pt 3):295–308. doi: 10.1046/j.1469-7580.2001.19830295.x. [DOI] [PMC free article] [PubMed] [Google Scholar]
- 28.Bloemberg D, Quadrilatero J. Rapid determination of myosin heavy chain expression in rat, mouse, and human skeletal muscle using multicolor immunofluorescence analysis. PLoS ONE. 2012;7(4):e35273. doi: 10.1371/journal.pone.0035273. [DOI] [PMC free article] [PubMed] [Google Scholar]
- 29.Xia J, Psychogios N, Young N, Wishart DS. MetaboAnalyst: a web server for metabolomic data analysis and interpretation. Nucleic Acids Research. 2009;37(Web Server issue):W652–W660. doi: 10.1093/nar/gkp356. [DOI] [PMC free article] [PubMed] [Google Scholar]
- 30.Xia J, Mandal R, Sinelnikov IV, Broadhurst D, Wishart DS. MetaboAnalyst 2.0—a comprehensive server for metabolomic data analysis. Nucleic Acids Research. 2012 doi: 10.1093/nar/gks374. [DOI] [PMC free article] [PubMed] [Google Scholar]
- 31.Kohen R, Yamamoto Y, Cundy KC, Ames BN. Antioxidant activity of carnosine, homocarnosine, and anserine present in muscle and brain. Proceedings of the National Academy of Sciences of the United States of America. 1988;85(9):3175–3179. doi: 10.1073/pnas.85.9.3175. [DOI] [PMC free article] [PubMed] [Google Scholar]
- 32.Dunnett M, Harris RC, Soliman MZ, Suwar AAS. Carnosine, anserine and taurine contents in individual fibres from the middle gluteal muscle of the camel. Research in Veterinary Science. 1997;62(3):213–216. doi: 10.1016/s0034-5288(97)90192-2. [DOI] [PubMed] [Google Scholar]
- 33.Brault JJ, Terjung RL. Purine salvage to adenine nucleotides in different skeletal muscle fiber types. Journal of Applied Physiology. 2001;91(1):231–238. doi: 10.1152/jappl.2001.91.1.231. [DOI] [PubMed] [Google Scholar]
- 34.Kushmerick MJ, Moerland TS, Wiseman RW. Mammalian skeletal muscle fibers distinguished by contents of phosphocreatine, ATP, and Pi. Proceedings of the National Academy of Sciences of the United States of America. 1992;89(16):7521–7525. doi: 10.1073/pnas.89.16.7521. [DOI] [PMC free article] [PubMed] [Google Scholar]
- 35.Van Der Vusse GJ, Reneman RS. Comprehensive Physiology. John Wiley & Sons, Inc.; Lipid metabolism in muscle. p. 2010. [Google Scholar]
- 36.Janovská A, Hatzinikolas G, Mano M, Wittert GA. The effect of dietary fat content on phospholipid fatty acid profile is muscle fiber type dependent. 2010;298:E779–E786. doi: 10.1152/ajpendo.00356.2009. [DOI] [PubMed] [Google Scholar]
- 37.Blackard W, Li J, Clore J, Rizzo W. Phospholipid fatty acid composition in type I and type II rat muscle. Lipids. 1997;32(2):193–198. doi: 10.1007/s11745-997-0024-1. [DOI] [PubMed] [Google Scholar]
- 38.Bonen A, Luiken JJFP, Liu S, Dyck DJ, Kiens B, Kristiansen S, Turcotte LP, Van Der Vusse GJ, Glatz JFC. Palmitate transport and fatty acid transporters in red and white muscles. American Journal of Physiology - Endocrinology and Metabolism. 1998;275(3):E471–E478. doi: 10.1152/ajpendo.1998.275.3.E471. [DOI] [PubMed] [Google Scholar]
- 39.Bakker AJ, Berg HM. Effect of taurine on sarcoplasmic reticulum function and force in skinned fast-twitch skeletal muscle fibres of the rat. The Journal of Physiology. 2002;538(Pt 1):185–194. doi: 10.1113/jphysiol.2001.012872. [DOI] [PMC free article] [PubMed] [Google Scholar]
- 40.Matsuzaki Y, Miyazaki T, Miyakawa S, Bouscarel B, Ikegami T, Tanaka N. Decreased taurine concentration in skeletal muscles after exercise for various durations. Medicine & Science in Sports & Exercise. 2002;34(5) doi: 10.1097/00005768-200205000-00011. [DOI] [PubMed] [Google Scholar]


