

Abstract
Few studies have yet investigated the possible association between high-density lipoprotein cholesterol (HDL-C) and kidney function in elderly patients with primary hypertension. Accordingly, the aim of the present study was to evaluate the relationship between HDL-C and kidney function in elderly hypertension.
A total of 14,644 elderly hypertensive subjects were enrolled in our cross-sectional study. The patients were categorized based on serum HDL-C level and glomerular filtration rate (GFR) value, respectively. One-way analysis of variance was used to compare the parameters among different groups. Bonferroni correction was performed for multiple comparisons. Analysis of covariance was used to control for confounding factors. The significance of difference between 3 groups and more was determined by chi-square test for categorical variables.
Serum creatinine and uric acid were negatively related to HDL-C level, whereas GFR was positively related to HDL-C level in elderly hypertensive patients according to tertiles of HDL-C and tertiles of HDL-C/total cholesterol ratio (all P for trends <0.05). The male elderly hypertensive patients showed stronger relationship between HDL-C and renal function than the female elderly hypertensive subjects. Low HDL-C was associated with renal insufficiency and proteinuria in the hypertensive elderly (P < 0.05). The elderly “renal-hyperfiltrator” appeared to have lower HDL-C level, compared with the “normal renal-filtrator” (P < 0.05). There was an inverse “V” shape between HDL-C and GFR by GFR strata.
Our results point out that there is an association of low HDL-C level with impaired kidney function in elderly hypertensive patients. Glomerular hyperfiltration may also affect HDL-C level and sex might be an influential factor for the association of HDL-C with kidney function in elderly hypertension.
INTRODUCTION
The elderly population is susceptible to dyslipidemia of aging and renal dysfunction. Lipid abnormalities may lead to the progression of chronic kidney disease (CKD).1 Emerging evidence showed the cardiovascular risk profile in the elderly is different from that in young people.2,3 The increased risk of cardiovascular disease associated with high serum cholesterol in young men and middle-aged adults has been clearly established.4 But the prospective studies have revealed controversial results about relationship of total serum cholesterol level with cardiovascular outcomes and kidney disease progression in the elderly.5–7 Further investigation into the association of dyslipidemia with renal disease progression in aging population has been needed. High-density lipoprotein cholesterol (HDL-C) benefits kidney function and cardiovascular system by extracting tissue cholesterol. The general population-based studies showed that HDL-C level was associated with kidney function and the association between them gradually strengthened as estimated glomerular filtration rate (GFR) declined.8,9 But it seems that renal function status, in turn, impacts the level and function of HDL-C. The HDL-C in patients with end-stage renal disease (ESRD) on hemodialysis is dysfunctional and dramatically less effective in accepting cholesterol from macrophages.10 Both clinical and laboratory studies have revealed that ESRD decreased the levels of apolipoprotein A-I (ApoA-I) and HDL-C as well as altered HDL composition.11,12 A very recent study demonstrated that even mild renal dysfunction was also tied to low HDL-C level. In our previous study, we found that the hypertensive elderly had higher prevalence of dyslipidemia and renal dysfunction.13 Thus, the present study was initiated to test the association of HDL-C with kidney function in elderly hypertensive subjects.
METHODS
The study protocol was approved by the medical ethics committee of the Third Xiang-Ya Hospital. All of the subjects enrolled in this study gave informed consent to participate in this study.
Study Subjects
There were 31,941 Chinese people aged >60 years who participated in annual physical examination in Health Management Center of the Third Xiang-Ya Hospital in Hunan Province between January 1, 2008 and December 31, 2010. In this study, inclusion criteria were age >60 years and hypertension. Exclusion criteria included: no available data on blood pressure (BP) value, glucose concentration, cholesterol level, blood urea nitrogen (BUN) level, uric acid (UA) level, serum creatinine (Scr) level, urine analysis, body weight, or height; diabetes; obesity; immune diseases; malignant diseases; use of lipid-lowering agents; history of primary renal diseases; renal artery stenosis; and duplicate cases. After the subjects with incomplete data were removed and duplicate cases were deleted, there were 28,258 people left. The 19,276 subjects were diagnosed to have hypertension among 28,258 people. After we removed the patients with diabetes, obesity, immune diseases, malignant diseases, primary renal diseases, or renal artery stenosis and we excluded the patients who took lipid-lowering agents 14,644 elderly hypertensive subjects were finally screened and eligible for this study. Hypertension was defined according to the Joint National Committee (JNC) 7 report.14 People who had previously received a diagnosis of hypertension were also considered to have hypertension, although they had normal BP after taking antihypertensive drugs. Diabetes was diagnosed by either fasting blood glucose ≥7.0 mmol/L, or casual blood glucose ≥11.1 mmol/L.15 Patients who had a previous diagnosis of diabetes were also considered to have diabetes, although they had normal blood glucose concentration after treatment. The presence of obesity was defined by body mass index (BMI) of 30 kg/m2 or more.16 The data for all subjects were obtained from annual physical examination database at the data center of the Health Management Center in the Third Xiang-Ya Hospital.
Measurements and Renal Function Estimates
The examination was carried out during outpatient visit including an interview to determine the history of hypertension, diabetes, hyperlipidemia, usage of medicine agents, and so on. After fasting overnight, BP was measured with an appropriately sized cuff and a mercury column sphygmomanometer in the sitting posture after a 10-min rest. Height and body weight were measured, and BMI was calculated as body weight divided by square of height. Venous blood sampling from all of the subjects was performed. Serum glucose, total cholesterol (TC), HDL-C, low-density lipoprotein cholesterol (LDL-C), triglyceride (TG), BUN, Scr, and UA levels were determined using standard laboratory methods. Qualitative analysis of urinary protein was measured by sulfosalicylic acid method. GFR was estimated using the equations of simplified modification of diet in renal disease (MDRD)17 and chronic kidney disease epidemiology collaboration (CKD-EPI).18 The GFRMDRD was calculated as 186 × Scr−1.154 × Age−0.203 (×0.742 if female). The GFRCKD-EPI was calculated as recommended: for women with a Scr ≤0.7, 144 × (Scr/0.7)−0.329 × 0.993age; for women with a Scr >0.7, 144 × (Scr/0.7)−1.209 × 0.993age; for men with a Scr ≤0.9, 141 × (Scr/0.9)−0.411 × 0.993age; for men with a Scr >0.9, 141 × (Scr/0.9)−1.209 × 0.993age.
Protocol
The 14,644 elderly hypertensive subjects were first divided into 3 groups according to serum HDL-C and HDL-C/TC ratio, respectively. Then all the patients were categorized into 6 groups according to GFRMDRD value and categorized into 5 groups based on GFRCKD-EPI value. The values of BMI, BP, TC, TG, HDL-C, LDL-C, glucose concentration, GFR, Scr, UA and BUN, prevalence of renal insufficiency and proteinuria prevalence were compared among different groups.
Statistical Analysis
Continuous variables were expressed as mean ± standard deviation (SD) and categorical variables were presented as percentage unless otherwise stated. One-way analysis of variance was used to compare difference of means of continuous variables among 3 groups or more. Bonferroni correction was performed for multiple comparisons. Analysis of covariance (ANCOVA) was used to control for confounding factors. The significance of difference between 3 groups and more was determined by chi-square test for categorical variables. P value <0.05 was considered to be statistically significant. Analysis was performed in statistical software package SPSS16.0 (SPSS Inc, Chicago, IL) for Windows.
RESULTS
Summary of Study Subjects
The clinical and laboratory characteristics of study subjects were shown in Table 1. Overall, 14,644 subjects with 67% male and at age of 70 ± 6 years were studied. Isolated systolic hypertension predominated among the hypertensive elderly. The HDL-C to TC ratio was 0.3 ± 0.1. Estimated GFR by MDRD formula was higher than that calculated by CKD-EPI equation (P < 0.01). GFRMDRD was strongly correlated with GFRCKD-EPI (r = 0.92, P < 0.01).
TABLE 1.
Clinical and Laboratory Characteristics of Subjects

Renal Function According to Tertiles of HDL-C
The parameters of 3 groups according to tertiles of serum HDL-C level were demonstrated in Table 2. The subjects were younger in tertile 1 and tertile 2 than that in tertile 3. The females had higher HDL-C level, whereas males had lower HDL-C level. As HDL-C level elevated from tertile 1 to tertile 3, TC level increased, but TG and BMI levels decreased. The LDL-C level was highest in tertile 2 and lowest in tertile 1. Compared with tertile 2 and tertile 3, tertile 1 had higher glucose level. The systolic blood pressure (SBP), diastolic blood pressure (DBP), and pulse pressure (PP) were not different among 3 groups. The GFR, Scr, and UA values among 3 groups were presented in Figure 1. The Scr and UA levels were highest in tertile 1 and lowest in tertile 3, whereas the GFRMDRD and GFRCKD-EPI values were lowest in tertile 1 and highest in tertile 3. There was no difference in BUN level among 3 groups (P = 0.06, data not shown). The prevalence of renal insufficiency and proteinuria prevalence were lower in tertile 2 and tertile 3, compared with that in tertile 1 (P < 0.05, Figures 2A and 3A). Since sex was an influential factor for lipid and kidney function, we further categorized tertiles of HDL-C into female and male groups. We performed ANCOVA using age, BMI, TC, TG, LDL-C, and glucose concentration as confounding factors to explore the effect of HDL-C on kidney function (data shown in Table 3). As HDL-C level increased from tertile 1 to tertile 3, Scr and UA levels decreased while GFR value increased for male subjects. There was no difference in BUN, Scr and GFR values for female subjects among tertiles of HDL-C.
TABLE 2.
Parameters Among 3 Groups According to High-density Lipoprotein Cholesterol Level

FIGURE 1.

GFRMDRD, GFRCKD-EPI, Scr, and UA levels according to tertiles of HDL-C. Range 1, 2, and 3 of HDL-C in increasing tertiles were <1, 1–2, >2 mmol/L, respectively. The vertical bars represent 95% confidence interval for mean. All P for trends <0.05. CKD-EPI = chronic kidney disease epidemiology collaboration, GFR = glomerular filtration rate, HDL-C = high-density lipoprotein cholesterol, MDRD = simplified modification of diet in renal disease, Scr = Serum creatinine, UA = uric acid. n = 2241 for tertile 1, 11783 for tertile 2, and 620 for tertile 3.
TABLE 3.
Kidney Function Among Tertiles of High-density Lipoprotein Cholesterol in Male and Female Subjects

FIGURE 2.
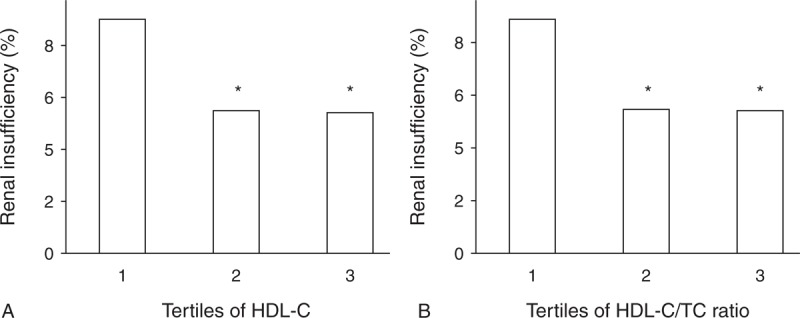
(A) Prevalence of renal insufficiency according to tertiles of HDL-C. Range 1, 2 and 3 of HDL-C in increasing tertiles of HDL-C were <1, 1–2, >2 mmol/L, respectively. (B) Prevalence of renal insufficiency according to tertiles of HDL-C/TC Ratio. Range 1, 2, and 3 of HDL-C/TC ratio in increasing tertiles of HDL-C/TC ratio were <0.2, 0.2–0.4, >0.4, respectively. Renal insufficiency was defined as GFR <60 mL/min/1.73m2 by MDRD equation. ∗P < 0.05 vs tertile 1. HDL-C = high-density lipoprotein cholesterol, MDRD = simplified modification of diet in renal disease, TC = total cholesterol. n = 2241 for tertile 1, 11783 for tertile 2 and 620 for tertile 3 according to HDL-C level, n = 2458 for tertile 1, 11418 for tertile 2, and 768 for tertile 3 according to HDL-C/TC Ratio.
FIGURE 3.
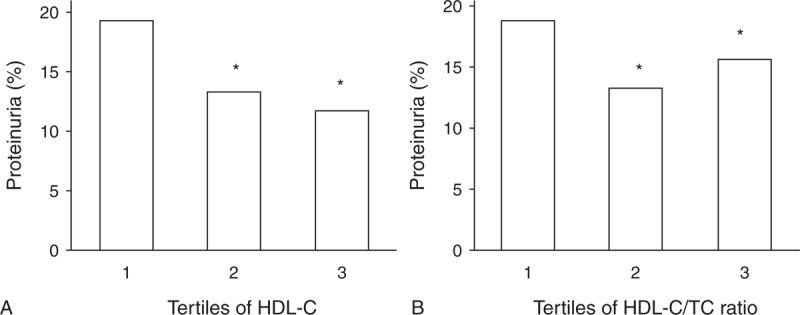
(A) Proteinuria prevalence according to tertiles of HDL-C. Range 1, 2, and 3 of HDL-C in increasing tertiles of HDL-C were <1, 1–2, >2 mmol/L, respectively. (B) Proteinuria prevalence according to tertiles of HDL-C/TC Ratio. Range 1, 2, and 3 of HDL-C/TC ratio in increasing tertiles of HDL-C/TC ratio were <0.2, 0.2–0.4, >0.4, respectively. ∗P < 0.01 vs tertile 1. HDL-C = high-density lipoprotein cholesterol, TC = total cholesterol. n = 2241 for tertile 1, 11783 for tertile 2 and 620 for tertile 3 according to HDL-C level, n = 2458 for tertile 1, 11418 for tertile 2, and 768 for tertile 3 according to HDL-C/TC Ratio.
Renal Function According to Tertiles of HDL-C/TC Ratio
The GFR, Scr, and UA values among 3 groups according to HDL-C/TC ratio were presented in Figure 4. As HDL-C/TC ratio increased from tertile 1 to tertile 3, GFRMDRD increased and UA level decreased. But tertile 2 had highest GFRCKD-EPI and lowest Scr level. There was no significant difference in BUN level among 3 groups (P = 0.052, data not shown). The prevalence of renal insufficiency and proteinuria prevalence were lower in tertile 2 and tertile 3, compared with that in tertile 1 (P < 0.05, Figures 2B and 3B). The BUN, Scr, UA, and GFR values of male and female subjects from tertile 1 to tertile 3 were presented in Table 4. As HDL-C/TC ratio increased from tertile 1 to tertile 3, the Scr and UA levels decreased, but GFR value increased for male subjects. For female subjects, UA level gradually decreased from tertile 1 to tertile 3, but Scr, GFR, and BUN values did not change among different tertiles.
FIGURE 4.

GFRMDRD, GFRCKD-EPI, Scr, and UA levels according to tertiles of HDL-C/TC Ratio. Range 1, 2, and 3 of HDL-C/TC ratio in increasing tertiles were <0.2, 0.2–0.4, >0.4, respectively. The vertical bars represent 95% confidence interval for mean. All P for trends <0.05. CKD-EPI = chronic kidney disease epidemiology collaboration, GFR = glomerular filtration rate, HDL-C = high-density lipoprotein cholesterol, MDRD = simplified modification of diet in renal disease, Scr = Serum creatinine, TC = total cholesterol, UA = uric acid. n = 2458 for tertile 1, 11418 for tertile 2, and 768 for tertile 3.
TABLE 4.
Kidney Function Among Tertiles of High-density Lipoprotein Cholesterol to Total Cholesterol Ratio in Male and Female Subjects

HDL-C Levels in Different GFR Strata
According to MDRD formula, GFR increased from sextile 1 to sextile 5 (all P for the trends < 0.05, Figure 5) and then eGFR decreased from sextile 5 to sextile 6 (P < 0.05, Figure 5). The GFRCKD-EPI increased from quintile 1 to quintile 4 (all P for the trends <0.05, Figure 5) and then GFRCKD-EPI decreased from quintile 4 to quintile 5 (P < 0.05, Figure 5). The inverse “V” shape was observed between GFR and HDL-C (Figure 5). Either MDRD formula or CKD-EPI equation was used to calculate GFR.
FIGURE 5.

Inverse “V” shape between GFR and HDL-C. Range 1, 2, 3, 4, 5, and 6 of GFRMDRD in increasing sextiles of GFRMDRD were <30, 30–60, 60–90, 90–120, 120–140, >140 mL/min/1.73m2, respectively. Range 1, 2, 3, 4, and 5 of GFRCKD-EPI in increasing quintiles of GFRCKD-EPI were <30, 30–60, 60–90, 90–120, >120 mL/min/1.73m2, respectively. All P for trends <0.05. CKD-EPI = chronic kidney disease epidemiology collaboration, GFR = glomerular filtration rate, HDL-C = high-density lipoprotein cholesterol, MDRD = simplified modification of diet in renal disease. n = 79 for sextile 1, 807 for sextile 2, 7166 for sextile 3, 5831 for sextile 4, 602 for sextile 5, and 159 for sextile 6 according to GFRMDRD, n = 90 for quintile1, 1073 for quintile 2, 8763 for quintile 3, 4629 for quintile 4, and 89 for quintile 5 according to GFRCKD-EPI.
DISCUSSION
To date, there is a paucity of studies, which are primarily aimed to determine the association of serum HDL-C level with renal function in elderly hypertensive patients. Our population-based study has demonstrated complex relationship between HDL-C and kidney function in elderly hypertension. Our results agree with some data previously reported by several studies. The general population-based studies showed HDL-C was associated with kidney function and the association gradually strengthened as GFR value declined.8 A longitudinal follow-up study revealed that HDL-C level was the only lipid parameter that affected the progression of CKD independently of the presence of diabetes and that low HDL-C levels were associated with earlier entry in dialysis or doubling of the Scr level.19 Serum cholesterol efflux mediated by scavenger receptor class B member 1 (SR-B1) was significantly reduced in CKD patients with low HDL-C levels and then HDL functionality is also impaired in renal dysfunction.19 Some studies showed that a decrease in HDL-C or ApoA-I levels is observed in renal dysfunctional individuals and may be associated with the downregulation of ApoA-I synthesis in the liver.20–24 Our study supports that Scr and UA are negatively related to HDL-C level, whereas GFR is positively related to HDL-C level in elderly hypertensive patients according to tertiles of HDL-C. The male elderly hypertensive patients show stronger relationship between HDL-C and renal function than the female elderly hypertensive subjects. Low HDL-C is associated with renal insufficiency and proteinuria in the elderly. However, the elderly patients with too high GFR (GFRMDRD >140 mL/min/1.73m2 or GFRCKD-EPI >120 mL/min/1.73m2) have significantly decreased HDL-C levels by both GFRMDRD and GFRCKD-EPI strata in current study. Our results also show there is an inverse “V” relationship between GFR and HDL-C according to GFR strata in elderly hypertensive population. It reveals that glomerular hyperfiltration might reduce HDL-C level in the elderly, which has been proposed in young healthy men.25
Glomerular hyperfiltration is a phenomenon that occurs in various clinical conditions including hypertension and kidney diseases. To date, there is no exact definition of glomerular hyperfiltration. A very recent review revealed that 88.4% of studies involving glomerular hyperfiltration threshold used a single threshold and 11.6% of them used numerous thresholds to define glomerular hyperfiltration.26 The glomerular hyperfiltration threshold ranged from 90.7 to 175 mL/min/1.73 m2. The pathophysiological process of glomerular hyperfiltration, which may vary with the underlying diseases, has not been well explored. Glomerular hyperfiltration might be both a cause and a consequence of renal injury. Renal hyperfiltration has been reported in subjects with obesity and metabolic syndrome.25,27–30 The “hyperfiltrators” in a general population at age ranging from 40 to 72 years were actually at elevated cardiovascular risk. Glomerular hyperfiltration independently predicted the combined outcomes of total death and cardiovascular events at roughly a 3-fold relative risk, irrespective of estimating GFR by the CKD-EPI formula or the MDRD equation.31 The “hyperfiltrators” had higher plasma atherogenic index (TG/HDL-C ratio), but lower HDL-C and UA levels, compared with the “nonhyperfiltrators”.31 In this study, although sextile 6 (GFRMDRD >140 mL/min/1.73m2) and quintile 5 (GFRCKD-EPI >120 mL/min/1.73m2) had higher GFR values, their HDL-C levels significantly decreased. It is well known that hypertensive patients usually have high blood volume and enhanced vasoconstriction both of which lead to increased glomerular pressure.32 Increased glomerular pressure may predict an early manifestation of hypertension and directly contribute to the progression of CKD.33 In experimental studies, glomerular hypertension has been shown to mediate progressive kidney damage following a variety of initiating injuries.34–36 However, the pathophysiological mechanism of low HDL-C associated with glomerular hyperfiltration has not been well explored currently, although lower HDL-C level was observed in “hyperfiltrators” based on some studies. The involved mechanism remains to be elucidated in future studies to develop new therapeutic strategies.
The current study has several advantages. The larger number of elderly hypertensive population makes the results more reliable and replicable. MDRD equation was developed for estimating kidney function of subject with GFR >60 mL/min/1.73m2. Compared with MDRD equation, CKD-EPI formula was aimed to evaluate higher GFR.17,18 In our study, we used both of them to estimate GFR due to their accuracy in different ranges of GFR. It is shown that kidney function is influenced by diabetes and obesity. Therefore, this study excluded the patients with diabetes and obesity. To minimize the number of confounding factors, we also excluded the subjects who took lipid-lowering agents.
Our study also has some limitations. The primary limitation of this study is that cross-sectional data do not allow us to observe the impact of risk factors over time and distinguish between reason and consequence. Another limitation is that we do not have the information on how long hypertension and low HDL-C statuses last. The older subjects are likely to have longer history of risk factors, which may influence the association of HDL-C with kidney function. In addition, the information on some chronic diseases such as recent infection and chronic inflammatory diseases was not inquired and recorded in current study. Recent infection and chronic inflammatory diseases as confounding factors may influence HDL-C level and renal function. Those chronic disease states should be excluded in the future further study. Finally, our study used eGFR rather than directly measured GFR. But direct measurement of GFR is rarely used in clinical practice. Given those limitations, further longitudinal cohort studies are needed to observe and analyze the causative relationship of HDL-C and renal function in the hypertensive elderly.
In summary, our results support the possibility that low HDL-C level is associated with renal function decline in elderly hypertension. Sex may be a pivotal factor for the association of HDL-C level with GFR value. Glomerular hyperfiltration (GFRMDRD >140 mL/min/1.73m2 or GFRCKD-EPI >120 mL/min/1.73m2) may also affect serum HDL-C level. There is an inverse “V” shape between GFR and HDL-C based on GFR stratification in elderly hypertension.
Acknowledgments
The authors would like to thank Dr. Chris Rhodes for his critical reading and suggestions about English expression.
Footnotes
Abbreviations: ApoA-I = apolipoprotein A-I, BMI = body mass index, BP = blood pressure, BUN = blood urea nitrogen, CKD = chronic kidney disease, CKD-EPI = chronic kidney disease epidemiology collaboration, DBP = diastolic blood pressure, ESRD = end-stage renal disease, GFR = glomerular filtration rate, HDL-C = high-density lipoprotein cholesterol, JNC = Joint National Committee, LDL-C = low-density lipoprotein cholesterol, MDRD = simplified modification of diet in renal disease, PP = pulse pressure, SBP = systolic blood pressure, Scr = Serum creatinine, SD = standard deviation, SR-B1 = scavenger receptor class B member 1, TC = total cholesterol, TG = triglyceride, UA = uric acid.
This study is financially supported by the National Natural Science Foundation of China (No.81273594, No.81470535, No.81371443), the National Science and Technology Major Projects for “Major New Drugs Innovation and Development” (No.2012ZX09303014001), the National Key Technology R&D Program (No.2012BAI37B05) and Beijing Natural Science Foundation (No.7152045).
The authors have no funding or conflicts of interest to disclose.
REFERENCES
- 1.Morita Y, Homma Y, Igarashi M, et al. Decrease in glomerular filtration rate by plasma low-density lipoprotein cholesterol in subjects with normal kidney function assessed by urinalysis and plasma creatinine. Atherosclerosis 2010; 210:602–606. [DOI] [PubMed] [Google Scholar]
- 2.Fried LF, Shlipak MG, Crump C, et al. Renal insufficiency as a predictor of cardiovascular outcomes and mortality in elderly individuals. J Am Coll Cardiol 2003; 41:1364–1372. [DOI] [PubMed] [Google Scholar]
- 3.Manjunath G, Tighiouart H, Coresh J, et al. Level of kidney function as a risk factor for cardiovascular outcomes in the elderly. Kidney Int 2003; 63:1121–1129. [DOI] [PubMed] [Google Scholar]
- 4.Klag MJ, Ford DE, Mead LA, et al. Serum cholesterol in young men and subsequent cardiovascular disease. N Engl J Med 1993; 328:313–318. [DOI] [PubMed] [Google Scholar]
- 5.Ives DG, Bonino P, Traven ND, et al. Morbidity and mortality in rural community-dwelling elderly with low total serum cholesterol. J Gerontol 1993; 48:M103–M107. [DOI] [PubMed] [Google Scholar]
- 6.Kronmal RA, Cain KC, Ye Z, et al. Total serum cholesterol levels and mortality risk as a function of age. A report based on the Framingham data. Arch Intern Med 1993; 153:1065–1073. [PubMed] [Google Scholar]
- 7.Choudhury D, Tuncel M, Levi M. Disorders of lipid metabolism and chronic kidney disease in the elderly. Semin Nephrol 2009; 29:610–620. [DOI] [PMC free article] [PubMed] [Google Scholar]
- 8.Wang F, Zheng J, Ye P, et al. Association of high-density lipoprotein cholesterol with the estimated glomerular filtration rate in a community-based population. PLoS One 2013; 8:e79738. [DOI] [PMC free article] [PubMed] [Google Scholar]
- 9.Odden MC, Tager IB, Gansevoort RT, et al. Hypertension and low HDL cholesterol were associated with reduced kidney function across the age spectrum: a collaborative study. Ann Epidemiol 2013; 23:106–111. [DOI] [PMC free article] [PubMed] [Google Scholar]
- 10.Yamamoto S, Yancey PG, Ikizler TA, et al. Dysfunctional high-density lipoprotein in patients on chronic hemodialysis. J Am Coll Cardiol 2012; 60:2372–2379. [DOI] [PMC free article] [PubMed] [Google Scholar]
- 11.Moradi H, Vaziri ND, Kashyap ML, et al. Role of HDL dysfunction in end-stage renal disease: a double-edged sword. J Ren Nutr 2013; 23:203–206. [DOI] [PMC free article] [PubMed] [Google Scholar]
- 12.Kim JY, Kang HT, Lee HR, et al. Comparison of lipid-related ratios for prediction of chronic kidney disease stage 3 or more in Korean adults. J Korean Med Sci 2012; 27:1524–1529. [DOI] [PMC free article] [PubMed] [Google Scholar]
- 13.Zhang YP, Zuo XC, Huang ZJ, et al. The impact of blood pressure on kidney function in the elderly: a cross-sectional study. Kidney Blood Press Res 2013; 38:205–216. [DOI] [PMC free article] [PubMed] [Google Scholar]
- 14.Lenfant C, Chobanian AV, Jones DW, et al. Seventh report of the Joint National Committee on the Prevention, Detection, Evaluation, and Treatment of High Blood Pressure (JNC 7): resetting the hypertension sails. Hypertension 2003; 41:1178–1179. [DOI] [PubMed] [Google Scholar]
- 15.Diagnosis and classification of diabetes mellitus. Diabetes Care 2012; 35 suppl 1:S64–S71. [DOI] [PMC free article] [PubMed] [Google Scholar]
- 16.Clinical Guidelines on the Identification, Evaluation, and Treatment of Overweight and Obesity in Adults—The Evidence Report. National Institutes of Health. Obes Res 1998; 6 Suppl 2:51S–209S. [PubMed] [Google Scholar]
- 17.Levey AS, Bosch JP, Lewis JB, et al. A more accurate method to estimate glomerular filtration rate from serum creatinine: a new prediction equation. Modification of Diet in Renal Disease Study Group. Ann Intern Med 1999; 130:461–470. [DOI] [PubMed] [Google Scholar]
- 18.Levey AS, Stevens LA, Schmid CH, et al. A new equation to estimate glomerular filtration rate. Ann Intern Med 2009; 150:604–612. [DOI] [PMC free article] [PubMed] [Google Scholar]
- 19.Baragetti A, Norata GD, Sarcina C, et al. High density lipoprotein cholesterol levels are an independent predictor of the progression of chronic kidney disease. J Intern Med 2013; 274:252–262. [DOI] [PubMed] [Google Scholar]
- 20.Lacquaniti A, Bolignano D, Donato V, et al. Alterations of lipid metabolism in chronic nephropathies: mechanisms, diagnosis and treatment. Kidney Blood Press Res 2010; 33:100–110. [DOI] [PubMed] [Google Scholar]
- 21.Vaziri ND, Deng G, Liang K. Hepatic HDL receptor, SR-B1 and Apo A-I expression in chronic renal failure. Nephrol Dial Transplant 1999; 14:1462–1466. [DOI] [PubMed] [Google Scholar]
- 22.Vaziri ND, Navab M, Fogelman AM. HDL metabolism and activity in chronic kidney disease. Nat Rev Nephrol 2010; 6:287–296. [DOI] [PubMed] [Google Scholar]
- 23.Vaziri ND, Moradi H. Mechanisms of dyslipidemia of chronic renal failure. Hemodial Int 2006; 10:1–7. [DOI] [PubMed] [Google Scholar]
- 24.Vaziri ND. Dyslipidemia of chronic renal failure: the nature, mechanisms, and potential consequences. Am J Physiol Renal Physiol 2006; 290:F262–F272. [DOI] [PubMed] [Google Scholar]
- 25.Tomaszewski M, Charchar FJ, Maric C, et al. Glomerular hyperfiltration: a new marker of metabolic risk. Kidney Int 2007; 71:816–821. [DOI] [PubMed] [Google Scholar]
- 26.Cachat F, Combescure C, Cauderay M, et al. A systematic review of glomerular hyperfiltration assessment and definition in the medical literature. Clin J Am Soc Nephrol 2015; 10. [DOI] [PMC free article] [PubMed] [Google Scholar]
- 27.Magee GM, Bilous RW, Cardwell CR, et al. Is hyperfiltration associated with the future risk of developing diabetic nephropathy? A meta-analysis. Diabetologia 2009; 52:691–697. [DOI] [PubMed] [Google Scholar]
- 28.Melsom T, Mathisen UD, Ingebretsen OC, et al. Impaired fasting glucose is associated with renal hyperfiltration in the general population. Diabetes Care 2011; 34:1546–1551. [DOI] [PMC free article] [PubMed] [Google Scholar]
- 29.Wuerzner G, Pruijm M, Maillard M, et al. Marked association between obesity and glomerular hyperfiltration: a cross-sectional study in an African population. Am J Kidney Dis 2010; 56:303–312. [DOI] [PubMed] [Google Scholar]
- 30.Pruijm M, Wuerzner G, Maillard M, et al. Glomerular hyperfiltration and increased proximal sodium reabsorption in subjects with type 2 diabetes or impaired fasting glucose in a population of the African region. Nephrol Dial Transplant 2010; 25:2225–2231. [DOI] [PubMed] [Google Scholar]
- 31.Altay S, Onat A, Ozpamuk-Karadeniz F, et al. Renal “hyperfiltrators” are at elevated risk of death and chronic diseases. BMC Nephrol 2014; 15:160. [DOI] [PMC free article] [PubMed] [Google Scholar]
- 32.Anderson S, Rennke HG, Brenner BM. Antihypertensive therapy must control glomerular hypertension to limit glomerular injury. J Hypertens Suppl 1986; 4:S242–S244. [PubMed] [Google Scholar]
- 33.Helal I, Fick-Brosnahan GM, Reed-Gitomer B, et al. Glomerular hyperfiltration: definitions, mechanisms and clinical implications. Nat Rev Nephrol 2012; 8:293–300. [DOI] [PubMed] [Google Scholar]
- 34.Anderson S, Brenner BM. The role of intraglomerular pressure in the initiation and progression of renal disease. J Hypertens Suppl 1986; 4:S236–S238. [PubMed] [Google Scholar]
- 35.Neuringer JR, Brenner BM. Glomerular hypertension: cause and consequence of renal injury. J Hypertens Suppl 1992; 10:S91–S97. [PubMed] [Google Scholar]
- 36.Neuringer JR, Brenner BM. Hemodynamic theory of progressive renal disease: a 10-year update in brief review. Am J Kidney Dis 1993; 22:98–104. [DOI] [PubMed] [Google Scholar]