Abstract
The search for biomarkers of hypertension and diabetes-induced damage to multiple target organs is a priority. We analyzed the correlation between plasma cardiotrophin-1 (CT-1), a chemokine that participates in cardiovascular remodeling and organ fibrosis, and a wide range of parameters currently used to diagnose morphological and functional progressive injury in left ventricle, arteries, and kidneys of diabetic and hypertensive patients, in order to validate plasma levels of CT-1 as clinical biomarker.
This is an observational study with 93 type 2-diabetic patients, 209 hypertensive patients, and 82 healthy controls in which we assessed the following parameters: plasma CT-1, basal glycaemia, systolic blood pressure (SBP), diastolic blood pressure (DBP), pulse pressure (PP), left ventricular hypertrophy (LVH by electrocardiographic indexes), peripheral vascular disease (by pulse wave velocity—PWV, carotid intima-media thickness—C-IMT, and ankle-brachial index—ABI), and renal impairment (by microalbuminuria, albumin/creatinine urinary ratio, plasma creatinine concentrations, and glomerular filtration rate).
Hypertensive or diabetic patients have higher plasma CT-1 than control patients. CT-1 positively correlates with basal glycaemia, SBP, DBP, PP, LVH, arterial damage (increased IMT, decreased ABI), and early renal damage (microalbuminuria, elevated albumin/creatinine ratio). CT-1 also correlates with increased 10-year cardiovascular risk. Multiple linear regression analysis confirmed that CT-1 was associated with arterial injury assessed by PWV, IMT, ABI, and cardiac damage evaluated by Cornell voltage duration product.
Increases in plasma CT-1 are strongly related to the intensity of several parameters associated to target organ damage supporting further investigation of its diagnostic capacity as single biomarker of cardiovascular injury and risk and, possibly, of subclinical renal damage.
INTRODUCTION
Type 2-diabetes mellitus (DM) and hypertension (HT) cause cardiovascular alterations whose deleterious effects increase when both conditions appear together.1 At present, cardiovascular diseases are the main cause for disability and death worldwide.2,3 Vascular damage affect both large and small vessels. Small vessels damage is characteristic of disorders such as retinopathy, nephropathy, neuropathy, and ischemic cardiopathy. The main damage in large vessels is atherosclerosis which in the heart vessels increases the risk of myocardial infarction.4 Many established cardiovascular risk factors such as HT, diabetes, and smoking have been found to increase arterial stiffness.5,6 In turn, increased arterial stiffness is an important risk factor directly correlated with cardiovascular morbidity and mortality.7 The association between HT and/or DM with other cardiovascular risk factors (eg, obesity, dyslipidemia) accelerates these pathophysiological processes.8 In addition, the presence of pathologic left ventricular hypertrophy (LVH), induced either as a compensatory mechanism to the elevated blood pressure (BP) or not, increases 5 to 10 times the cardiovascular risk and mortality.9 Thus, the assessment of cardiovascular risk in patients with DM and/or HT includes a wide set of determinations of functional damage in the heart, vessels, and other organs affected such as kidneys.
Cardiotrophin-1 (CT-1) is a 21.5 kDa protein, member of the interleukin-6 family, which potently induces cardiac myocyte hypertrophy in vitro.10 CT-1 is expressed in several organs such as heart, lung, and skeletal muscle in adult humans.11 Experimental models further demonstrated that CT-1 participates in remodeling of heart and vessels after an injury by stimulating cell proliferation and extracellular matrix production, leading to cardiovascular hypertrophy and fibrosis.12,13 CT-1 is also involved in arterial fibrosis and increased stiffness associated to aging, as in CT-1-null mice the absence of CT-1 is associated with decreased arterial fibrosis, stiffness, and senescence and increased longevity.14 CT-1 has been consistently related with LVH, either experimental or clinical.15–19 CT-1 has been also associated with LVH in patients with chronic renal failure,20 but the relationship of CT-1 with renal injury in patients has never been studied. However, the appearance of renal fibrosis in rats treated with CT-1 has been described.21 In addition, accordingly with the role of CT-1 as multifunctional cytokine, several authors reported its participation in the regulation of glucose and lipid metabolism.22–25
It has been already described that plasma CT-1 concentration was higher in HT than in normotensive patients.17,26–28 Moreover, it has been recently shown a correlation between CT-1 and BP in essential HT29 and between CT-1 and the presence of DM in a Chinese population with impaired glucose tolerance.30,31 However, there are no clinical studies on the possible usefulness of CT-1 as a putative marker of integrative target organ damage and cardiovascular risk induced by HT and DM. Thus, the aim of this study is to assess the levels of plasma CT-1 in DM and HT patients, as well as to analyze the relationship between CT-1 and damage in target organs (heart, vasculature, and kidney), in order to strengthen the possible role of CT-1 as biomarker establishing correlations between the CT-1 plasma levels with a wide range of clinical determinants used in diagnosis of cardiovascular injury and integrated cardiovascular risk in a population of HT, DM, and control patients.
METHODS
This is a crosssectional study performed in hypertensive and diabetic patients of the Primary Care Research Unit of “La Alamedilla” Health Centre, Salamanca (Spain), covering a population of 46,000 inhabitants. We have recruited 384 consecutive patients: 209 hypertensive nondiabetic patients (HT group), 93 type-2 diabetic patients (DM group, 71 of them with HT), and 82 control patients (Control group). Exclusion criteria are as follows: participation in a clinical trial, serious comorbidities, or inability to comply with the protocol requirement (psychological and/or cognitive disorders, failure to cooperate, educational limitations and problems in understanding written language, and failure to sign the informed consent document). Normotensive and normoglycaemic patients keeping the above-described exclusion criteria and without detectable renal and cardiovascular alterations were selected as controls.
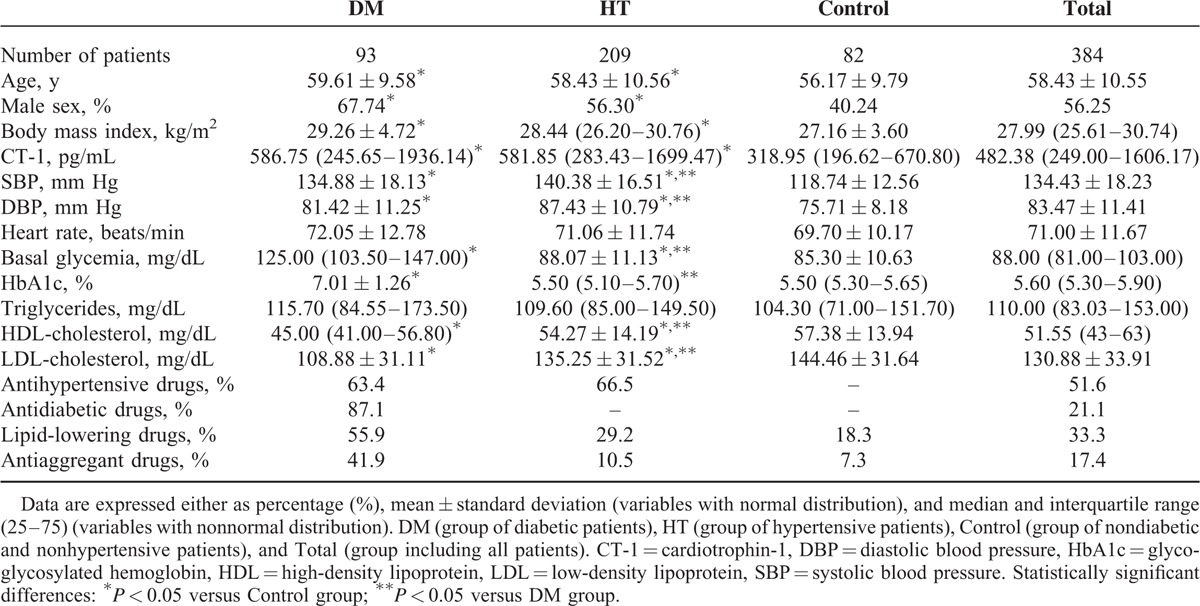
HT was diagnosed when the mean of 3 separate BP measurements was ≥140 mm Hg for systolic blood pressure (SBP) and/or ≥90 mm Hg for diastolic blood pressure (DBP).4 DM was diagnosed following 2 criteria: when plasma glucose reached ≥126 mg/dL after fasting or ≥200 mg/dL 2 hours after oral glucose load (and repeated twice), and after detecting symptoms of DM along with a random value of plasma glucose ≥200 mg/dL.30 Most patients received pharmacotherapy, except those controlled by diet (Table 1).
TABLE 1.
Demographic, Physical, Basic Analytical Values, and Pharmacotherapies in the Patients Included in the Study
Ethical and Legal Issues
The experimental protocol was in accordance with the Declaration of Helsinki (2008) of the World Medical Association, approved by the University Hospital of Salamanca Ethics Committee and complied with Spanish data protection law (LO 15/1999) and specifications (RD 1720/2007). A written consent was signed by all who accepted to participate in the study.
Socio-Demographic and Cardiovascular Variables
We determined patient age and sex, BP, lipidemia, alcohol consumption, smoking, physical activity, and presence of premature cardiovascular disease (before 55 years of age in men and before 65 in women) in first-degree relatives. We also determined the occurrence of the following events, which were exclusion criteria: myocardial infarction, angina, revascularization, heart failure, atrial fibrillation, cerebrovascular events (ischemic stroke, intracranial hemorrhage, and transient brain ischemia), and symptomatic peripheral arterial disease.
Body weight was determined using a homologated electronic scale (Seca 70, Hamburg, Germany; precision ± 0.1 kg), height was measured with a portable system (Seca 222), and body mass index (kg/m2) was calculated.
Plasma and Urine Determinations
Samples of urine and blood were collected in the morning after fasting for at least 8 hours. Creatinine, basal glucose, glycosylated hemoglobin, triglycerides, high-density lipoprotein (HDL)-cholesterol, low-density lipoprotein (LDL)-cholesterol in plasma, and creatinine and microalbumin in urine were determined using standard automatized techniques on a blind basis in the Biochemistry laboratory of the University Hospital, Salamanca (Spain).
Plasma CT-1 Determination
CT-1 concentration in plasma was measured using an enzyme-linked inmunosorbent assay method (Abcam, Cambridge, UK) following the instructions of the manufacturer. With regard to specificity, the assay recognized human CT-1 without significant crossreactivity or interference with other cytokines. With regard to sensitivity, the detectable concentration ranged from 16 to 12,000 pg/mL. Inter- and intraassay reproducibility were 12% and 10%, respectively. Samples were measured in triplicate. Absorbance (proportional to the initial amount of CT-1) was determined using a spectrophotometer ELx800 Universal Microplates Reader (Bio-Tek Instruments Inc, VT) at 450 nm with a wavelength correction of 540 nm.
Blood Pressure Determination
Office BP evaluation involved 3 measurements of SBP and DBP with a validated OMRON model M7 sphygmomanometer (Omron Health Care, Kyoto, Japan) following the recommendations of the European Society of Hypertension (ESH).4 SBP, DBP, and pulse pressure (PP) were calculated with the mean values of the second and third measurements.
Determination of the Ankle-Brachial Index
Ankle-brachial index (ABI) was measured in patients 12 hours after abstaining from smoking and drinking beverages containing caffeine or alcohol. Patients were placed in a supine decubitus position at a room temperature between 22°C and 24°C. After resting for 20 minutes, pressure in the lower extremities was measured using a portable Doppler system Minidop Es-100Vx (Hadeco Inc, Miyamae-ku Kawasaki, Japan) applying the probe at the anterior or posterior tibial artery at an angle of approximately 60° to blood flow direction. BP was also measured twice at 3- to 5-minute intervals in both arms using the same procedure. ABI was calculated as previously described.32 Subclinical artery disease was diagnosed if ABI was <0.9.33
Determination of Pulse Wave Velocity
Pulse wave velocity (PWV) was evaluated with the SphygmoCor System (AtCor Medical Pty Ltd, Head Office, West Ryde, Australia). The pulse waves of the carotid and femoral arteries were analyzed with the patient in the supine position measuring the delay with respect to the electrocardiographic wave, and then calculating PWV. Distance measurements were taken with a measuring tape from the sternal notch to the carotid and femoral arteries at the sensor location.
Assessment of the Carotid Intima-Media Thickness
Carotid intima-media thickness (C-IMT) was assessed by carotid ultrasound analysis that was performed by 2 investigators trained for this purpose with a Micromaxx ultrasound device (SonoSite Inc, Bothell, WA) paired with a 5 to 10 MHz multifrequency high-resolution linear transducer with Sonocal software. The recordings reliability was evaluated using the intraclass correlation coefficient which showed values of 0.897 (95% confidence interval [CI]: 0.740–0.959) for interobserver agreement and 0.974 (95% CI: 0.935–0.990) for intraobserver agreement on repeated measurements in 20 patients. According to the Bland–Altman analysis, the limit of interobserver agreement was 0.022 (95% CI: −0.053 to 0.098) and the limit of intraobserver agreement was 0.012 (95% CI: −0.034 to 0.059). Measurements were carried out in several points of a longitudinal section of 10 mm of the common carotid at 1 cm of distance from the bifurcation, performing the analysis in the proximal and in the distal wall in the lateral, anterior, and posterior projections, and following a perpendicular axis in order to discriminate 2 lines: one for the intima-blood interface and the other for the media-adventitious interface.34 We used the medium value (medium C-IMT) and maximum value (maximum C-IMT) automatically calculated by the software from 6 measurements performed in both right and left carotid arteries. The average C-IMT was considered abnormal (atherosclerotic) if >0.90 mm, or if there were atherosclerotic plaques with a diameter of 1.5 mm or a focal increase in the adjacent C-IMT of 0.5 mm or 50%.1
Determination of LVH
Electrocardiographic estimation of LVH was performed with a General Electric MAC 3.500 ECG System (Niskayuna, NY) which measures voltage and duration of waves and then estimates Sokolow-Lyon index (SV1 + RV5), and the Cornell voltage duration product (VDP-Cornell) following the equations: (RaVL + SV3) × QRS for men and (RaVL + SV3) × QRS + 6 for women.35 LVH was defined as Sokolow-Lyon index >35 mm or the VDP-Cornell value >2.440 mV/ms.4
Evaluation of Renal Function
Renal function was assessed by measuring microalbuminuria, plasma, and urine creatinine concentrations, and calculating glomerular filtration rate using the formulas established by the Chronic Kidney Disease-Epidemiology Collaboration (CKD-EPI)36 and the Modification of Diet in Renal Disease-Isotopic Dilution Mass Spectrometry (MDRD-IDMS).37 Proteinuria was estimated by the urinary albumin–creatinine ratio and then following criteria stablished by the ESH 2007/European Society of Cardiology Guidelines.1 Subclinical renal damage is considered if any of the following criteria is met: plasma creatinine values between 1.3 and 1.5 mg/dL in men and 1.2 and 1.4 mg/dL in women, or glomerular filtration rate <60 mL/min, or albumin–creatinine urinary ratio >22 mg/g in men and 31 mg/g in women. Renal disease is considered to exist if plasma creatinine ≥1.5 mg/dL in men and ≥1.4 mg/dL in women, or albuminuria–creatininuria ratio >300 mg/24 h.
Cardiovascular Risk Assessment
Cardiovascular risk of morbidity and mortality was estimated using the 2013 guidelines of the ESH4 and Framingham Risk Score based on the Framingham study.38
Statistical Analysis
Data input was performed using the Teleform system (Autonomy Cardiff, Vista, CA) and exporting the data to the PASW version 19.0 statistical package (SPSS Inc, Chicago, IL) for data analysis. CT-1 data did not follow a normal distribution as confirmed by kurtosis normality of residuals test. Data were presented as mean ± standard deviation, median and interquartile range (25–75), and box-plots, where the box represents data between first and third quartile, the bar inside the box represents the median, the ends of the whiskers represent the 10th and 90th percentile, and the outliers indicate variability outside the 10th and 90th percentile. Spearman's correlation coefficient was used to analyze associations between quantitative variables. Mann–Whitney U test was used to compare quantitative with qualitative variables of 2 categories and Kruskal–Wallis h test for qualitative variables of >2 categories. We conducted a multiple linear regression analysis using the General Linear Model, considering CT-1 as independent variable and as dependent variables for vascular assessment ABI, IMT, and PWV, as well as VDP-Cornell for cardiac evaluation. We adjusted the model by age, sex, and cardiovascular risk factors as smoke, PP, LDL-cholesterol, and glycosylated hemoglobin. A P value <0.05 was considered statistically significant.
RESULTS
General demographic, physical, and medical parameters of the patients under study are characteristic of the European adult population >50 years old (Table 1). Hypertensive and diabetic patients have significantly higher plasmatic CT-1 levels than controls (Figure 1). Moreover, in the whole population (Total group) there are positive correlations of CT-1 with SBP, DBP, PP, basal glycaemia, and LVH evaluated by VDP-Cornell (Table 2). Moreover, we observe that CT-1 levels are higher in the presence than in the absence of LVH after grouping the patients by VDP-Cornell and Sokolow values (Figure 2).
FIGURE 1.
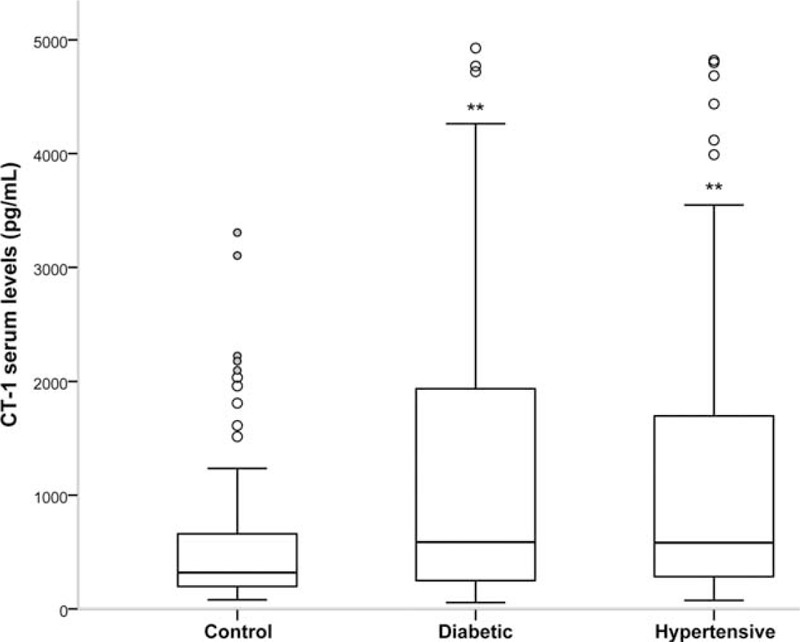
Cardiotrophin-1 (CT-1) plasma levels in DM (group of diabetic patients), HT (group of hypertensive patients), and Control (group of nondiabetic and nonhypertensive patients) groups. Statistically significant differences: ∗∗P < 0.01 versus Control group.
TABLE 2.
Spearman's Correlation Between Plasma Cardiotrophin-1 and Basic Analytical Values, Cardiovascular, and Renal Function Parameters and Global Cardiovascular Risk
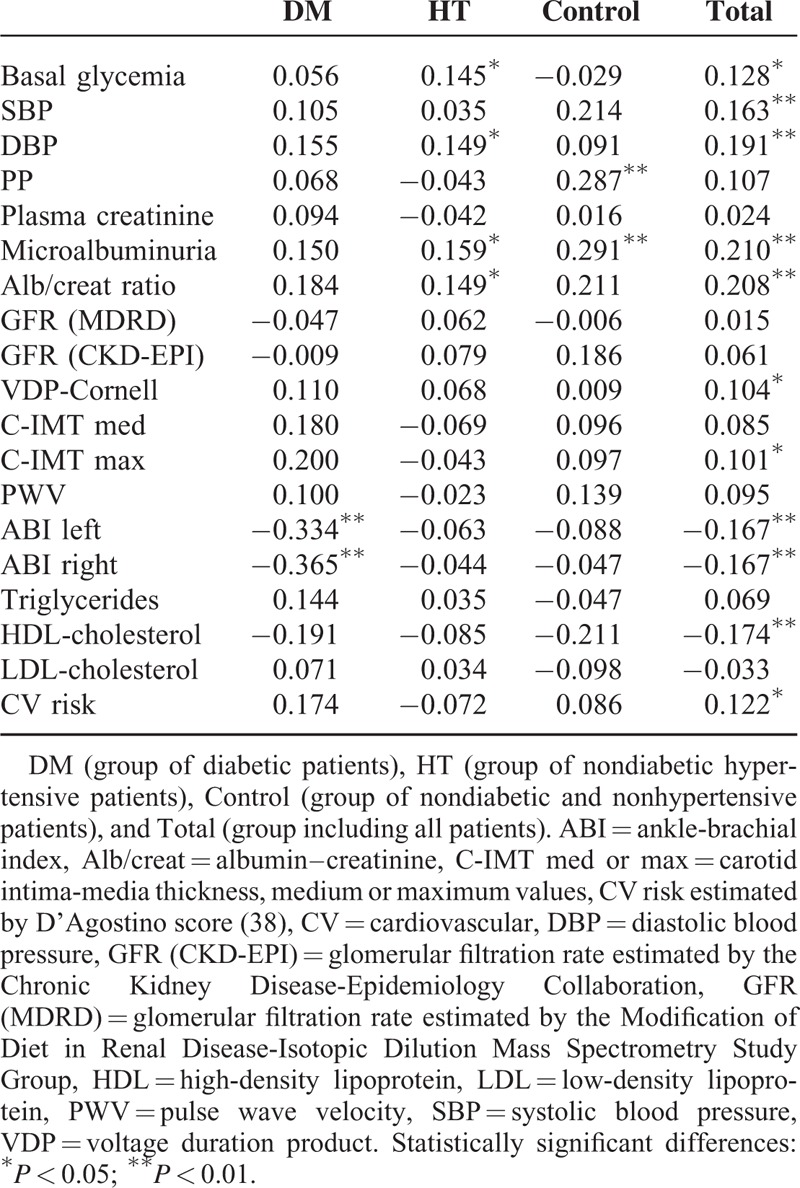
FIGURE 2.
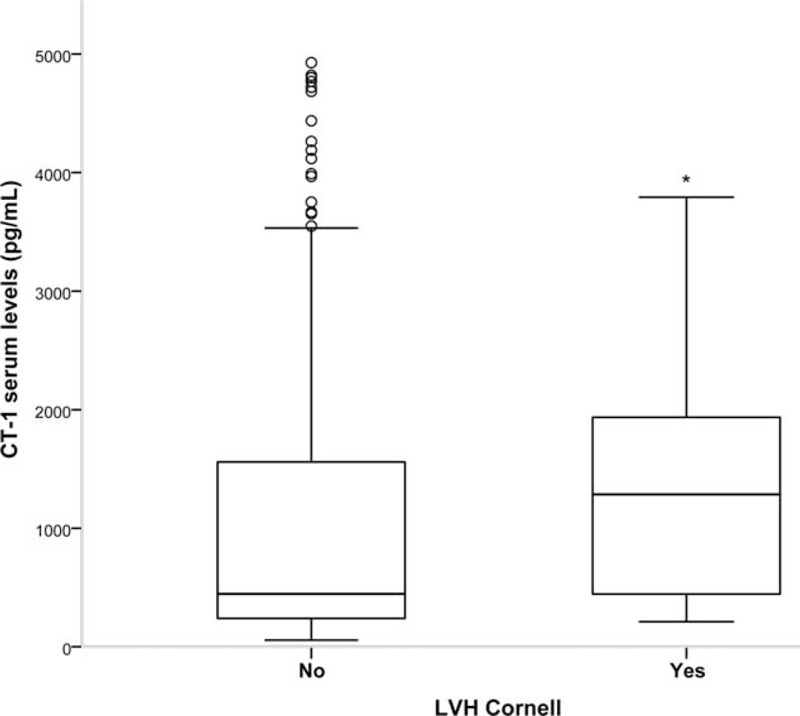
Cardiotrophin-1 (CT-1) plasma levels in the absence/presence of left ventricular hypertrophy (LVH). Evaluated by Sokolow-Lyon index >35 mm or VDP-Cornell value >2.440 mV/ms. Statistically significant differences: ∗P < 0.05 versus patients without LVH.
Plasma CT-1 concentration is also related with indicators of vascular disease. CT-1 is negatively correlated with ABI values, a specific and sensitive metric for the diagnosis of peripheral arterial disease, and positively correlates with C-IMT maximum values (Table 2). It is noteworthy the strong negative correlation of CT-1 with ABI indexes in diabetic patients (DM group).
There is a positive correlation between plasma CT-1 and indicators of subclinical kidney disease as microalbuminuria and albumin–creatinine urinary ratio (Table 2). Plasma CT-1 was not correlated neither with plasma creatinine, nor with glomerular filtration rate (estimated with the MDRD and CKD-EPI equations). However, after grouping the patients by the presence or absence of renal damage (following the criteria either of CKD-EPI <30 mL/min/1.73 m2 or albumin/creatinine ratio>300 mg/dL), we observe that patients of DM and HT groups with renal damage have higher plasma CT-1 than those without renal damage (Figure 3).
FIGURE 3.
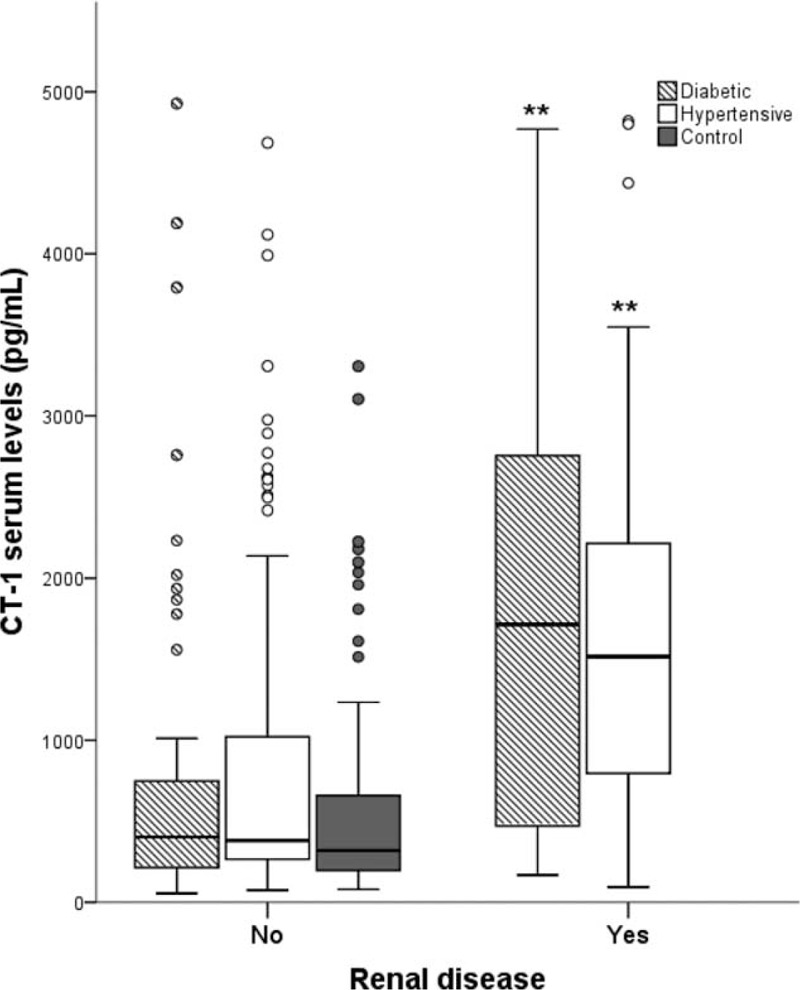
Cardiotrophin-1 (CT-1) plasma levels in the absence/presence of renal disease evaluated following the criteria of the Chronic Kidney Disease-Epidemiology Collaboration (CKD-EPI). Renal disease is considered if glomerular filtration rate <30 mL/min/1.73 m2 or proteinuria >300 mg/dL). Statistically significant differences: ∗∗P < 0.01 versus patients without renal disease.
With respect to lipid profile, higher CT-1 levels are inversely correlated with HDL-cholesterol levels (Table 2). However, we have not found any significant relationship between CT-1 and LDL-cholesterol or triglycerides.
On the contrary, we observed that patients with high or very high grades of cardiovascular risk have significantly higher plasma CT-1 levels than those with low or moderate grades (Figure 4).
FIGURE 4.
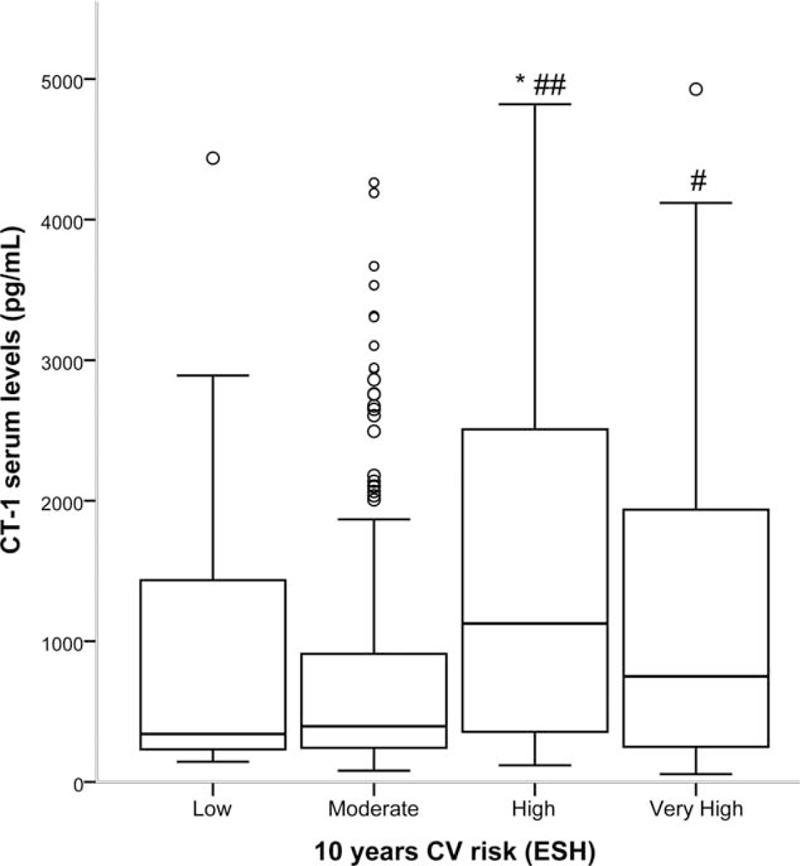
Cardiotrophin-1 (CT-1) plasma levels according to estimated 10-year cardiovascular (CV) risk grades of the 2013 guidelines of the European Society of Hypertension (ESH) (3). Statistically significant differences: ∗P < 0.01 versus low risk; #P < 0.05 versus moderate risk; ##P < 0.01 versus moderate risk.
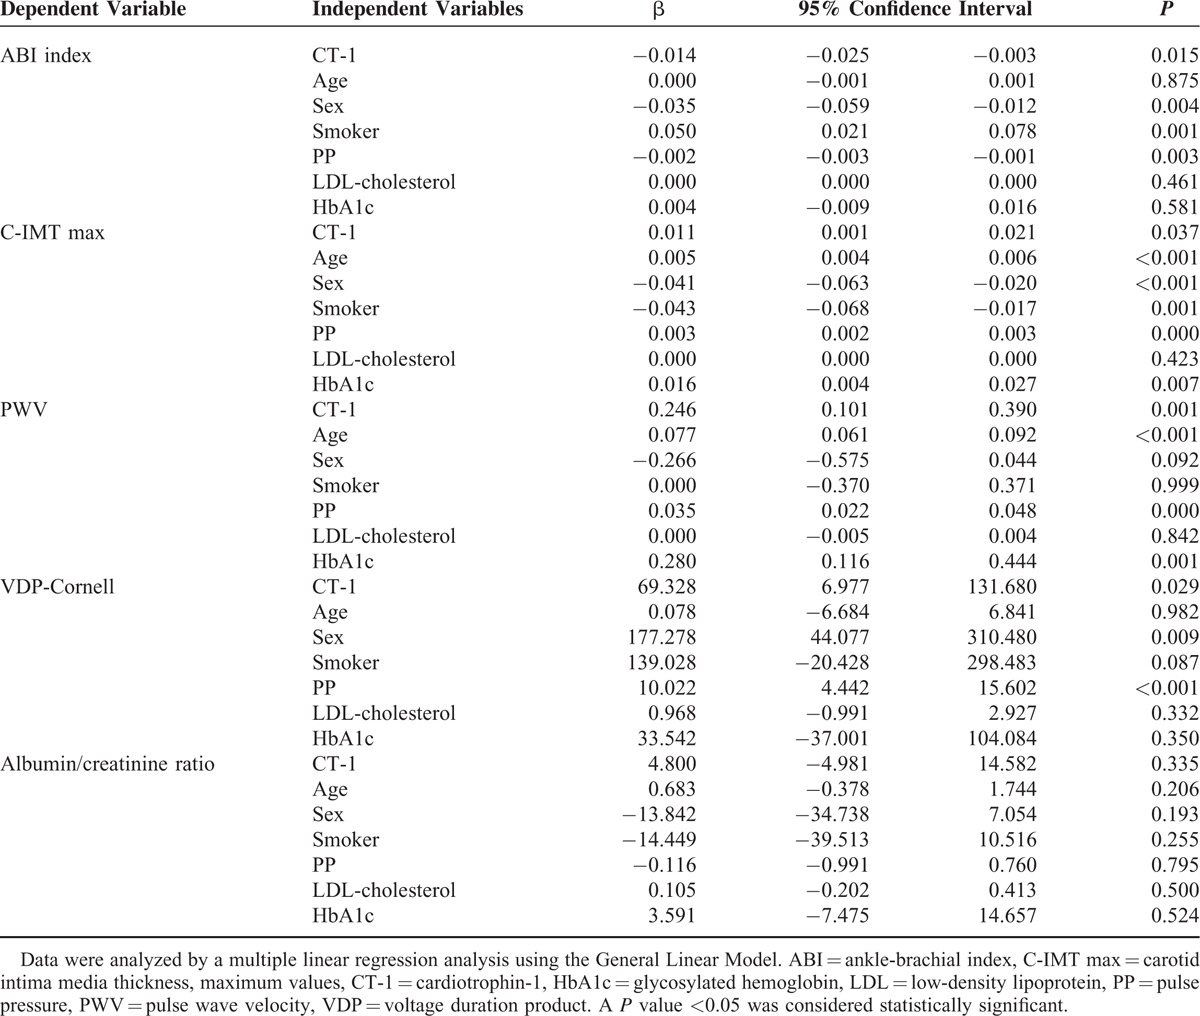
After adjusting for cardiovascular risk factors in a multiple linear regression analysis, the association of CT-1 is maintained with parameters evaluating vascular injury, such as ABI index (β = −0.014, P = 0.015), IMT (β = 0.011, P = 0.037), PWV (β = 0.246, P = 0.001), and VDP-Cornell (β = 69.32, P = 0.029) that evaluates cardiac injury. The association of CT-1 with the albuminuria–creatininuria ratio is not maintained (β = 4.80, P = 0.335) after this analysis (Table 3).
TABLE 3.
Multiple Linear Regression of Cardiotrophin-1 (Independent Variable) and Parameters Assessing Vascular and Cardiac Damage (Dependent Variables)
DISCUSSION
This study shows for the first time that CT-1 is a marker of HT and DM-induced damage in multiple target organs. Moreover, CT-1 is related with increased integrated cardiovascular risk. On the contrary, CT-1 seems to be associated with subclinical renal damage. Although the association of CT-1 with LVH has been previously suggested, our main contribution is to show the diagnostic usefulness of CT-1 by providing evidence of the correlation between its plasma levels and the values obtained in a large number of clinical diagnostic tests indicative of target organ damage in HT and DM patients.
HT is the most important risk factor for death caused by cardiovascular disease.39 We observed that plasma CT-1 is positively correlated with SBP and DBP, and HT patients show higher CT-1 than normotensive individuals, as previously reported.17,19,26–29 Moreover, CT-1 is correlated with glycaemia, and CT-1 levels were higher in type-2 DM patients than in normoglycaemic individuals. This is the first study carried out in an European population with type-2 DM, as only 1 study showed a correlation between CT-1 and newly diagnosed DM in Chinese population.30 Some studies showed that CT-1 regulates glycaemia, insulinemia, and cholesterolemia; protects against insulin resistance; and participates in maintaining normal pancreatic islets function.23,24
LVH is a determinant risk factor,18,40 and our patients exhibit a significant association between plasma CT-1 and LVH. In agreement, it has been reported a correlation between plasma CT-1, LVH, and progression of heart failure in HT patients,17 and between a decrease of CT-1 with LVH regression in essential HT patients under antihypertensive treatment,15 thus suggesting that CT-1 could act as a marker of hypertensive heart disease.15,26 In this regard, plasma CT-1 is associated with the severity of LVH in patients with hypertrophic cardiomyopathy,41 and with myocardial systolic dysfunction in asymptomatic HT patients.19 Moreover, CT-1-induced activation of superoxide anion production is associated with LVH in HT patients.42
Dyslipidemia and obesity contribute to the increase in cardiovascular risk. Most of our study population present grade II overweight (body mass index from 25.0 to 29.9; Table 1). Moreover, the intake of lipid-lowering drugs by some patients modifies their lipid profile. Only 1 study detected correlation of CT-1 with cholesterol levels in children developing metabolic syndrome.43 Ours is the first demonstration of a correlation between plasma CT-1 with decreases in HDL-cholesterol, a lipid factor associated with cardiovascular risk.1 A low HDL-cholesterol level is thought to accelerate the development of atherosclerosis,44 and is also a characteristic of metabolic syndrome.45 We have not found significant relationships between CT-1 and LDL-cholesterol or triglycerides, probably because of the existence of controls with high levels of both molecules (see Table 1) who escape the antilipid treatment (18.3% for controls vs 23.7% for DM and 29.2% for HT groups).
We detected correlations of CT-1 with 3 parameters indicative of vascular damage such as PWV, ABI index, and C-IMT, which may be related to the fibrotic effect of CT-1 observed in rat vascular smooth muscle cells in vitro and in aortic tunica media ex vivo,12 as well as in rat vessels in vivo.21 The absence of CT-1 in knock-out mice decreased age-induced arterial fibrosis and stiffness.14 Therefore, our research is the first to detect a correlation of plasma CT-1 with PWV, ABI, and C-IMT in patients after eliminating agés influence, putting forward that variations in CT-1 could be a usefull marker of generalized vascular injury. We also observed a direct association of plasma CT-1 with a high or a very high degree of cardiovascular risk predicted at 10 years.4 This fact was expected because plasma CT-1 is significantly related to several main factors contributing to the increase in cardiovascular risk (HT, DM, LVH, and vascular damage).
Kidneys are susceptible to being injured by numerous pathophysiological processes occurring in HT and DM, thus rising global cardiovascular risk. We show the first clinical evidence of a correlation between increased plasma CT-1 with incipient renal damage along with normal glomerular filtration rate. Our results fully agree with the impairment in renal function previously found in CT-1-treated rats that presented increased albumin–creatinine urinary ratio with unaltered serum creatinine; interestingly, these rats developed glomerular and tubulointerstitial fibrosis.21 Moreover, our study is the first demonstration of higher plasma CT-1 levels in HT or DM patients with diagnosed renal disease. Thus, plasma CT-1 might be a good indicator of either subclinical damage or established kidney disease. However, this proposal is limited because this correlation is lost after adjusting for conventional cardiovascular risk factors in a multiple linear regression analysis.
Limitations of our study are its crosssectional design, which precludes longitudinal analysis between CT-1 and target organ damage. Sampling of the study was performed consecutively, including hypertensive patients with a short course of HT, or with DT and hyperlipidemia, and many patients receiving drug therapy, which may modify BP levels. However, the heterogeneity of the sample is similar to the distribution of the real population of short-course hypertensive patients with some risk factors and without previous cardiovascular disease.
In recent years, several publications suggest the potential role of CT-1 as both a plasmatic marker15,17 and a target for therapies to treat or prevent hypertensive cardiovascular disease.12,15 This is the first study presenting a robust association between CT-1 and several risk factors in HT and type-2 DM patients as LVH and arterial disease. Multiple regression analysis demonstrated that changes in plasma CT-1 are associated with many indicators currently used in clinical practice to assess cardiovascular damage (VDP-Cornell, PWV, ABI, C-IMT, and integrated cardiovascular risk). In conclusion, our study suggests that plasma CT-1 may be a useful time- and money-saving diagnostic and/or prognostic marker that could replace several expensive measurements currently required in the evaluation and follow-up of cardiovascular injury and risk in susceptible patients.
Acknowledgments
The authors thank Dr Nelida Eleno and Dr Francisco J. López Hernández for their advice and input during the drafting of the manuscript.
Footnotes
Abbreviations: ABI = ankle-brachial index, CKD-EPI = Chronic Kidney Disease-Epidemiology Collaboration, CT-1 = cardiotrophin-1, DBP = diastolic blood pressure, DM = diabetes mellitus, ESH = European Society of Hypertension, HDL-cholesterol = high-density lipoprotein-cholesterol, HT = hypertension, IMT, C-IMT = (carotid) intima-media thickness, LDL-cholesterol = low-density lipoprotein-cholesterol, LVH = left ventricular hypertrophy, MDRD = Modification of Fiet in Renal Disease, MDRD-IDMS = Modification of Diet in Renal Disease-Isotopic Dilution Mass Spectrometry, PWV = pulse wave velocity, SBP = systolic blood pressure, VDP = voltage duration product.
This work was supported by grants from Instituto de Salud Carlos III (Ministry of Economy and Competitiveness, PI12/00959, RETICS RD012/0005/004 and RD012/0021/0032), Junta de Castilla y León (Excellence Group GR100, and Ministry of Health, BIO/SA87/13, BIO/SA15/14), and Fundación Mutua Madrileña (IX Call for Grants and Aids for Medical Research).
The authors have no conflicts of interest to disclose.
REFERENCES
- 1.Mancia G, De Backer G, Dominiczak A, et al. 2007 Guidelines for the management of arterial hypertension: the task force for the management of arterial hypertension of the European Society of Hypertension (ESH) and of the European Society of Cardiology (ESC). J Hypertens 2007; 25:1105–1187. [DOI] [PubMed] [Google Scholar]
- 2.Kelly BB, Narula J, Fuster V. Recognizing global burden of cardiovascular disease and related chronic diseases. Mt Sinai J Med 2012; 79:632–640. [DOI] [PubMed] [Google Scholar]
- 3.Santulli G. Epidemiology of cardiovascular disease in the 21st century: updated numbers and updated facts. J Cardiovasc Dis 2013; 1:1–2. [Google Scholar]
- 4.Mancia G, Fagard R, Narkiewicz K, et al. 2013 ESH/ESC Guidelines for the management of arterial hypertension: the task force for the management of arterial hypertension of the European Society of Hypertension (ESH) and of the European Society of Cardiology (ESC). J Hypertens 2013; 31:1281–1357. [DOI] [PubMed] [Google Scholar]
- 5.Salomaa V, Riley W, Kark JD, et al. Non-insulin-dependent diabetes mellitus and fasting glucose and insulin concentrations are associated with arterial stiffness indexes. The ARIC Study. Atherosclerosis Risk in Communities Study. Circulation 1995; 91:1432–1443. [DOI] [PubMed] [Google Scholar]
- 6.Liang YL, Shiel LM, Teede H, et al. Effects of blood pressure, smoking, and their interaction on carotid artery structure and function. Hypertension 2001; 37:6–11. [DOI] [PubMed] [Google Scholar]
- 7.Laurent S, Cockcroft J, Van Bortel L, et al. Expert consensus document on arterial stiffness: methodological issues and clinical applications. Eur Heart J 2006; 27:2588–2605. [DOI] [PubMed] [Google Scholar]
- 8.Fiorentino TV, Prioletta A, Zuo P, et al. Hyperglycemia-induced oxidative stress and its role in diabetes mellitus related cardiovascular diseases. Curr Pharm Des 2013; 19:5695–5703. [DOI] [PubMed] [Google Scholar]
- 9.Pewsner D, Juni P, Egger M, et al. Accuracy of electrocardiography in diagnosis of left ventricular hypertrophy in arterial hypertension: systematic review. BMJ 2007; 335:711. [DOI] [PMC free article] [PubMed] [Google Scholar]
- 10.Pennica D, King KL, Shaw KJ, et al. Expression cloning of cardiotrophin 1, a cytokine that induces cardiac myocyte hypertrophy. Proc Natl Acad Sci U S A 1995; 92:1142–1146. [DOI] [PMC free article] [PubMed] [Google Scholar]
- 11.Pennica D, Swanson TA, Shaw KJ, et al. Human cardiotrophin-1: protein and gene structure, biological and binding activities, and chromosomal localization. Cytokine 1996; 8:183–189. [DOI] [PubMed] [Google Scholar]
- 12.Lopez-Andres N, Fortuno MA, Diez J, et al. Vascular effects of cardiotrophin-1: a role in hypertension? J Hypertens 2010; 28:1261–1272. [DOI] [PubMed] [Google Scholar]
- 13.Lopez-Andres N, Martin-Fernandez B, Rossignol P, et al. A role for cardiotrophin-1 in myocardial remodeling induced by aldosterone. Am J Physiol Heart Circ Physiol 2011; 301:H2372–H2382. [DOI] [PubMed] [Google Scholar]
- 14.Lopez-Andres N, Calvier L, Labat C, et al. Absence of cardiotrophin 1 is associated with decreased age-dependent arterial stiffness and increased longevity in mice. Hypertension 2013; 61:120–129. [DOI] [PubMed] [Google Scholar]
- 15.Gonzalez A, Lopez B, Martin-Raymondi D, et al. Usefulness of plasma cardiotrophin-1 in assessment of left ventricular hypertrophy regression in hypertensive patients. J Hypertens 2005; 23:2297–2304. [DOI] [PubMed] [Google Scholar]
- 16.Stejskal D, Ruzicka V. Cardiotrophin-1. Review. Biomed Pap Med Fac Univ Palacky Olomouc Czechoslovakia 2008; 152:9–19. [DOI] [PubMed] [Google Scholar]
- 17.Lopez B, Gonzalez A, Querejeta R, et al. Association of plasma cardiotrophin-1 with stage C heart failure in hypertensive patients: potential diagnostic implications. J Hypertens 2009; 27:418–424. [DOI] [PubMed] [Google Scholar]
- 18.Gonzalez A, Lopez B, Ravassa S, et al. Cardiotrophin-1 in hypertensive heart disease. Endocrine 2012; 42:9–17. [DOI] [PubMed] [Google Scholar]
- 19.Ravassa S, Beloqui O, Varo N, et al. Association of cardiotrophin-1 with left ventricular systolic properties in asymptomatic hypertensive patients. J Hypertens 2013; 31:587–594. [DOI] [PubMed] [Google Scholar]
- 20.Cottone S, Nardi E, Mule G, et al. Association between biomarkers of inflammation and left ventricular hypertrophy in moderate chronic kidney disease. Clin Nephrol 2007; 67:209–216. [DOI] [PubMed] [Google Scholar]
- 21.Lopez-Andres N, Rousseau A, Akhtar R, et al. Cardiotrophin 1 is involved in cardiac, vascular, and renal fibrosis and dysfunction. Hypertension 2012; 60:563–573. [DOI] [PubMed] [Google Scholar]
- 22.Natal C, Fortuno MA, Restituto P, et al. Cardiotrophin-1 is expressed in adipose tissue and upregulated in the metabolic syndrome. Am J Physiol Endocrinol Metab 2008; 294:E52–E60. [DOI] [PubMed] [Google Scholar]
- 23.Moreno-Aliaga MJ, Perez-Echarri N, Marcos-Gomez B, et al. Cardiotrophin-1 is a key regulator of glucose and lipid metabolism. Cell Metab 2011; 14:242–253. [DOI] [PubMed] [Google Scholar]
- 24.Moreno-Aliaga MJ, Romero-Lozano MA, Castano D, et al. Role of cardiotrophin-1 in obesity and insulin resistance. Adipocyte 2012; 1:112–115. [DOI] [PMC free article] [PubMed] [Google Scholar]
- 25.Asrih M, Mach F, Quercioli A, et al. Update on the pathophysiological activities of the cardiac molecule cardiotrophin-1 in obesity. Mediators Inflamm 2013; 2013:370715. [DOI] [PMC free article] [PubMed] [Google Scholar]
- 26.Lopez B, Gonzalez A, Lasarte JJ, et al. Is plasma cardiotrophin-1 a marker of hypertensive heart disease? J Hypertens 2005; 23:625–632. [DOI] [PubMed] [Google Scholar]
- 27.Lopez B, Castellano JM, Gonzalez A, et al. Association of increased plasma cardiotrophin-1 with inappropriate left ventricular mass in essential hypertension. Hypertension 2007; 50:977–983. [DOI] [PubMed] [Google Scholar]
- 28.Jougasaki M. Cardiotrophin-1 in cardiovascular regulation. Adv Clin Chem 2010; 52:41–76. [DOI] [PubMed] [Google Scholar]
- 29.Gkaliagkousi E, Gavriilaki E, Nikolaidou B, et al. Association between cardiotrophin 1 levels and central blood pressure in untreated patients with essential hypertension. Am J Hypertens 2014; 27:651–655. [DOI] [PubMed] [Google Scholar]
- 30.Hung HC, Lu FH, Ou HY, et al. Increased cardiotrophin-1 in subjects with impaired glucose tolerance and newly diagnosed diabetes. Int J Cardiol 2013; 169:e33–e34. [DOI] [PubMed] [Google Scholar]
- 31.Genuth S, Alberti KG, Bennett P, et al. Follow-up report on the diagnosis of diabetes mellitus. Diabetes Care 2003; 26:3160–3167. [DOI] [PubMed] [Google Scholar]
- 32.Hirsch AT, Haskal ZJ, Hertzer NR, et al. ACC/AHA 2005 Practice Guidelines for the management of patients with peripheral arterial disease (lower extremity, renal, mesenteric, and abdominal aortic): a collaborative report from the American Association for Vascular Surgery/Society for Vascular Surgery, Society for Cardiovascular Angiography and Interventions, Society for Vascular Medicine and Biology, Society of Interventional Radiology, and the ACC/AHA Task Force on Practice Guidelines (Writing Committee to Develop Guidelines for the Management of Patients With Peripheral Arterial Disease): endorsed by the American Association of Cardiovascular and Pulmonary Rehabilitation; National Heart, Lung, and Blood Institute; Society for Vascular Nursing; TransAtlantic Inter-Society Consensus; and Vascular Disease Foundation. Circulation 2006; 113:e463–e654. [DOI] [PubMed] [Google Scholar]
- 33.Dolan E, Stanton A, Thijs L, et al. Superiority of ambulatory over clinic blood pressure measurement in predicting mortality: the Dublin outcome study. Hypertension 2005; 46:156–161. [DOI] [PubMed] [Google Scholar]
- 34.Gomez-Marcos MA, Recio-Rodriguez JI, Patino-Alonso MC, et al. Protocol for measuring carotid intima-media thickness that best correlates with cardiovascular risk and target organ damage. Am J Hypertens 2012; 25:955–961. [DOI] [PubMed] [Google Scholar]
- 35.Okin PM, Roman MJ, Devereux RB, et al. Electrocardiographic identification of increased left ventricular mass by simple voltage-duration products. J Am Coll Cardiol 1995; 25:417–423. [DOI] [PubMed] [Google Scholar]
- 36.Levey AS, Stevens LA, Schmid CH, et al. A new equation to estimate glomerular filtration rate. Ann Intern Med 2009; 150:604–612. [DOI] [PMC free article] [PubMed] [Google Scholar]
- 37.Levey AS, Bosch JP, Lewis JB, et al. A more accurate method to estimate glomerular filtration rate from serum creatinine: a new prediction equation. Modification of Diet in Renal Disease Study Group. Ann Intern Med 1999; 130:461–470. [DOI] [PubMed] [Google Scholar]
- 38.D’Agostino RB, Sr, Vasan RS, Pencina MJ, et al. General cardiovascular risk profile for use in primary care: the Framingham Heart Study. Circulation 2008; 117:743–753. [DOI] [PubMed] [Google Scholar]
- 39.Modesti PA, Agostoni P, Agyemang C, et al. Cardiovascular risk assessment in low-resource settings: a consensus document of the European Society of Hypertension Working Group on Hypertension and Cardiovascular Risk in Low Resource Settings. J Hypertens 2014; 32:951–960. [DOI] [PMC free article] [PubMed] [Google Scholar]
- 40.Bombelli M, Facchetti R, Carugo S, et al. Left ventricular hypertrophy increases cardiovascular risk independently of in-office and out-of-office blood pressure values. J Hypertens 2009; 27:2458–2464. [DOI] [PubMed] [Google Scholar]
- 41.Monserrat L, Lopez B, Gonzalez A, et al. Cardiotrophin-1 plasma levels are associated with the severity of hypertrophy in hypertrophic cardiomyopathy. Eur Heart J 2011; 32:177–183. [DOI] [PMC free article] [PubMed] [Google Scholar]
- 42.Moreno MU, San Jose G, Pejenaute A, et al. Association of phagocytic NADPH oxidase activity with hypertensive heart disease: a role for cardiotrophin-1? Hypertension 2014; 63:468–474. [DOI] [PubMed] [Google Scholar]
- 43.Rendo-Urteaga T, Garcia-Calzon S, Martinez-Anso E, et al. Decreased cardiotrophin-1 levels are associated with a lower risk of developing the metabolic syndrome in overweight/obese children after a weight loss program. Metabolism 2013; 62:1429–1436. [DOI] [PubMed] [Google Scholar]
- 44.Hage MP, Azar ST. Treating low high-density lipoprotein cholesterol: what is the evidence? Ther Adv Endocrinol Metab 2014; 5:10–17. [DOI] [PMC free article] [PubMed] [Google Scholar]
- 45.Grundy SM, Brewer HB, Jr, Cleeman JI, et al. Definition of metabolic syndrome: report of the National Heart, Lung, and Blood Institute/American Heart Association conference on scientific issues related to definition. Circulation 2004; 109:433–438. [DOI] [PubMed] [Google Scholar]


