

Abstract
Background:
Studies have shown that antibodies targeting the intracellular (ICD) or extracellular domains (ECD) of human epidermal growth factor receptor 2 (HER2) are equivalent when traditional methods are used. We describe a new method to quantify ICD and ECD expression separately and assess the prognostic value of domain-specific HER2 results in patients who received adjuvant trastuzumab therapy.
Methods:
We measured HER2 protein expression with quantitative immunofluorescence (QIF) in tissue microarrays (TMA) using two different antibodies targeting the ICD (CB11 and A0485) and ECD (SP3 and D8F12). We assessed the prognostic value of ICD and ECD expression in 180 patients from a clinical trial of adjuvant chemotherapy followed by trastuzumab (HeCOG 10/05). We performed an exploratory univariate domain-specific, disease-free survival (DFS) analysis and compared DFS functions with Kaplan-Meier estimates. All statistical tests were two-sided.
Results:
HER2 ICD expression by QIF showed slightly higher sensitivity to predict ERBB2 (HER2) gene amplification than ECD expression, which was more specific and had higher positive predictive value. In the HeCOG 10/05 trial specimens, 15% of cases showed discordant results for ICD and ECD expression. High ECD was statistically associated with longer DFS (log-rank P = .049, HR = 0.31, 95% CI = 0.144 to 0.997), while ICD status was not. Among patients with low ECD, there was no difference in DFS by ICD status. However, when ICD was high, high ECD was statistically associated with longer DFS (log-rank P = .027, HR = 0.23, 95% CI = 0.037 to 0.82) compared with low ECD.
Conclusion:
Quantitative measurements of HER2 ICD and ECD expression in breast cancer suggest a subclassification of HER2-positive tumors. Trastuzumab-treated patients with high ECD showed better DFS than patients with low ECD. This suggests differential benefit from trastuzumab therapy based on HER2 ECD expression.
Guidelines issued in 2013 by the American Society of Clinical Oncology (ASCO) and the College of American Pathologists (CAP) consider qualitative, chromogen-based immunohistochemistry (IHC) as a primary assay to determine human epidermal growth factor receptor 2 (HER2) status in breast cancer. The IHC equivocal cases (eg, 2+) require further testing by single or dual probe in situ hybridization (ISH/FISH) (1). In the United States (2), there are several different HER2 antibodies in common usage in pathology labs including antibodies for both the cytoplasmic or intracellular domain (ICD) and the extracellular domain (ECD). The performance of some of these antibodies (4B5, CB11 targeting the ICD and SP3 targeting the ECD) has been compared using conventional IHC and a high concordance has been shown between the antibodies, independent of their target epitope (3,4). A more recent study also identified high concordance between ICD and ECD assays using chromogenic IHC (5). There are conflicting reports on the sensitivity and specificity to predict HER2 gene amplification with different antibodies (6, 7).
The high concordance in HER2 status assessment by antibodies that target the ICD and ECD respectively is somewhat surprising considering that there are well known mechanisms that can lead to the cleavage of ECD or to the expression of a truncated HER2 protein that lacks the ECD. Lack of HER2 ECD expression has been shown as one of the mechanisms of resistance to trastuzumab therapy (8). These observations have potential clinical implications because there are distinct HER2-targeted therapies in the clinic that are directed to either the ICD (eg, HER2 kinase inhibitors) or the ECD (HER2 targeting antibodies) (9). The failure of chromogenic IHC studies to observe discordance in HER2 ICD and ECD expression may relate to methodological limitations. Some studies did not examine ICD and ECD expression simultaneously on the same cases, but no studies have used quantitative methods of standardization. The standard IHC test is semiquantitative and is subject to considerable interobserver variation, which could also limit its ability to distinguish discordance between ICD and ECD levels because of limited dynamic range and substantial noise in the measurements (10). In this study we systematically examined ICD and ECD expression on the same cases using two different antibodies directed against the ICD and ECD, respectively, and applying an established quantitative immunofluorescence (QIF) method. We assessed the sensitivities and specificities of the different domain-specific antibodies compared with FISH and routine clinical IHC results and also tested the prognostic value in a cohort of trastuzumab-treated patients.
Methods
HER2 Standardization Tissue Microarray (YTMA263)
The HER2 standardization tissue microarray (TMA) was built extracting 0.6mm cores from 80 formalin-fixed paraffin-embedded (FFPE) breast carcinomas seen at Yale Pathology between 1998 and 2011. Results from CLIA-certified IHC and FISH were extracted from the pathology reports. As internal controls, we included in the TMA samples from 10 breast cancer cell lines with known HER2 copy number and 10 histospots containing nontumor breast tissue. Cases were arranged in columns according to their HER2 status to facilitate validation (Supplementary Figure 1, available online). Four replicate TMAs were built using tumor cores that were at least 3mm apart from each other.
Antibodies, Quantitative Immunofluorescence and IHC
Fresh TMA cuts were deparaffinized at 60°C for 20 minutes, then incubated twice in xylene for 20 minutes. Rehydration was performed using ethanol. Antigen retrieval was carried as recommended by the manufacturers with citrate buffer pH 6.0 (CB11, A0485 and SP3) or EDTA buffer pH 8.0 (D8F12) at 97°C for 20 minutes in a pressure-boiling container (PT Module, Lab Vision, Thermo Scientific, Waltham, MA). Endogenous peroxidase activity was blocked with 2.5% hydroxyl peroxide in methanol for 30 minutes, followed by blocking with 0.3% bovine serum albumin in 0.1mol/L of Tris-buffered saline for 30 minutes at room temperature. Four commercially available primary anti-HER2 antibodies were used (CB11, A0485, SP3 and D8F12) (Supplementary Table 1, available online). Slides were then incubated overnight at 4°C with each HER2 primary antibody using at least five different concentrations/dilutions and with cytokeratin at 1:100 dilution (monoclonal mouse anti-human cytokeratin, clone AE1/AE3; polyclonal rabbit anti-cow cytokeratin, wide spectrum screening, Dako, Glostrup, Denmark). Sections were incubated for one hour at room temperature with Alexa 546-conjugated goat anti-rabbit/anti-mouse secondary antibodies (Molecular Probes, Eugene, OR, USA) diluted 1:100 in mouse/rabbit EnVision amplification reagent (Dako). Cyanine 5 (Cy5) directly conjugated to tyramide (Perkin-Elmer, Waltham, MA, USA) at 1:50 dilution was used for target antibody detection. ProLong mounting medium (ProLong Gold; Molecular Probes) with 4,6-diamidino-2-phenyl-indole (DAPI) was used to stain nuclei. Additionally, two serial sections from YTMA263 were stained for CB11, as well as for SP3 using chromogenic IHC. The slides were subjected to the same deparaffinization, antigen retrieval,and blocking protocol mentioned above and incubated overnight in HER2 primary antibody solution. Sections were then incubated in mouse/rabbit EnVision amplification reagent (Dako) for one hour at room temperature. Chromogenic staining was performed (Liquid DAB + Substrate Chromogen, Dako), followed by counterstain with Tacha’s hematoxylin (Biocare Medical, Concord, CA, USA) for three minutes and dehydration with ethanol and xylene. Finally, slides were coverslipped using Cytoseal 60 (Thermo Scientific, Waltham, MA).
Fluorescence Measurement and Scoring
QIF was performed using the AQUA method as previously shown by our group (11–13). Briefly, the QIF score of HER2 in the tumor compartment was calculated by dividing the HER2 compartment pixel intensities by the area of cytokeratin positivity. QIF scores were normalized to the exposure time and bit depth at which the images were captured, allowing scores collected at different exposure times to be comparable. All acquired histospots were visually evaluated and cases with staining artifacts or less than 2% tumor (cytokeratin staining) were excluded from the analysis.
Antibody Titration
To optimize the titer for each HER2 antibody, we stained the standardization TMA (YTMA263) using at least five dilutions covering more than one order of magnitude in serial sections. The antibodies were tested at different dilutions ranging from 1:50 up to 1:50 000. Titration curves for each antibody using the average scores were plotted. We calculated the average of the highest 10% and lowest 10% of spots, their difference and ratio. Linear regression coefficients (R2) were calculated for each titer as a measure of reproducibility. A regression-based curve was plotted for each antibody. We defined the objectively optimal antibody titer as the one that had the highest dynamic range of signal with the highest R2 (Supplementary Table 1, available online). Fresh TMA cuts were stained using optimized titers for one ICD (CB11) and one ECD (SP3) antibody.
Diagnostic Test Evaluation for Prediction of HER2 Gene Amplification
Average scores from lowest to highest were calculated to obtain a population distribution-based cutpoint using the Joinpoint software (version 4.04, NCI), as described (14). The software was set to find one cutpoint, which considered the mean of all observations for the same spot in YTMA 263 and the corresponding standard error of the mean. The values did not include outcome information. The cutpoint was used subsequently to calculate sensitivity, specificity, positive predictive value (PPV), and negative predictive value (NPV) of the quantitative HER2 protein measurements. The slides stained with chromogenic IHC were scanned and analyzed using the US Food and Drug Administration (FDA)–approved Aperio IHC Membrane Image Analysis algorithm (Aperio Technologies, Inc., Vista, CA). Average membrane intensity scores were then profiled and analyzed with Joinpoint in the aforementioned fashion to obtain the diagnostic test evaluation.
Prognostic Cohort
The Hellenic Cooperative Oncology Group (HeCOG) 10/05 trial (15) was a sequential, dose-dense, three-arm breast cancer adjuvant study performed between July 2005 and November 2008, including 990 eligible patients treated with epirubicin, paclitaxel, and cyclophosphamide, methotrexate, and fluorouracil (CMF), compared with epirubin, CMF, and either weekly paclitaxel or docetaxel. Chemotherapy and radiation therapy (when indicated) were followed by one year of trastuzumab in HER2-positive patients. Patients were selected for trastuzumab treatment based on: 1) HER2 IHC 3+ with the Dako Herceptest involving the polyclonal ICD-detecting A0485 antibody and 2) HER2 gene amplification with FISH for cases classified as IHC 2+ with the same detection system, according to Wolff et al. (16). Before random assignment, patients provided study-specific written informed consent for participating in the trial and optionally a separate informed consent for providing biological material for research purposes. All clinical investigations related to the study have been conducted according to the principles expressed in the Declaration of Helsinki. The trial was included in the Australian New Zealand Clinical Trials Registry (ANZCTR) and allocated the Registration Number ACTRN12610000151033. A total of 705 patients with FFPE tumor tissue samples and available clinical annotation were represented in two TMA blocks. The summarized patient and tumor characteristics for the HeCOG 10/05 cohort from this trial are shown in Supplementary Table 2 (available online).
Statistical Analysis
We extracted the information from 180 HER2-positive patients that were treated with trastuzumab and performed an exploratory univariate domain-specific, disease-free survival (DFS) analysis (Supplementary Figure 2, available online). DFS functions were compared using Kaplan-Meier estimates, and statistical significance was determined using the log-rank test. Statistical analysis was carried out using GraphPad Prism v6.0 software for Windows (GraphPad Software, Inc., La Jolla, CA). All P values were based on two-sided tests, and all values under .05 were considered statistically significant.
Results
Bar charts from the automated, quantitative antibody standardization are shown in Figure 1 that illustrates the importance of optimizing antibody dilution. Figure 1A shows results when too much antibody is used; the amplified population is not well separated from the unamplified population. In Figure 1, B and C, lower antibody concentrations improve the discrimination of HER2 amplified and nonamplified cases. With very high dilutions as in Figure 1D, the signal dynamic range decreases. The results indicate that the optimal dilution for this particular antibody, A0485, is 1:10,000 (Figure 1C). Importantly, the optimal dilution is different for different antibodies as illustrated on Figure 1, E and F (see also Supplementary Table 1, available online).
Figure 1.
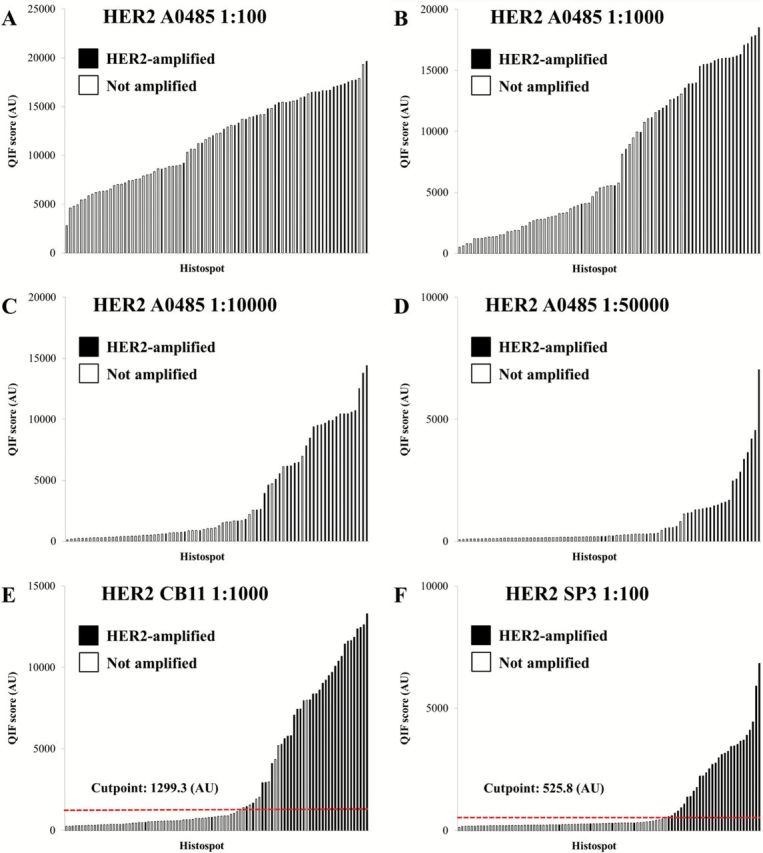
Standardization of human epidermal growth factor receptor 2 (HER2) protein measurement using automated, quantitative immunofluorescence. HER2 antibody assays directed against the intracellular (ICD) and extracellular (ECD) domains were tested in a HER2 standardization tissue microarray. A-D) Distribution of HER2 A0485 (ICD) scores at different dilutions. Two populations and clustering of amplified cases (black) can be observed when the optimized titer is reached (C). E-F) Distribution of HER2 CB11 (ICD) and SP3 (ECD) scores at their optimized titer. The red dotted line shows the Joinpoint cutpoint for each assay. AU = arbitrary units of fluorescence; QIF = quantitative immunofluorescence.
When the titer is near the optimum, examination of the distributions indicates two distinct populations corresponding to HER2-overexpressing and HER2-normal cases, as expected. To determine the cutpoint between normal and amplified, we used the Joinpoint statistical software tool (14). Joinpoint analysis allows the selection of a threshold in the data based on its distribution, without any input from outcome or other external variables, and the testing of the statistical significance of that cutpoint. This cutpoint needs to be determined independently for each antibody and can correspond to very different numerical values in the same data from antibody to antibody (Figure 1, E and F). This data driven cutpoint selection for HER2 expression allows dynamic determination of the threshold that may vary as a function of time, laboratory setting, or other less well-characterized variables, but it represents the optimal threshold for the given data. As such, this approach represents a method to standardize a cutpoint over time and laboratory site because the derivation of the cutpoint in based on the biology of the specimens in the array, not the external variables, like antibody concentration, autostainer platform or other variables.
Using the cutpoints defined by the dynamic cutpoint selection method, the diagnostic performance of ICD and ECD antibodies for prediction of HER2 gene amplification (using the pathology report as the criterion standard) is presented in Table 1. The ICD antibodies showed somewhat higher sensitivity (94.1% and 90.9% for CB11 and A0485, respectively) than ECD antibodies (88.2% and 90.6% for SP3 and D8F12, respectively). Conversely, ECD antibodies showed higher specificity for prediction of HER2 gene amplification (98.4% and 92.0% for SP3 and D8F12, respectively) than ICD antibodies (85.5% and 87.3% for CB11 and A0485, respectively). Positive predictive value was also higher for ECD antibodies (96.8% and 87.9% for SP3 and D8F12 vs 78.1% and 81.1% for CB11 and A0485, respectively). Comparable results were observed using conventional chromogenic IHC, although specificities and PPVs were lower (Table 1; Supplementary Figure 3, available online).
Table 1.
Diagnostic test evaluation for prediction of HER2 gene amplification for intracellular and extracellular domain antibodies in a HER2 standardization tissue microarray*
| Antibody | Quantitative immunofluorescence | Chromogenic immunohistochemistry | ||||||
|---|---|---|---|---|---|---|---|---|
| Sensitivity, % (95% CI) | Specificity, % (95% CI) | PPV, % (95% CI) | NPV, % (95% CI) | Sensitivity, % (95% CI) | Specificity, % (95% CI) | PPV, % (95% CI) | NPV, % (95% CI) | |
| CB11 | 94.1 (78.9 to 99.0) | 85.5 (73.7 to 92.7) | 78.0 (62.0 to 88.9) | 96.4 (86.4 to 99.4) | 96.3 (79.1 to 99.8) | 65.1 (49.0 to 78.5) | 63.4 (46.9 to 77.4) | 96.6 (80.4 to 99.8) |
| A0485 | 90.9 (74.5 to 97.6) | 87.3 (74.9 to 94.3) | 81.1 (64.3 to 91.4) | 94.1 (82.8 to 98.5) | — | — | — | — |
| SP3 | 88.2 (71.6 to 96.2) | 98.4 (90.3 to 99.9) | 96.8 (81.5 to 99.8) | 93.9 (84.4 to 98.0) | 89.7 (71.5 to 97.3) | 82.6 (68.0 to 91.8) | 76.5 (58.4 to 88.6) | 92.7 (79.0 to 98.1) |
| D8F12 | 90.6 (73.8 to 97.5) | 92.0 (79.9 to 97.4) | 87.9 (70.9 to 96.0) | 94.9 (82.1 to 98.4) | — | — | — | — |
* HER2 intracellular domain assays: CB11 and A0485; HER2 extracellular domain assays: SP3 and D8F12. Diagnostic test evaluation using chromogenic immunohistochemistry was performed only for CB11 and SP3 assays. Values are shown in percentages with 95% confidence intervals in parenthesis. CI = confidence interval; HER2 = human epidermal growth factor receptor 2; NPV = negative predictive value; PPV = positive predictive value.
In the HER2 standardization array, 10 out of 95 histospots (10.5%) showed discordant HER2 results with QIF (high ICD /low ECD score). The R-squared (R2) for ECD vs ICD was 0.73 (not shown). A representative case is shown in Figure 2. In panel A, HER2 ICD fluorescent signal is clearly detected in the tumor. In panel B, the same tumor area shows reduced signal for HER2 ECD. In panels C and D, chromogenic IHC on the same case shows intense complete/diffuse membranous staining for HER2 ICD (eg, score 3+) and weak focal positivity for ECD (eg, score 1+). A plot of the QIF scores from each case with each antibody illustrates the discordance (Figure 3A).
Figure 2.

Domain-specific human epidermal growth factor receptor 2 (HER2) measurement reveals differential expression of the protein’s intracellular (ICD) and extracellular domain (ECD) in breast cancer cases. A-B) Representative pictures of a breast cancer case from the HER2 standardization tissue microarray show intense ICD signal (CB11) in the tumor in (A), while having lower ECD signal (B) (SP3) in the same area. C-D) depict the difference in chromogen deposition using the ICD and ECD assays in the same tumor. More intense signal is observed for HER2 ICD than for ECD. Scale bars = 100 μM.
Figure 3.
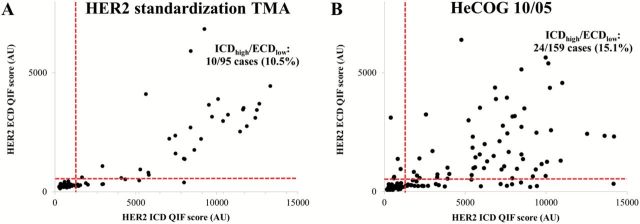
Domain-specific human epidermal growth factor receptor 2 (HER2) subgrouping in breast cancer cases. Scatterplots show the HER2 intracellular (ICD [CB11]) and extracellular domain (ECD [SP3]) scores from the HER2 standardization tissue microarray (TMA) (A) and HeCOG 10/05 trial (B), along with cutpoints for each assay. Discordant ICD-high/ECD-low cases are allocated in the bottom right quadrant (10.5% and 15.1% in the HER2 standardization TMA and HeCOG 10/05, respectively).
Prognostic Value of Domain-Specific Quantitative HER2 Expression
To examine the prognostic importance of low vs high ECD and ICD expressions, respectively, we performed QIF on TMAs from the HeCOG 10/05 clinical trial. In this three-arm trial, patients were randomly assigned to receive either three cycles of dose-dense epirubicin followed by three cycles of three-weekly paclitaxel followed by three cycles of CMF (Arm A), or three cycles of epirubicin followed by three cycles of CMF, followed by nine cycles of weekly docetaxel (Arm B) or nine cycles of weekly paclitaxel (Arm C). Trastuzumab was administered for one year to HER2-positive patients; trastuzumab was often initiated several months after completion of chemotherapy. At the end, 180 HER2-positive cases received trastuzumab, and of those, both HER2 ICD and ECD QIF scores were available in 159 cases.
Figure 3B shows that, about 15% of cases (n = 24) have discordant results and demonstrate high ICD but low ECD expression. ICD status was not associated with DFS (log-rank P = .67, HR = 0.81, 95% CI = 0.315 to 2.11) (Figure 4A). In contrast, ECD-high status was statistically significantly associated with longer DFS in these trastuzumab-treated patients (log-rank P = .049, HR = 0.31, 95% CI = 0.144 to 0.997) (Figure 4B). There was no difference in DFS when ICD-low patients were compared with ICD-high/ECD-low patients (log-rank P = .27, HR = 0.5, 95% CI = 0.14 to 1.7) (Figure 4C). However, when ICD was high, high ECD was statistically significantly associated with longer DFS (log-rank P = .027, HR = 0.23, 95% CI = 0.037 to 0.82, percent DFS = 94.1) compared with low ECD (percent DFS = 83.3) (Figure 4D). ECD levels in ICD-high patients were not associated with age, grade, size, histotype, node status, or estrogen receptor status (not shown). The limited number of patients in the ICD-high group precluded any multivariable analysis of DFS. ECD and ICD were not associated with overall survival in trastuzumab-treated patients (not shown). Neither ECD nor ICD levels were associated with survival in HER2-negative patients in the HeCOG 10/05 (n = 462, data not shown).
Figure 4.

Characterization of differential human epidermal growth factor receptor 2 (HER2) intracellular (ICD) and extracellular domain (ECD) expression in HER2-positive, trastuzumab-treated patients from HeCOG 10/05. A-D) Association of differential HER2 domain expression and survival in trastuzumab-treated patients. Kaplan-Meier graphical analysis of disease-free survival according to ICD/ECD status. Low and high groups were determined using population-based cutpoints (see Methods). The number of patients at risk in each group and the respective log rank P values are indicated in the chart. All tests were two-sided. CI = confidence interval; DFS = disease-free survival; HR = hazard ratio.
Discussion
Here we describe a method of objective, automated, and quantitative standardization of HER2 antibodies that can be performed in clinical FFPE samples to maintain a reproducible distribution-based cutpoint between normal and high HER2. Using population-based cutpoints, we determined that HER2 antibodies targeting the ICD have higher sensitivity for prediction of HER2 gene amplification, while antibodies binding the ECD have higher specificity and positive predictive value. These results were observed in assays performed using QIF and chromogenic IHC. We also show that a subset of HER2-positive patients from a randomized, prospective cohort of sequential chemotherapy and trastuzumab possess discordant ICD-high/ECD-low expression. In those patients, HER2 ICD status was not associated with differences in survival, while ECD-high patients had longer DFS. Also, ICD-high/ECD-low status was not associated with benefit in DFS, while ECD-high status in ICD-high patients was associated with longer DFS. Our findings suggest that differential, quantitative, domain-specific HER2 measurement might determine benefit from adjuvant trastuzumab treatment.
In US labs, determination of HER2 protein status is typically carried out in a semiquantitative fashion following ASCO/CAP guidelines (1) using chromogenic IHC. The same assay can be analyzed with FDA-approved automated, quantitative systems (17,18). While ASCO/CAP provides general recommendations for local IHC validation, no mention is made regarding which antibody-based assay should be used. A recent CAP survey (2) across more than 1000 pathology labs across the United States revealed that several HER2 antibodies are used to determine HER2 status including both ICD and ECD epitopes. While high interobserver concordance is seen (3,4), reports on sensitivity and specificity to predict HER2 gene amplification are conflicting (6,7). The conflicting results may be because of antibody concentration (19), subjectivity of semiquantitative analysis, or the limited dynamic range of chromogenic IHC (11,20).
Here, our findings suggest that performance to predict HER2 gene amplification using both QIF and IHC is affected by the protein domain that is being tested. In the small 80-case standardization set, we saw that the sensitivity to predict FISH amplification of the antibodies was slightly lower or approximately equal for the ECD compared with ICD antibodies. In contrast, both ECD antibodies tested were substantially more specific for prediction of FISH amplification. While we do not have an explanation for this observation, it is possible that when HER2 gene amplification occurs, there is high-level production of the protein, including both the extracellular and cytoplasmic domain, that may outpace the cells capacity to cleave or process HER2 protein. Some studies (21) have shown that there are cases where the protein is high even in the absence of FISH amplification. We also observed this in our standardization array (Supplementary Figure 1, A and B, row 8: 2+ NOT AMP, available online). It may be that when this occurs, the predominant form of the protein is the p95 or cleaved form, and this leads to the discordance.
The most meaningful endpoint of HER2 testing is not prediction of HER2 gene amplification but outcome after HER2-targeted therapies. Using our novel, standardized approach of domain-specific HER2 testing with population-based cutpoints, we found that 15.1% of HER2-positive, trastuzumab-treated patients from a randomized, prospective cohort had differential expression of HER2 ICD and ECD. ECD status was found to be predictive of better DFS with trastuzumab treatment, while ICD status was not. This makes sense based on the mechanism of action of trastuzumab that can only bind to the extracellular domain of HER2.
The most important limitation of this work is that we cannot formally prove an interaction between ECD status and benefit from trastuzumab, because all patients received trastuzumab. The proper way to test the hypothesis would require access to specimens from a randomized clinical trial between trastuzumab vs no trastuzumab or an alternative HER2-targeted therapy that does not involve the ECD. A second potential limitation is that we assessed protein expression in TMAs and while several studies suggest that TMA results are representative of results from whole section, future validation is required with conventional whole sections. Although not yet formally tested, we have seen similar discrepancies between ECD and ICD on traditional sections. A third potential limitation of the work is that QIF that is required for this test is not routinely used in the clinical laboratory. While we realize it is important for new tests to be amenable to adoption in an average laboratory, we believe many are capable of immunofluorescence because it is currently routinely used in both renal pathology and dermatopathology tests. Furthermore, when FISH was proven valuable in the late 1990s, many labs proved that they were able to adopt and validate this new fluorescence based technology.
In summary, the extracellular domain of HER2 is not uniformly overexpressed in all cases with FISH amplification, while the intracellular domain expression is almost always high. About 15% of cases have low ECD but high ICD. These observations raise the tantalizing possibility that cancers that express low ECD despite gene amplification (and HER2 positivity by ICD targeted antibodies) may benefit less from therapies that target the extracellular domain (eg, trastuzumab) and more from kinase inhibitors (eg, lapatinib) that target the intracellular domain. We hope to have the opportunity to prospectively test this hypothesis.
Funding
This work was supported by the Breast Cancer Research Foundation and R-01 CA139431-01. The sponsors of this study did not participate in experimental design, data collection, or analysis.
Supplementary Material
The authors acknowledge Lori Charette and her team at Yale Pathology Tissue Services for production of the high-quality tissue microarrays used in this study.
Dr. David L. Rimm is a consultant for Genoptix Medical Laboratories and Advanced Cell Diagnostics, Inc.
References
- 1. Wolff AC, Hammond ME, Hicks DG, et al. Recommendations for human epidermal growth factor receptor 2 testing in breast cancer: American Society of Clinical Oncology/College of American Pathologists clinical practice guideline update. J Clin Oncol. 2013;31(31):3997–4013. [DOI] [PubMed] [Google Scholar]
- 2. College of American Pathologists. Participant Summary. HER2-A immunohistochemistry Tissues microarray. Surveys 2013 and Anatomic Pathology Education Programs.
- 3. Rhodes A, Sarson J, Assam EE, Dean SJ, Cribb EC, Parker A. The reliability of rabbit monoclonal antibodies in the immunohistochemical assessment of estrogen receptors, progesterone receptors, and HER2 in human breast carcinomas. Am J Clin Pathol. 2010;134(4):621–632. [DOI] [PubMed] [Google Scholar]
- 4. Nunes CB, Rocha RM, Buzelin MA, et al. False positivity in HER2 testing of breast cancer: novel paths for approaching an old dilemma. J Clin Pathol. 2013;66(11):946–950. [DOI] [PubMed] [Google Scholar]
- 5. Dekker TJ, Borg ST, Hooijer GK, et al. Determining sensitivity and specificity of HER2 testing in breast cancer using a tissue micro-array approach. Breast Cancer Res. 2012;14(3):R93. [DOI] [PMC free article] [PubMed] [Google Scholar]
- 6. Ricardo SA, Milanezi F, Carvalho ST, Leitão DR, Schmitt FC. HER2 evaluation using the novel rabbit monoclonal antibody SP3 and CISH in tissue microarrays of invasive breast carcinomas. J Clin Pathol. 2007;60(9):1001–1005. [DOI] [PMC free article] [PubMed] [Google Scholar]
- 7. Nunes CB, Rocha RM, Reis-Filho JS, et al. Comparative analysis of six different antibodies against Her2 including the novel rabbit monoclonal antibody (SP3) and chromogenic in situ hybridisation in breast carcinomas. J Clin Pathol. 2008;61(8):934–938. [DOI] [PubMed] [Google Scholar]
- 8. Arribas J, Baselga J, Pedersen K, Parra-Palau JL. p95HER2 and breast cancer. Cancer Res. 2011;71(5):1515–1519. [DOI] [PubMed] [Google Scholar]
- 9. Eroglu Z, Tagawa T, Somlo G. Human epidermal growth factor receptor family-targeted therapies in the treatment of HER2-overexpressing breast cancer. Oncologist. 2014;19(2):135–150. [DOI] [PMC free article] [PubMed] [Google Scholar]
- 10. Giltnane JM, Rimm DL. Technology insight: Identification of biomarkers with tissue microarray technology. Nat Clin Pract Oncol. 2004;1(2):104–111. [DOI] [PubMed] [Google Scholar]
- 11. Camp RL, Chung GG, Rimm DL. Automated subcellular localization and quantification of protein expression in tissue microarrays. Nat Med. 2002;8(11):1323–1327. [DOI] [PubMed] [Google Scholar]
- 12. Neumeister VM, Anagnostou V, Siddiqui S, et al. Quantitative assessment of effect of preanalytic cold ischemic time on protein expression in breast cancer tissues. J Natl Cancer Inst. 2012;104(23):1815–1824. [DOI] [PMC free article] [PubMed] [Google Scholar]
- 13. Velcheti V, Schalper KA, Carvajal DE, et al. Programmed death ligand-1 expression in non-small cell lung cancer. Lab Invest. 2014;94(1):107–116. [DOI] [PMC free article] [PubMed] [Google Scholar]
- 14. Kim HJ, Fay MP, Feuer EJ, Midthune DN. Permutation tests for joinpoint regression with applications to cancer rates. Stat Med. 2000;19:335–351, correction: 2001; 20: 655. [DOI] [PubMed] [Google Scholar]
- 15. Fountzilas G, Dafni U, Papadimitriou C, et al. Dose-dense sequential adjuvant chemotherapy followed, as indicated, by trastuzumab for one year in patients with early breast cancer: first report at 5-year median follow-up of a Hellenic Cooperative Oncology Group randomized phase III trial. BMC Cancer. 2014;14(1):515. [DOI] [PMC free article] [PubMed] [Google Scholar]
- 16. Wolff AC, Hammond ME, Schwartz JN, et al. American Society of Clinical Oncology/College of American Pathologists guideline recommendations for human epidermal growth factor receptor 2 testing in breast cancer. J Clin Oncol. 2007;25(1):118–145. [DOI] [PubMed] [Google Scholar]
- 17. Cantaloni C, Tonini RE, Eccher C, et al. Diagnostic value of automated Her2 evaluation in breast cancer: a study on 272 equivocal (score 2+) Her2 immunoreactive cases using an FDA approved system. Appl Immunohistochem Mol Morphol. 2011;19(4):306–312. [DOI] [PubMed] [Google Scholar]
- 18. Zabaglo L, Stoss O, Rüschoff J, Zielinski D, Salter J, Arfi M. HER2 staining intensity in HER2-positive disease: relationship with FISH amplification and clinical outcome in the HERA trial of adjuvant trastuzumab. Ann Oncol. 2013;24(11):2761–2766. [DOI] [PubMed] [Google Scholar]
- 19. McCabe A, Dolled-Filhart M, Camp RL, Rimm DL. Automated quantitative analysis (AQUA) of in situ protein expression, antibody concentration, and prognosis. J Natl Cancer Inst. 2005;97(24):1808–1815. [DOI] [PubMed] [Google Scholar]
- 20. Rimm DL. What brown cannot do for you. Nat Biotechnol. 2006;24(8):914–916. [DOI] [PubMed] [Google Scholar]
- 21. Perez EA, Press MF, Dueck AC. Immunohistochemistry and fluorescence in situ hybridization assessment of HER2 in clinical trials of adjuvant therapy for breast cancer (NCCTG N9831, BCIRG 006, and BCIRG 005). Breast Cancer Res Treat. 2013;138(1):99–108. [DOI] [PMC free article] [PubMed] [Google Scholar]
Associated Data
This section collects any data citations, data availability statements, or supplementary materials included in this article.