

Abstract
Background:
Fibrinogen-like protein 2 (FGL2) may promote glioblastoma multiforme (GBM) cancer development by inducing multiple immune-suppression mechanisms.
Methods:
The biological significance of FGL2 expression was assessed using the The Cancer Genome Atlast (TCGA) glioma database and tumor lysates analysis. The therapeutic effects of an anti-Fgl2 antibody and the role of immune suppression regulation by Fgl2 were determined in immune-competent, NOD-scid IL2Rgammanull (NSG), and FcɣRIIB-/- mice (n = 3–18 per group). Data were analyzed with two-way analysis of variance, log-rank survival analysis, and Pearson correlation. All statistical tests were two-sided.
Results:
In low-grade gliomas, 72.5% of patients maintained two copies of the FGL2 gene, whereas 83.8% of GBM patients had gene amplification or copy gain. Patients with high levels of FGL2 mRNA in glioma tissues had a lower overall survival (P = .009). Protein levels of FGL2 in GBM lysates were higher relative to low-grade glioma lysates (11.48±5.75ng/mg vs 3.96±1.01ng/mg, P = .003). In GL261 mice treated with an anti-FGL2 antibody, median survival was 27 days compared with only 17 days for mice treated with an isotype control antibody (P = .01). The anti-FGL2 antibody treatment reduced CD39+ Tregs, M2 macrophages, programmed cell death protein 1 (PD-1), and myeloid-derived suppressor cells (MDSCs). FGL2-induced increases in M2, CD39, and PD-1 were ablated in FcɣRIIB-/- mice.
Conclusions:
FGL2 augments glioma immunosuppression by increasing the expression levels of PD-1 and CD39, expanding the frequency of tumor-supportive M2 macrophages via the FcγRIIB pathway, and enhancing the number of MDSCs and CD39+ regulatory T cells. Collectively, these results show that FGL2 functions as a key immune-suppressive modulator and has potential as an immunotherapeutic target for treating GBM.
Glioblastoma multiforme (GBM) is the most common and aggressive malignant brain tumor in humans and even with aggressive surgery, radiation, and chemotherapy has a median survival of only 14.6 months (1). In GBM, the presence of multiple, redundant immune-suppressive mechanisms, such as immunosuppressive cells (CD4+CD25+FoxP3+ regulatory T cells [Treg], tumor-supportive M2 macrophages, and myeloid-derived suppressor cells [MDSCs]), immunosuppressive cytokines (TGF-β, IL-10 and PGE2), and immune checkpoints (PD-L1, PD-1, and CTLA-4), reduces the efficiency of immunotherapy (2–7). Monoclonal antibodies (mAbs) targeting immune checkpoints are now a standard of care for melanoma patients (8); however, these mAbs must be combined with other immunotherapeutic strategies to suppress glioma growth in preclinical murine models (7,9,10). Clinical studies of checkpoint inhibitors are underway in GBM patients (11), but the success of immunotherapy will depend upon in-depth understanding of immunology in the brain and GBM microenvironment to unveil the key regulatory hubs of immunosuppressive mechanisms.
Fibrinogen-like protein 2 (FGL2), a member of the fibrinogen-like protein family, possesses prothrombinase activity and immune regulatory functions in viral infection, allograft rejection, and abortion (12,13). Some investigators have suggested that FGL2 acts as a Treg effector molecule by suppressing T-cell activities in a FoxP3-dependent manner (14,15). Others have found that FGL2 suppresses dendritic cell (DC) and B cell functions by binding to FcγRIIB (16,17). Furthermore, emerging data demonstrates that FGL2 regulates adaptive immunity via Th1 and Th2 cytokines (18). Recent studies have also shown that FGL2 can promote hepatocellular carcinoma xenograft tumor growth and angiogenesis, suggesting a tumor-promoting function (19,20). However, these studies were conducted in immune-deficient mice, which does not account for the immune regulatory role of FGL2 in tumor progression (19,20).
Both murine glioma models and human glioma patient samples were used to test the hypothesis that FGL2 might promote GBM by inducing immune suppression mechanisms in the tumor microenvironment. These studies revealed that FGL2 increases glioma growth in murine models by enhancing immune checkpoint gene expression and infiltration of immunosuppressive cells in the tumor microenvironment. Neutralization of the FGL2 protein by an anti-FGL2 antibody prolonged survival time in immune-competent mice harboring GL261 gliomas, but this effect was abolished in immune-deficient NSG mice. Consistent with the hypothesis that FGL2 may play a role in GBM progression, the expression levels of FGL2 positively correlated with glioma grade in patients. Collectively, these data show that FGL2 can function as a promoter of GBM progression by upregulating negative immune checkpoint expression and may be a therapeutic target.
Methods
cBioPortal for Cancer Genomics
Gene expression data and survival were obtained from the The Cancer Genome Atlas (TCGA) portal (http://www.cbioportal.org/public-portal/Accessed May 1, 2015) (see Figure 1 legend). Pearson’s correlation coefficients were calculated between the immune checkpoints/cytokines and FGL2 gene expression using R statistical computing (21).
Figure 1.

The gene expression (mRNA) level of FGL2 and prognosis in glioblastoma multiforme (GBM) patients. A) Plots showing copy-number analysis of the FGL2 gene in tumors from the low-grade glioma (n = 262) and glioblastoma multiforme (n = 136) databases. These levels are derived from the GISTIC copy-number analysis algorithms and indicate the copy-number level per gene. Chi-square test: P < .001. B) The overall survival rates of GBM patients were stratified by FGL2 gene expression levels. Data on survival of GBM patients and FGL2 mRNA expression data were downloaded and retrieved from the The Cancer Genome Atlas data portal (https://tcga-data.nci.nih.gov/tcga/dataAccessMatrix.htm Accessed May 1, 2015). GBM patients were grouped by FGL2 gene expression level: the 50% of patients top ranked for FGL2 levels were placed in the FGL2High group and the lowest ranked 50% of patients in the FGL2Low group. FGL2 = Fibrinogen-like protein 2.
Human Samples
Sample collection was conducted under protocol #LAB03-0687, which was approved by the institutional review board of The University of Texas M.D. Anderson Cancer Center (M.D. Anderson) after informed consent was obtained. Patients’ tumors with matched serum samples were graded pathologically (n = 20) by a neuropathologist according to the World Health Organization classification (22).
Gene Constructs and Transfection
The pBMN-GFP and pBMN-FGL2 expression vectors were constructed by standard subcloning procedures (23). Transfection was carried out using lipofectamine 2000 according to the manufacturer’s instructions (Invitrogen). Stable clones were obtained using puromycin selection for two weeks (22). Further details are provided in the Supplementary Methods (available online).
Animals
C57BL/6J, BALB/c, and NOD.Cg-Prkdcscid Il2rgtm1Wjl /SzJ (NSG) female mice from the Jackson Laboratory, and FcɣRIIB-/- mice from Taconic Biosciences, all age six to eight weeks, were used in the experimental procedures. All mice were maintained and were treated in accordance with the guidelines approved by the Institutional Animal Care and Use Committee (IACUC). Further details are provided in the Supplementary Methods (available online).
Flow Cytometry
Tumor or brain tissues were minced and enzymatically digested to obtain single cell suspensions (24, 25). Brain-infiltrating lymphocytes were isolated according to previously published protocol (26). Briefly, a single-cell suspension was centrifuged through a 30% Percoll gradient at 7800g for 30 minutes. The lymphocyte layer was collected, centrifuged, and washed. Cell surface staining was performed with FITC, PerCP/Cy5.5, or Brilliant Violet 421-labeled anti-CD4, anti-CD25, anti-CD11b, anti-F4/80, anti-Gr1.1, anti-PD-L1, anti-PD-1, anti-CD39, anti-CD206, and anti-CD45 Abs (mouse monoclonal, 1:50, BioLegend, California) (26,27). For intracellular staining, cells were fixed and permeabilized, and then incubated with PerCP/Cy5.5-labled anti-Foxp3 antibody (mouse monoclonal, 1:25, BioLegend, California). Stained cells were analyzed with flow cytometry, and the data were presented using FlowJo software.
Statistical Analysis
All quantified data are presented as mean ± standard deviation or as indicated. Differences in the experimental means for flow cytometric and cytokine values were considered statistically significant if P values were less than .05 as determined using unpaired t test. Differences in the distribution of FGL2 gene copy number in the human gliomas were considered by chi-square analysis at P values under .05. Associations between the FGL2 level and clinic pathological characteristics were analysed by Fisher’s exact test. A two way analysis of variance (ANOVA) was used to analyze tumor volume difference between groups. Differences in survival curves were considered statistically significant by the log-rank survival analysis at P values under .05. All statistical analyses were conducted using GraphPad Prism 6 (GraphPad Software, La Jolla, CA), except for the Pearson’s correlation coefficients, which were performed by SPSS version 22 (IBM Corporation, Armonk, NY). All statistical tests were two-sided.
Results
Association of FGL2 Expression With Glioma Grade and Poor Prognosis in GBM
The TCGA database was used to evaluate the association between the gene copy number of FGL2 and glioma grade. In low-grade gliomas, 72.5% of patients maintained two copies of the FGL2 gene (diploid), whereas 83.8% of GBM patients had either a gene amplification or copy gain (Figure 1A) (P < .001). To study the potential association between gene expression level of FGL2 and survival time of GBM patients, patients were ranked by FGL2 mRNA expression level, with the top ranked 50% of patients placed in the FGL2High group and the lower ranked 50% of patients in the FGL2Low group (Figure 1B). Log-rank (Mantel-Cox) analysis of survival times revealed that patients from the FGL2High group had a lower overall survival rate than patients in the FGL2Low group (P = .009). The median survival time for FGL2low and FGL2high expression is 394 days and 357 days, respectively. The estimated five-year survival rate was 4.98% for FGL2low patients and 0.99% for FGL2high patients.
The expression levels of FGL2 protein in three human glioblastoma cell lines (LN18, U87, and U251) and three glioblastoma cancer stem cell lines (gCSC13, gCSC811, and gCSC929) were also higher than in fibroblast cell lines (MRC5 and WI38) (Figure 2A). To investigate the expression status of FGL2 in human gliomas, seven low-grade glioma tumors and 13 GBMs were collected and analyzed (Figure 2B). Consistent with the data found in tumor cells, the levels of FGL2 protein in GBM tumors were statistically higher relative to low-grade gliomas (mean ± SD: 11.48±5.75ng/mg vs 3.96±1.01ng/mg, P = .003). Further investigation into the association of FGL2 level with clinicopathological characteristics of patients revealed that the levels of FGL2 protein in glioma lysates were statistically significantly associated with tumor grade (P = .003, Fisher’s exact test) (Table 1) but not tumor size or patient sex. Likewise, an increased level of Fgl2 was also detected in GBM patients compared with low-grade glioma patients or healthy donors (mean ± SD: 46.9±20.1ng/mL vs 37.4±21.5ng/mL or 35.6±8.8ng/mL, P = .08) (Supplementary Figure 1, avaialble online).
Figure 2.

The expression level of FGL2 protein in glioma cell lines and tumor lysate from glioblastoma patients. A) FGL2 protein levels were detected by western blot in fibroblast cells (MRC5 and WI38), glioblastoma cancer cell lines (LN18, U87, and U251), or glioblastoma cancer stem cells (gCSC13, gCSC811, and gCSC929). B) Expression level of FGL2 protein in tumor lysate of glioblastoma (grade: IV) patients and low-grade glioma (grade: I~III) patients. FGL2 was measured in tumor tissue lysate from glioblastoma patients (n = 13) and low-grade glioma patients (n = 7) using an enzyme-linked immunosorbent assay (ELISA) kit. Data were presented as the mean ± SD. An unpaired t test was used to calculate the two-sided P values.
Table 1.
Association between FGL2 levels in brain tumor tissue and clinicopathological characteristics*
| Variables | No. of patients | P | |
|---|---|---|---|
| FGL2 low | FGL2 high | ||
| Age, y | |||
| <60 | 8 | 3 | .0698 |
| ≥60 | 2 | 7 | |
| Sex | |||
| Female | 3 | 5 | .6499 |
| Male | 7 | 5 | |
| Tumor grade | |||
| I~III | 7 | 0 | .0031 |
| IV | 3 | 10 | |
| Tumor size, cm | |||
| ≤5 | 4 | 6 | 1.000 |
| >5 | 4 | 4 | |
* Brain tumor patients were grouped by FGL2 protein expression level in tumor lysate: the 50% of patients top ranked for FGL2 levels were placed in the FGL2-high group and the lowest ranked 50% of patients in the FGL2-low group. Associations between FGL2 level and clinicopathological characteristics of patients were analysed by Fisher’s exact test (n = 20). FGL2 = Fibrinogen-like protein 2.
FGL2 and Glioma Tumor Growth
To ascertain the functional role of FGL2 in glioma biology, the effect of FGL2 expression levels on tumor growth kinetics was studied. Unlike human GBM, murine glioma cell lines express low levels of FGL2 protein when cultured in vitro (Figure 3A); therefore, delayed brain tumor (DBT) glioma cells were genetically engineered to express FGL2 while GFP-expressing DBT cells were used as a control cell line (mean ± SD: 6.9±1.7 vs 1.0±0.0, P = .03) (Figure 3A). The FGL2-engineered DBT cells (DBT-FGL2) secreted 68ng/mL of FGL2, whereas FGL2 was undetectable in the control cells. Serum FGL2 was elevated in mice harboring DBT-FGL2 cells relative to DBT-GFP cells (mean ± SD: 44.5±5.7ng/mL vs 35.4±1.3, P = .02) (Figure 3B). Correspondingly, DBT-FGL2 had an increased growth rate relative to DBT-GFP in vivo (Figure 3, C-E) although the proliferation rates in vitro were the same (Figure 3F). Consistent with the larger tumor volume, DBT-FGL2 tumors had more mass than DBT-GFP tumors at the completion of the experiment (0.10±0.02 vs 0.33±0.14g, P = .04) (Figure 3E). Importantly, the difference in tumor progression between DBT-FGL2 and DBT-GFP cells no longer exists in immune-deficient NSG mice (Figure 3, G-I).
Figure 3.

Overexpressed FGL2 protein and glioma growth in mice. DBT or GL261 were stably transfected to overexpress FGL2 or GFP with pBMP vectors. All experiments were replicated at least twice. A) Expression of FGL2 in DBT-GFP cells and DBT-FGL2 cells was detected by western blotting. B) Expression levels of FGL2 were detected by ELISA in the serum of glioma-bearing mice. Data were presented as the mean ± SD (n = 3). C) Growth curve of DBT-GFP and DBT-FGL2 cells in BALB/C mice. DBT-GFP or DBT-FGL2 tumor cells were injected into the flank of BALB/C mice (n = 3). The volumes of subcutaneous tumors were measured twice per week. Data were presented as the mean ± SD. Two-way analysis of variance (ANOVA) was used to calculate the two-sided P values (*P < .05, ***P < .001 vs DBT-GFP). D) Photograph of representative DBT-GFP and DBT-FGL2 tumors in BALB/C mice. E) Tumor weight of DBT-GFP and DBT-FGL2 tumors in BALB/C mice. Data were presented as the mean ± SD (n = 3). F) Proliferation curve of DBT-GFP and DBT-FGL2 cells in vitro. The experiment was repeated three times. Data were presented as the mean ± SD. G) The growth curve of DBT-GFP and DBT-FGL2 tumors in NSG mice. DBT-GFP or DBT-FGL2 cells were injected into the flank of NSG mice (n = 3). The volumes of subcutaneous tumors were measured twice per week. Two-way ANOVA was used to calculate the two-sided P values. Error bars are SD. H) Photograph of representative DBT-GFP and DBT-FGL2 tumors in NSG mice. I) Tumor weight of DBT-GFP and DBT-FGL2 tumors in NSG mice. Data were presented as the mean ± SD (n = 3). An unpaired t test was used to calculate the two-sided P values.
FGL2 as an Immunosuppressive Hub
To determine if FGL2 exerts multimodality modulation of GBM-mediated immune suppression, the expression of FGL2 was correlated with immune checkpoints (PD-1, PD-L1, CTLA-4), CD39, B- and T-lymphocyte attenuator (BTLA), lymphocyte-activation gene 3 (LAG3), transforming growth factor-β1 (TGF-β1), and interleukin-10 (IL-10) by applying Pearson’s correlation analysis (Figure 4). Except for CTLA-4 (P = .67) (Figure 4G), there is a statistically significant positive correlation between FGL2 expression and PD-L2 (Figure 4B), PD-1 (Figure 4C), CD39 (Figure 4D), BTLA (Figure 4E), LAG3 (Figure 4F), IL-10 (Figure 4I), and TGFβ1 (Figure 4H) (correlation is statistically significant at a P value of .01 [two-tailed]).
Figure 4.

Correlation analysis of mRNA expression levels between FGL2 and immune suppressive checkpoints and cytokines in glioblastoma multiforme (GBM) tumors. The Pearson test was used to analyze the correlation between gene expression of the immunosuppressive mediators (programmed death-ligand 1 [PD-L1, A], programmed death-ligand 2 [PD-L2, B], programmed cell death protein 1 [PD-1, C], CD39 [D], B- and T-lymphocyte attenuator [BTLA, E], lymphocyte-activation gene 3 [LAG3, F], cytotoxic T-lymphocyte-associated protein 4 [CTLA-4, G], transforming growth factor-β1 [TGF- β1, H], interleukin-10 [IL-10, I]) and FGL2. mRNA expression data for these genes were downloaded from the GBM database. R = Pearson correlation coefficient.
To validate the observed correlations from humans specimens, the murine subcutaneous gliomas generated by DBT-FGL2 and DBT-GFP were used to ascertain if similar assocations were present. Consistent with the human data, the expression levels of PD-1 and CD39 in CD45+ cells were statistically increased in DBT-FGL2 relative to DBT-GFP tumors (Figure 5A). Furthermore, the number of immune suppressive CD4+CD39+Foxp3+ Tregs (CD39+ Tregs) was higher in DBT-FGL2 tumors (mean ± SD: 0.38±0.05%) than in DBT-GFP tumors (0.22±0.03%) (Figure 5B), suggesting that FGL2 also augments CD39+ Tregs in the tumor microenvironment. Moreover, there was a statistically significant increase in the CD11b+Gr1+ population (MDSCs) in the DBT-FGL2 tumor microenvironment (mean ± SD: 54.86±3.38%) relative to DBT-GFP tumors (26.94±5.70%) (Figure 5B). Finally, DBT-FGL2 tumors had an increased F4/80+CD206+ population (M2) (27,28) in the tumor microenvironment (Figure 5B), which may indicate that FGL2 facilates M2 polarization in tumors. Together, these data show that FGL2 augments immunosuppression in the tumor microenvironment.
Figure 5.
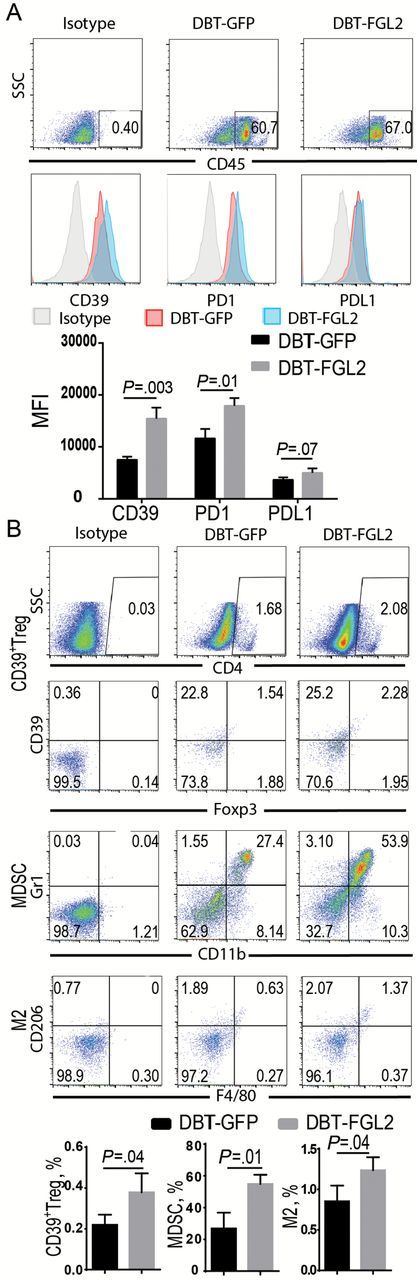
FGL2-augmented immunosuppression in the DBT tumor microenvironment. DBT-GFP and DBT-FGL2 glioma tissues in BALB/C mice were digested, and single-cell suspensions were collected for staining and analysis by fluorescence-activated cell sorting (FACS). A) CD39, PD-1, and PD-L1 expression levels in CD45+ cells were detected by FACS. The expression levels were presented as mean fluorescence intensity (MFI). Data were presented as the mean ± SD (n = 3). B) CD39+Tregs (CD4+CD39+Foxp3+), myeloid-derived suppressor cells (MDSCs, CD11b+Gr1+), and M2 macrophage (F4/80+CD206+) were detected by FACS. The levels of these cells were presented as the percentage of cells. Data were presented as the mean ± SD (n = 3) and analyzed by unpaired t test.
Next, the association between FGL2 overexpression and increased immunosuppression was determined in an orthotopic brain tumor model. Tumors developing from FGL2-overexpressing GL261 glioma cells had increased PD-1 and CD39 expression in CD45+ leukocytes relative to those from GL261-GFP control tumors (Figure 6A). Additionally, the frequency of MDSC and M2 cells was markedly increased in brain-infiltrating lymphocytes in mice inoculated with GL261-FGL2 cells compared with those inoculated with GL261-GFP control cells (Figure 6B), indicating that FGL2 induces immune suppression regardless of the in vivo location.
Figure 6.
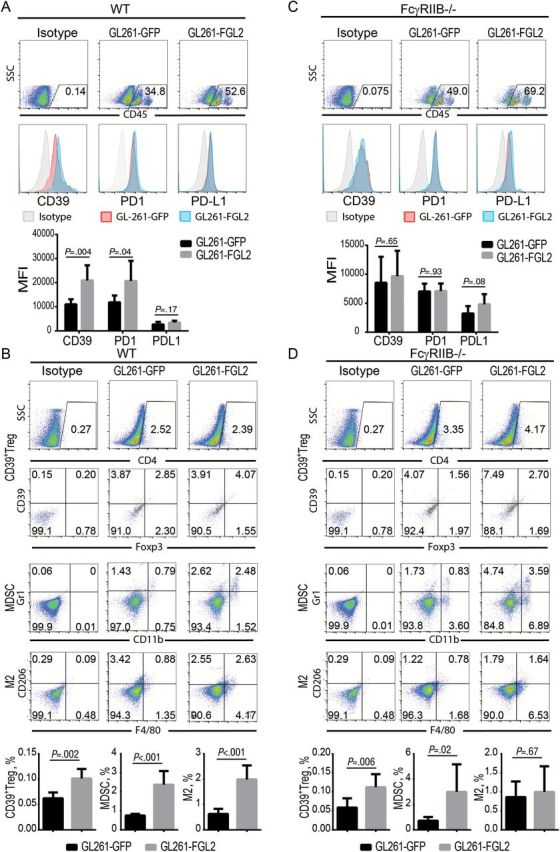
Effect of FcγRIIB deficiency on FGL2-mediated immunosuppression in tumor microenvironment. GL261-GFP and GL261-FGL2 glioma tissues from mice were digested and the brain infiltrating lymphocytes were purified for staining and analysis by FACS two weeks post-tumor inoculation. CD39, PD-1, and PD-L1 expression levels in CD45+ cells, CD39+Tregs (CD4+CD39+Foxp3+), myeloid-derived suppressor cells (MDSCs, CD11b+Gr1+), and M2 macrophage (F4/80+CD206+) were detected by FACS. All experiments were replicated twice. A) Expression level of CD39, PD-1, and PD-L1 in GL261-GFP glioma and GL261-FGL2 glioma of WT (C57BL/6J) mice. Data were presented as the mean ± SD (n = 6). B) CD39+Tregs (CD4+CD39+Foxp3+), myeloid-derived suppressor cells (MDSCs, CD11b+Gr1+), and M2 macrophage (F4/80+CD206+) populations in GL261-GFP glioma and GL261-FGL2 glioma of WT mice. Data were presented as the mean ± SD (n = 6). C) Expression levels of CD39, PD-1, and PD-L1 in GL261-GFP glioma and GL261-FGL2 glioma of FcγRIIB-/- mice. Data were presented as the mean ± SD (n = 8). D) CD39+Tregs (CD4+CD39+Foxp3+), myeloid-derived suppressor cells (MDSCs, CD11b+Gr1+), and M2 macrophage (F4/80+CD206+) populations in GL261-GFP glioma and GL261-FGL2 glioma of FcγRIIB-/- mice. Data were presented as the mean ± SD (n = 8) and analyzed by unpaired t test.
FcγRIIB is the receptor of FGL2 (17); thus, FcγRIIB-/- mice were used to investigate the dependence of the Fgl2-FcγRIIB signaling axis on producing FGL2-mediated immunosuppression in glioma. Indeed, the absence of FcγRIIB impeded the induction of CD39 and PD-1 expression (Figure 6C) and totally abolished the presence of M2 cells by FGL2 in the glioma microenvironment (Figure 6D). However, there was still an increase of CD39+ Tregs and the MDSC population in the GL261-FGL2 tumors relative to GL261-GFP tumors in FcγRIIB-/- mice (Figure 6D). These data suggest that the CD39 and PD-1 expression and M2 polarization induced by FGL2 are mediated by the FcγRIIB pathway, whereas MDSC and Treg induction by FGL2 likely does not depend on the FcγRIIB signal pathway.
Effect of Blocking FGL2 on Survival of GL261 Glioma-Bearing Mice and Immunosuppression
At baseline, nontreated, non–tumor bearing mice express FGL2 in the serum at only 29.5±2.59ng/mL; however, glioma-bearing mice regardless of treatment with control IgG or anti-FGL2 antibody have statistically significantly increased FGL2 levels in the serum (mean ± SD: 53.8±9.53 and 56.5±5.78ng/mL, respectively) (Figure 7A). To test if a first-generation FGL2 antibody could exert a proof-of-principal therapeutic effect, immune-competent C57BL/6 mice harboring intracerebral GL261 gliomas were treated twice per week and monitored for survival. The median survival time was statistically significantly longer in mice treated with an anti-FGL2 antibody relative to those treated with an IgG control antibody (27 days and 17 days, respectively, P = .01) (Figure 7B). Interestingly, four of seventeen anti-FGL2-treated mice (23.5%) were completely tumor free. Furthermore, the anti-FGL2 antibody treatment suppressed M2 and MDSC accumulation as well as CD39 and PD-1 induction (Figure 7, C-F), though the FGL2 antibody treatment did not statistically significantly reduce the level of FGL2 in the serum, suggesting that FGL2 antibody blocked the function of FGL2 in these mice. Collectively, the results show that FGL2 is a potential therapeutic target for treating GBM.
Figure 7.
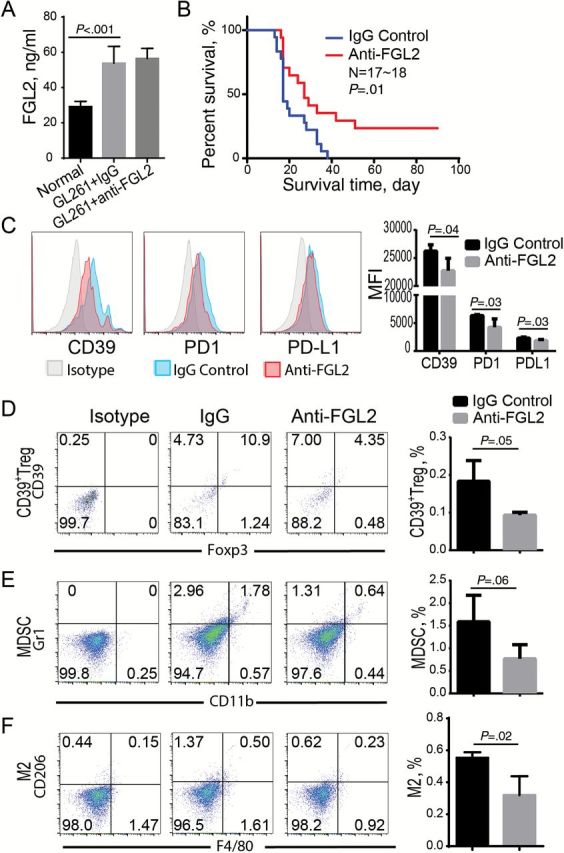
Effect of anti-FGL2 antibody on GL261-induced immunosuppression and survival in tumor-bearing mice. GL261 tumor-bearing mice were treated with anti-FGL2 (100 ug/kg) or IgG control antibody twice per week. All experiments were replicated at least twice. A) The level of FGL2 in the serum of GL261-bearing mice. Data were presented as the mean ± SD (n = 6). B) The survival of GL261 glioma-bearing mice treated with anti-FGL2 antibody or IgG control (n = 17~18). Log-rank test was used to compare overall survival between groups. C-F) Immune suppressive checkpoints and cells in the tumor microenvironment were analyzed by FACS after treatment with anti-FGL2 or IgG control antibody. CD39, PD-1, and PD-L1 expression levels in CD45+ cells (C), CD39+Tregs (CD4+CD39+Foxp3+) (D), myeloid-derived suppressor cells (MDSCs, CD11b+Gr1+) (E), and M2 macrophage (F4/80+CD206+) (F) were detected by FACS. Data were presented as the mean ± SD (n = 4). An unpaired t test was used to calculate the two-sided P values.
Discussion
FGL2 has previously been shown to be upregulated in a number of other human malignancies (12,19,29). This report is the first showing that FGL2 is commonly expressed in human gliomas and FGL2 expression is associated with glioma grade. Previously, FGL2 had been shown to promote Treg activities, suppress Th1 and enhance Th2 skewing, and downregulate antigen presentation activity (16,30–33). This report markedly expands these findings to show that FGL2 also regulates immune checkpoints and augments intratumoral MDSC and M2 skewing. More specifically, FGL2 induces CD39 expression in CD45+ lymphocytes within the tumor microenvironment. The induction of CD39 is important because CD39 ultimately converts ATP to adenosine (34,35), which is a potent suppressor of T cell activation and effector function (36). Furthermore, CD39 can enhance the conversion of M1 into tumor-promoting M2 tumor-associated macrophages (37) and augment tumor supportive activities of MDSC (38). The reduction of CD39 expression in FcγRIIB-/- mice was associated with the suppression of FGL2-mediated M2 accumulation in the glioma. Tumor-associated macrophages frequently exhibit an M2 phenotype that supports angiogenesis and invasiveness in tumors (6,39,40). Blocking M2 polarization with the inhibitor CSF-1R has been shown to suppress glioma growth (6). The data show that targeting FGL2-induced M2 polarization is a viable therapeutic approach. Alternatively, FGL2 could mediate M2 polarization secondarily via modulation of Th2 cytokine elaboration (41). FGL2 can suppress production of the Th1 cytokines IL-2 and IFN-γ while enhancing Th2 cytokines such as IL-4 and IL-10 (18). FGL2-/- mice express high levels of Th1 cytokines, such as IFN-γ, and low levels of the Th2 cytokine IL-4 (33). Of course, FGL2 may induce M2 polarization by both aforementioned mechanisms and this hypothesis will be tested in the future.
Besides modulating M2 polarization, FGL2 also exerts multimodality effects on immune checkpoints, MDSCs, and Tregs. PD-1 is expressed on activated T and B lymphocytes, plays a pivotal role in down regulating antitumor immune responses (42), and is operational within GBM patients (43,44). We found that FGL2 induces PD-1 expression on CD45+ lymphocytes compounding glioma-mediated immune suppression. Furthermore, we found that FGL2 increased the number of MDSCs in glioma tissues. MDSCs can promote tumor development via T-cell suppression-dependent and -independent mechanisms (45). In human GBM, expanded populations of circulating MDSCs have been observed (46). Our studies show that the increase in MDSCs was not suppressed in FcγRIIB-/- mice, suggesting that this FGL2-mediated induction is independent of CD39 and PD-1 induction by FGL2. Although the FGL2-engineered gliomas had no effect on nTreg (natural Treg) number (data not shown), the number of CD39+ Tregs increased. This increase in CD39+ Tregs cells has been previously documented in human malignant gliomas (35,47) and CD39-/- Tregs possess a reduced immune suppressive capacity (38). Furthermore, the suppressive function of Tregs has previously been shown to be abolished in FGL2-/- mice (30). Reciprocally, FGL2, CD73, CD39, and CTLA-4 are upregulated by Foxp3 in Tregs (48). Cumulatively, these prior reports are consistent with FGL2 being a key hub of tumor-mediated immune suppression.
Limitations of the current study are that the exact mechanisms of immune suppression induced by FGL2, such as the signal pathway, were not examined and a therapeutic product will require further development. A humanized antihuman FGL2 antibody with a blocking effect will be needed for clinical application. The immune-regulatory effects of FGL2 on glioma progression have not been examined; however, anti-FGL2 treatment appears to be a promising strategy—especially given the role of FGL2 in glioma-mediated immune suppression. It is well known that cancers evade immune surveillance by exploiting a series of immune editing mechanisms to evade immune detection and eradication (49,50). One important mechanism is to hijack an immune cell’s intrinsic checkpoints and/or subvert the immune system to be tumor supportive and/or propagative. Blocking FGL2 has therapeutic promise for cancer immunotherapy based on its role as a global mediator of tumor-mediated immune suppression.
Funding
This work was supported by National Institutes of Health (NIH) grants CA120895, CA1208113, P50 CA127001, and CA16672. The University of Texas MD Anderson Cancer Center Multidisciplinary Research Program (MRP) mechanism also provided supplemental financial support.
Supplementary Material
All authors participated in the design of the study, interpretation of the results, and writing of the manuscript. We thank Mr. David Wildrick and Dr. Jeffery J. Cutrera for editorial assistance. gCSCs were provided by Dr. Frederick Lang, and DBT cell was from Dr. Leonid Metelitsa. Data on survival of glioblastoma multiforme patients and FGL2 mRNA expression data were downloaded and retrieved by Dr. Fei Wang.
References
- 1. Johnson DR, O’Neill BP. Glioblastoma survival in the United States before and during the temozolomide era. J Neurooncol. 2011;107(2):359–364. [DOI] [PubMed] [Google Scholar]
- 2. Jackson C, Ruzevick J, Phallen J, et al. Challenges in immunotherapy presented by the glioblastoma multiforme microenvironment. Clin Dev Immunol. 2011;2011:732413. [DOI] [PMC free article] [PubMed] [Google Scholar]
- 3. Pellegatta S, Cuppini L, Finocchiaro G. Brain cancer immunoediting: novel examples provided by immunotherapy of malignant gliomas. Expert Rev Anticancer Ther. 2011;11(11):1759–1774. [DOI] [PubMed] [Google Scholar]
- 4. Wainwright DA, Nigam P, Thaci B, et al. Recent developments on immunotherapy for brain cancer. Expert Opin Emerg Drugs. 2012;17(2):181–202. [DOI] [PMC free article] [PubMed] [Google Scholar]
- 5. Jia W, Jackson-Cook C, Graf MR. Tumor-infiltrating, myeloid-derived suppressor cells inhibit T cell activity by nitric oxide production in an intracranial rat glioma + vaccination model. J Neuroimmunol. 2010;223(1–2):20–30. [DOI] [PMC free article] [PubMed] [Google Scholar]
- 6. Pyonteck SM, Akkari L, Schuhmacher AJ, et al. CSF-1R inhibition alters macrophage polarization and blocks glioma progression. Nat Med. 2013;19(10):1264–1272. [DOI] [PMC free article] [PubMed] [Google Scholar]
- 7. Wainwright DA, Chang AL, Dey M, et al. Durable therapeutic efficacy utilizing combinatorial blockade against IDO, CTLA-4 and PD-L1 in mice with brain tumors. Clin Cancer Res. 2014;20(20):5290–5301. [DOI] [PMC free article] [PubMed] [Google Scholar]
- 8. Hodi FS, O’Day SJ, McDermott DF, et al. Improved survival with ipilimumab in patients with metastatic melanoma. N Engl J Med. 2010;363(8):711–723. [DOI] [PMC free article] [PubMed] [Google Scholar]
- 9. Vom Berg J, Vrohlings M, Haller S, et al. Intratumoral IL-12 combined with CTLA-4 blockade elicits T cell-mediated glioma rejection. J Exp Med. 2013;210(13):2803–2811. [DOI] [PMC free article] [PubMed] [Google Scholar]
- 10. Castro MG, Baker GJM, Lowenstein PR. Blocking Immunosuppressive Checkpoints for Glioma Therapy: The More the Merrier! Clin Cancer Re.s 2014;20(2):5147–5149. [DOI] [PMC free article] [PubMed] [Google Scholar]
- 11. Ahn BJ, Pollack IF, Okada H. Immune-checkpoint blockade and active immunotherapy for glioma. Cancers (Basel). 2013;5(4):1379–1412. [DOI] [PMC free article] [PubMed] [Google Scholar]
- 12. Shalev I, Selzner N, Helmy A, et al. The Role of FGL2 in the Pathogenesis and Treatment of Hepatitis C Virus Infection. Rambam Maimonides Med J. 2010;1(1):e0004. [DOI] [PMC free article] [PubMed] [Google Scholar]
- 13. Hu J, Yan J, Rao G, et al. The Duality of Fgl2 - Secreted Immune Checkpoint Regulator Versus Membrane-Associated Procoagulant: Therapeutic Potential and Implications. Int Rev Immunol. 2014; In press. [DOI] [PMC free article] [PubMed] [Google Scholar]
- 14. Williams LM, Rudensky AY. Maintenance of the Foxp3-dependent developmental program in mature regulatory T cells requires continued expression of Foxp3. Nat Immunol. 2007;8(3):277–284. [DOI] [PubMed] [Google Scholar]
- 15. Zheng Y, Josefowicz SZ, Kas A, et al. Genome-wide analysis of Foxp3 target genes in developing and mature regulatory T cells. Nature. 2007;445(7130):936–940. [DOI] [PubMed] [Google Scholar]
- 16. Chan CW, Kay LS, Khadaroo RG, et al. Soluble fibrinogen-like protein 2/fibroleukin exhibits immunosuppressive properties: suppressing T cell proliferation and inhibiting maturation of bone marrow-derived dendritic cells. J Immunol. 2003;170(8):4036–4044. [DOI] [PubMed] [Google Scholar]
- 17. Liu H, Shalev I, Manuel J, et al. The FGL2-FcgammaRIIB pathway: a novel mechanism leading to immunosuppression. Eur J Immunol. 2008;38(11):3114–3126. [DOI] [PubMed] [Google Scholar]
- 18. Joller N, Lozano E, Burkett PR, et al. Treg cells expressing the coinhibitory molecule TIGIT selectively inhibit proinflammatory Th1 and Th17 cell responses. Immunity. 2014;40(4):569–581. [DOI] [PMC free article] [PubMed] [Google Scholar]
- 19. Su K, Chen F, Yan WM, et al. Fibrinogen-like protein 2/fibroleukin prothrombinase contributes to tumor hypercoagulability via IL-2 and IFN-gamma. World J Gastroenterol. 2008;14(39):5980–5989. [DOI] [PMC free article] [PubMed] [Google Scholar]
- 20. Liu Y, Xu L, Zeng Q, et al. Downregulation of FGL2/prothrombinase delays HCCLM6 xenograft tumour growth and decreases tumour angiogenesis. Liver Int. 2012;32(10):1585–1595. [DOI] [PubMed] [Google Scholar]
- 21. Ladha J, Sinha S, Bhat V, et al. Identification of genomic targets of transcription factor AEBP1 and its role in survival of glioma cells. Mol Cancer Res. 2012;10(8):1039–1051. [DOI] [PubMed] [Google Scholar]
- 22. Louis DN, Ohgaki H, Wiestler OD, et al. The 2007 WHO classification of tumours of the central nervous system. Acta Neuropathol. 2007;114(2):97–109. [DOI] [PMC free article] [PubMed] [Google Scholar]
- Schatton T, Schutte U, Frank NY, et al. Modulation of T-cell activation by malignant melanoma initiating cells. Cancer Res. 2010;70(2):697–708. [DOI] [PMC free article] [PubMed] [Google Scholar]
- 23. Hu J, Vien LT, Xia X, et al. Generation of a monoclonal antibody against the glycosylphosphatidylinositol-linked protein Rae-1 using genetically engineered tumor cells. Biol Proced Online. 2014;16(1):3. [DOI] [PMC free article] [PubMed] [Google Scholar]
- 24. Schatton T, Schutte U, Frank NY, et al. Modulation of T-cell activation by malignant melanoma initiating cells. Cancer Res. 2010;70(2):697–708. [DOI] [PMC free article] [PubMed] [Google Scholar]
- 25. Mitra A, Mishra L, Li S. Technologies for deriving primary tumor cells for use in personalized cancer therapy. Trends Biotechnol. 2013;31(6):347–354. [DOI] [PMC free article] [PubMed] [Google Scholar]
- 26. LaFrance-Corey RG, Howe CL. Isolation of brain-infiltrating leukocytes. J Vis Exp. 2011; 10.3791/2747(52). [DOI] [PMC free article] [PubMed] [Google Scholar]
- 27. Luo Y, Zhou H, Krueger J, et al. Targeting tumor-associated macrophages as a novel strategy against breast cancer. J Clin Invest. 2006;116(8):2132–2141. [DOI] [PMC free article] [PubMed] [Google Scholar]
- 28. Fridlender ZG, Jassar A, Mishalian I, et al. Using macrophage activation to augment immunotherapy of established tumours. Br J Cancer. 2013;108(6):1288–1297. [DOI] [PMC free article] [PubMed] [Google Scholar]
- 29. Yuwaraj S, Ding J, Liu M, et al. Genomic characterization, localization, and functional expression of FGL2, the human gene encoding fibroleukin: a novel human procoagulant. Genomics. 2001;71(3):330–338. [DOI] [PubMed] [Google Scholar]
- 30. Shalev I, Wong KM, Foerster K, et al. The novel CD4+CD25+ regulatory T cell effector molecule fibrinogen-like protein 2 contributes to the outcome of murine fulminant viral hepatitis. Hepatology. 2009;49(2):387–397. [DOI] [PubMed] [Google Scholar]
- 31. Foerster K, Helmy A, Zhu Y, et al. The novel immunoregulatory molecule FGL2: a potential biomarker for severity of chronic hepatitis C virus infection. J Hepatol. 53(4):608–615. [DOI] [PubMed] [Google Scholar]
- 32. Zhao Z, Yang C, Wang L, et al. The regulatory T cell effector soluble fibrinogen-like protein 2 induces tubular epithelial cell apoptosis in renal transplantation. Exp Biol Med (Maywood). 2013;239(2):193–201. [DOI] [PubMed] [Google Scholar]
- 33. Shalev I, Liu H, Koscik C, et al. Targeted deletion of fgl2 leads to impaired regulatory T cell activity and development of autoimmune glomerulonephritis. J Immunol. 2008;180(1):249–260. [DOI] [PubMed] [Google Scholar]
- 34. Regateiro FS, Cobbold SP, Waldmann H. CD73 and adenosine generation in the creation of regulatory microenvironments. Clin Exp Immunol. 2013;171(1):1–7. [DOI] [PMC free article] [PubMed] [Google Scholar]
- 35. Xu S, Shao QQ, Sun JT, et al. Synergy between the ectoenzymes CD39 and CD73 contributes to adenosinergic immunosuppression in human malignant gliomas. Neuro Oncol. 2013;15(9):1160–11672. [DOI] [PMC free article] [PubMed] [Google Scholar]
- 36. Ohta A, Sitkovsky M. Extracellular adenosine-mediated modulation of regulatory T cells. Front Immunol. 2014;5:304. [DOI] [PMC free article] [PubMed] [Google Scholar]
- 37. Dwyer KM, Deaglio S, Gao W, et al. CD39 and control of cellular immune responses. Purinergic Signal. 2007;3(1–2):171–180. [DOI] [PMC free article] [PubMed] [Google Scholar]
- 38. Antonioli L, Pacher P, Vizi ES, et al. CD39 and CD73 in immunity and inflammation. Trends Mol Med. 2013;19(6):355–367. [DOI] [PMC free article] [PubMed] [Google Scholar]
- 39. Garris C, Pittet MJ. Therapeutically reeducating macrophages to treat GBM. Nat Med. 2013;19(10):1207–1208. [DOI] [PubMed] [Google Scholar]
- 40. Seton-Rogers S. Tumour microenvironment: Teaching old macrophages new tricks. Nat Rev Cancer. 2013;13(11):753. [DOI] [PubMed] [Google Scholar]
- 41. Biswas SK, Mantovani A. Macrophage plasticity and interaction with lymphocyte subsets: cancer as a paradigm. Nat Immunol. 2010;11(10):889–896. [DOI] [PubMed] [Google Scholar]
- 42. Nishimura H, Nose M, Hiai H, et al. Development of lupus-like autoimmune diseases by disruption of the PD-1 gene encoding an ITIM motif-carrying immunoreceptor. Immunity. 1999;11(2):141–151. [DOI] [PubMed] [Google Scholar]
- 43. Parsa AT, Waldron JS, Panner A, et al. Loss of tumor suppressor PTEN function increases B7-H1 expression and immunoresistance in glioma. Nat Med. 2007;13(1):84–88. [DOI] [PubMed] [Google Scholar]
- 44. Kingwell K. Neuro-oncology: Glioblastoma prognosis linked to neuronal PD-L1 expression in tumour-adjacent tissue. Nat Rev Neurol. 2013;9(11):602–603. [DOI] [PubMed] [Google Scholar]
- 45. Kohanbash G, McKaveney K, Sakaki M, et al. GM-CSF promotes the immunosuppressive activity of glioma-infiltrating myeloid cells through interleukin-4 receptor-alpha. Cancer Res. 2013;73(21):6413–6423. [DOI] [PMC free article] [PubMed] [Google Scholar]
- 46. Mirghorbani M, Van Gool S, Rezaei N. Myeloid-derived suppressor cells in glioma. Expert Rev Neurother. 2013;13(12):1395–1406. [DOI] [PubMed] [Google Scholar]
- 47. Kmiecik J, Poli A, Brons NH, et al. Elevated CD3+ and CD8+ tumor-infiltrating immune cells correlate with prolonged survival in glioblastoma patients despite integrated immunosuppressive mechanisms in the tumor microenvironment and at the systemic level. J Neuroimmunol. 2013;264(1–2):71–83. [DOI] [PubMed] [Google Scholar]
- 48. Gavin MA, Rasmussen JP, Fontenot JD, et al. Foxp3-dependent programme of regulatory T-cell differentiation. Nature. 2007;445(7129):771–775. [DOI] [PubMed] [Google Scholar]
- 49. Smyth MJ, Dunn GP, Schreiber RD. Cancer immunosurveillance and immunoediting: the roles of immunity in suppressing tumor development and shaping tumor immunogenicity. Adv Immunol. 2006;90:1–50. [DOI] [PubMed] [Google Scholar]
- 50. Dunn GP, Bruce AT, Ikeda H, et al. Cancer immunoediting: from immunosurveillance to tumor escape. Nat Immunol. 2002;3(11):991–998. [DOI] [PubMed] [Google Scholar]
Associated Data
This section collects any data citations, data availability statements, or supplementary materials included in this article.