Implementation of clinical decision support (CDS) on the basis of high-quality evidence was associated with a significant decrease in the use of CT pulmonary angiographic imaging for acute pulmonary embolism in hospitalized patients that occurred within the first 30 days after implementation of CDS.
Abstract
Purpose
To determine the effect of clinical decision support (CDS) on the use and yield of inpatient computed tomographic (CT) pulmonary angiography for acute pulmonary embolism (PE).
Materials and Methods
This HIPAA-compliant, institutional review board-approved study with waiver of informed consent included all adults admitted to a 793-bed teaching hospital from April 1, 2007, to June 30, 2012. The CDS intervention, implemented after a baseline observation period, informed providers who placed an order for CT pulmonary angiographic imaging about the pretest probability of the study based on a validated decision rule. Use of CT pulmonary angiographic and admission data from administrative databases was obtained for this study. By using a validated natural language processing algorithm on radiology reports, each CT pulmonary angiographic examination was classified as positive or negative for acute PE. Primary outcome measure was monthly use of CT pulmonary angiography per 1000 admissions. Secondary outcome was CT pulmonary angiography yield (percentage of CT pulmonary angiographic examinations that were positive for acute PE). Linear trend analysis was used to assess for effect and trend differences in use and yield of CT pulmonary angiographic imaging before and after CDS.
Results
In 272 374 admissions over the study period, 5287 patients underwent 5892 CT pulmonary angiographic examinations. A 12.3% decrease in monthly use of CT pulmonary angiography (26.0 to 22.8 CT pulmonary angiographic examinations per 1000 admissions before and after CDS, respectively; P = .008) observed 1 month after CDS implementation was sustained over the ensuing 32-month period. There was a nonsignificant 16.3% increase in monthly yield of CT pulmonary angiography or percentage of CT pulmonary angiographic examinations positive for acute PE after CDS (P = .65).
Conclusion
Implementation of evidence-based CDS for inpatients was associated with a 12.3% immediate and sustained decrease in use of CT pulmonary angiographic examinations in the evaluation of inpatients for acute PE.
© RSNA, 2015
Introduction
Despite substantial benefits of medical imaging, concerns persist about inappropriate use that may result in waste, suboptimal quality of care, and, in the case of computed tomographic (CT) imaging, potentially harmful ionizing radiation (1,2). The Health Information Technology and Economic Health (HITECH) Act of 2009 aimed to encourage broad adoption of health information technology tools to improve quality and reduce waste, in part through the use of clinical decision support (CDS) that presents evidence in real time to providers at the point of care to improve clinical decision making. CDS is a fundamental component in stage 2 of the meaningful use criteria in the HITECH Act regulations (3,4).
From when it was initially proposed and studied (5,6), large-scale deployment of imaging CDS was reported (7). Imaging CDS and CDS-enabled interventions have been associated with reductions in use of imaging and improved appropriateness (8–13). Although condition-specific imaging CDS interventions for outpatients (9) and in the emergency department (ED) (10) have been reported, reports on inpatient interventions are lacking.
CT pulmonary angiographic imaging is the examination of choice to diagnose acute pulmonary embolism (PE) (14), and its use for this purpose is increasing in both ED and inpatient settings (10,15,16). Increase in use of CT pulmonary angiographic imaging has been associated with increased radiation exposure (17) and overdiagnosis of less clinically important PE (18). Evidence-based guidelines for imaging patients suspected of having PE have been derived and validated (14,19–20). Appropriate use of CT pulmonary angiography is also the focus of national initiatives, including the Choosing Wisely campaign, which is endorsed by a number of medical specialty societies (21). The National Quality Forum endorsed an imaging efficiency quality metric directed at CT pulmonary angiography appropriateness in ED patients with low pretest probability of PE (22). It was postulated (23) that compliance with this quality measure could reduce so-called avoidable imaging in low-risk ED patients by 32% by implementing evidence-based guidelines because CDS is associated with decreased use and increased yield (defined as the percentage of CT pulmonary angiographic examinations positive for acute PE) in the ED (10).
The purpose of our study was to determine the effect of CDS on use and yield of inpatient CT pulmonary angiographic imaging for acute PE.
Materials and Methods
Study Setting and Patients
This Health Insurance Portability and Accountability Act–compliant study was approved by the institutional review board with a waiver of informed consent. The study population included patients who were hospitalized between April 1, 2007, and June 30, 2012, at a 793-bed urban teaching hospital with over 50 000 annual admissions. We included all patients older than 16 years and we excluded those in hospice care.
Data Control and Collection
R.K. is a consultant to Medicalis Corporation. Control of data and information was solely the responsibility of authors who are not consultants to industry whose product was evaluated in our study (Percipio; Medicalis, San Francisco, Calif).
Monthly admission data were gathered from an administrative claims database. We reviewed our institutional radiology information system to determine which inpatients underwent CT pulmonary angiographic imaging during the study period and excluded studies ordered in the ED before admission. We recorded the following patient-related variables: age, sex, diagnosis of neoplasm within 1 year before CT examination, previous history of thromboembolism, and history of surgery within 4 weeks of the CT pulmonary angiographic examination. Age, sex, surgical history, and d-dimer status and level were obtained from the electronic medical record. Data regarding a patient’s history of neoplasm and thromboembolism were obtained from the hospital billing system by using the International Classification of Diseases, ninth revision, codes 140–239 (neoplasms); 451.0–451.9, 452, 453.0–453.9, and 557.0 (venous thrombosis); and 415.1–415.9 (PE).
For each completed CT pulmonary angiographic examination, we used a natural language processing algorithm based on General Architecture for Text Engineering (University of Sheffield, South Yorkshire, England) to classify the examination as either positive or negative for acute PE based on binary outcome analysis of the radiology reports. The natural language algorithm was previously validated and published for CT pulmonary angiographic reports in the ED population with indeterminate or limited examinations categorized as negative (10).
Intervention
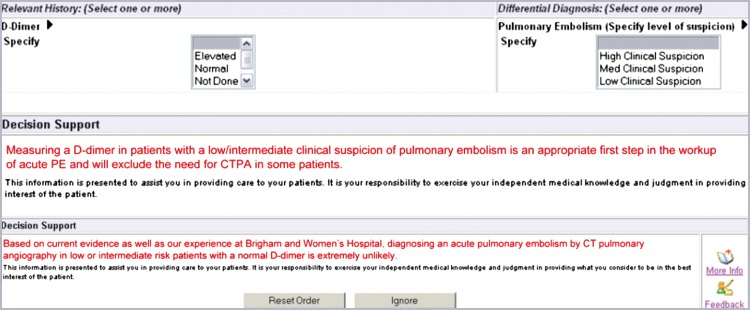
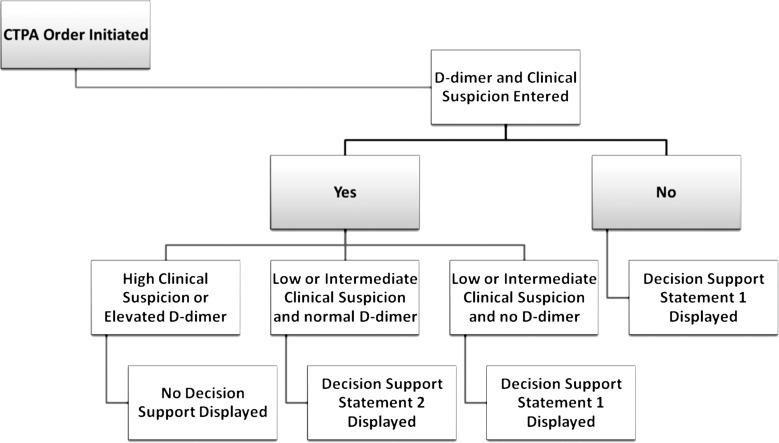
The CDS intervention informed providers of the patient-specific pretest probability for PE based on a previously validated decision rule (9) when they submitted an order for a CT pulmonary angiographic examination. These decision rules were incorporated into CDS delivered by using the institution’s computerized physician order entry system (Percipio; Medicalis, San Francisco, Calif). Details of this system were previously reported (7). The CDS had three stages (Figs 1, 2). The first stage required the physician who submitted the order for the examination to select both the clinical suspicion of PE (low, intermediate, or high) and a d-dimer level. The second stage displayed a statement for patients with an intermediate or low level of clinical suspicion of PE in whom a d-dimer assay was not performed (Fig 1). The third stage displayed a statement for patients with a normal d-dimer level and intermediate or low clinical suspicion for PE (Fig 1). At each stage, the ordering physician had the option to cancel the imaging order or to ignore the advice. If the advice was ignored, no further action was required before placement of the order.
Figure 1:
Screen capture of d-dimer level and clinical suspicion data entry tools and CDS statements. CDS statements are shown. CTPA = CT pulmonary angiography.
Figure 2:
Flowchart shows the CDS process. Decision support statement 1: Measuring a d-dimer in patients with a low/intermediate clinical suspicion of pulmonary embolism is an appropriate first step in the workup of acute PE and will exclude the need for CTPA in some patients. Decision support statement 2: Based on current evidence as well as our experience at Brigham and Women’s Hospital, diagnosing an acute pulmonary embolism by CT pulmonary angiography in low- or intermediate-risk patients with a normal d-dimer is extremely unlikely. CTPA = CT pulmonary angiography.
Study Design and Outcomes
By using a before-and-after design, we compared outcomes before and after implementation of the CDS intervention on November 1, 2009. The primary outcome measure was monthly use intensity of inpatient CT pulmonary angiographic imaging, defined as the number of CT pulmonary angiographic examinations performed per month per 1000 inpatient admissions. The secondary outcome was the imaging yield. We also analyzed monthly CT pulmonary angiographic imaging use and yield before and after intervention, stratified by clinical specialty of the ordering providers. The clinical specialty of the ordering providers was categorized as follows: surgery, medicine, hematology and oncology, and other clinical specialty. Outcomes were analyzed on a monthly basis to allow evaluation of the immediate (within the first 30 days) effect of the CDS intervention. In addition, we performed a posthoc electronic medical record analysis of patients in our postintervention cohort with a normal d-dimer level (<500 ng/mL) whose subsequent CT pulmonary angiographic examination was positive for PE to determine pretest probability of PE based on previously validated evidence-based guidelines for imaging of patients suspected of having PE (19).
Statistical Analysis
A power calculation estimated the sample size required to detect a 5% effect size, or a relative difference of 5% in use of CT pulmonary angiography between the periods before and after implementation of CDS. Monthly use of CT pulmonary angiography was estimated to be 25.0 studies per 1000 inpatient admissions. A sample size of 675 patients in each period before and after CDS would provide 90% power (α = .05; two-tailed test) to reject the null hypothesis.
For the primary outcome, we performed linear trend analyses by using a multiple linear regression model by constructing two separate best-fit lines, one each for the preintervention and postintervention periods. This analysis allowed us to evaluate the immediate effect of CDS on use and yield of CT pulmonary angiography, and to compare trends in use and yield between the preimplementation and postimplementation periods. Our data set consisted of 63 sequentially numbered observations, and each represented a calendar month during the study period. For use of CT pulmonary angiography, the dependent or outcome variable was number of CT pulmonary angiographic examinations performed per month per 1000 inpatient admissions. For CT pulmonary angiography yield, the dependent variable was monthly percentage of positive CT pulmonary angiography studies. The independent or predictor variables included time, intervention, and an interaction term (intervention · time). We used the following model to perform our estimations: Yi = α1 + β1Ti + β2Ii + β3Oi + εI, where Yi is the estimated monthly CT pulmonary angiography use or yield, α1 is intercept term (procedure volume or yield at month 0), Ti is month (n = 1–32), Ii is intervention (denoted as a binary variable: 0 or 1), Oi is interaction term (intervention · time) and εi is the error term. In terms of regression coefficients, β1 represents the difference in predicted value of Yi for each one unit difference in Ti; β2 represents the difference in predicted value of Yi for each one unit difference in Ii; and β3 represents the difference in predicted value of Yi for each one unit difference in Oi.
To determine the immediate effect of CDS, we calculated Yi by using both the preintervention and postintervention best-fit lines before and after month 31 (when use of CDS began) of 63 months. To compare the trends in use, before and after intervention, we compared the slopes of the preintervention and postintervention best-fit lines before and after month 31.
Additional analysis was performed by using Student t test to compare continuous variables and χ2 test was used to compare categorical variables between the preintervention and postintervention groups.
A two-tailed P value of less than .05 indicated statistical significance. All analyses were conducted by using statistical software (JMP 10.0; SAS institute, Cary, NC).
Results
Use of CT Pulmonary Angiography
In 227 374 eligible admissions during the complete study period, 5287 patients underwent 5892 CT pulmonary angiographic studies and an average of 1138 studies were performed per year. Patient-related characteristics before and after intervention were similar, other than a statistically significant difference in the history of previous venous thromboembolism (25% before CDS compared with 30% after CDS) (Table 1). d-dimer testing was not routinely performed before CT pulmonary angiography; 2604 of 3037 (85.7%) patients in the preintervention cohort and 2474 of 2825 (87.6%) patients in the postintervention cohort did not undergo d-dimer testing (Table 1). Among 73 patients with a normal d-dimer level (<500 ng/mL), subsequent CT pulmonary angiographic imaging showed PE in two (2.7%) patients in the postintervention cohort. When the medical records of the patients were reviewed, one patient had an intermediate pretest probability of PE based on previously validated evidence-based guidelines for imaging of patients suspected of having PE (19) and had an acute segmental PE based on CT pulmonary angiography report. The other patient underwent CT pulmonary angiographic imaging for evaluation of newly diagnosed pulmonary arterial hypertension. The CT pulmonary angiographic report was consistent with PE and likely chronic; however, subsequent invasive pulmonary angiographic imaging did not show PE.
Table 1.
Patient-related Characteristics per Study before and after Implementation of Evidence-based CDS
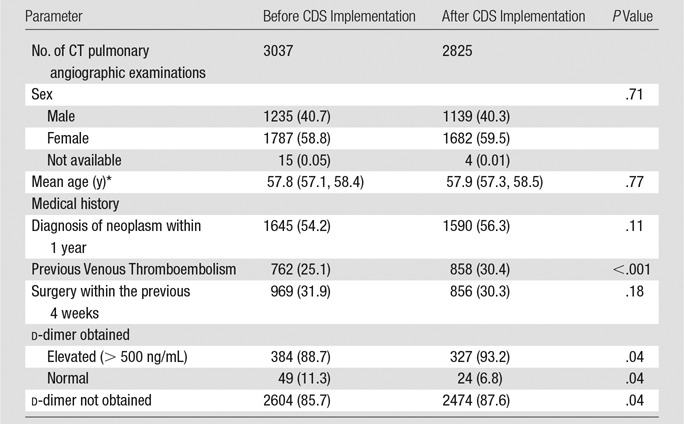
Note.—Data in parentheses are percentages except where otherwise indicated. There were 433 patients in whom d-dimer was obtained before CDS implementation and 351 patients in whom d-dimer was obtained after CDS implementation.
Data in parentheses are confidence intervals.
Mean monthly use of CT pulmonary angiographic imaging was 102.4 studies before intervention and 85.0 studies after intervention. When adjusted for monthly admissions, the mean monthly use of CT pulmonary angiographic imaging was 26.8 examinations per 1000 inpatient admissions before intervention and 22.6 examinations per 1000 inpatient admissions after intervention. This represented a relative reduction in use of 15.7% (26.8 − 22.6/26.8 · 100) (Table E1 [online]).
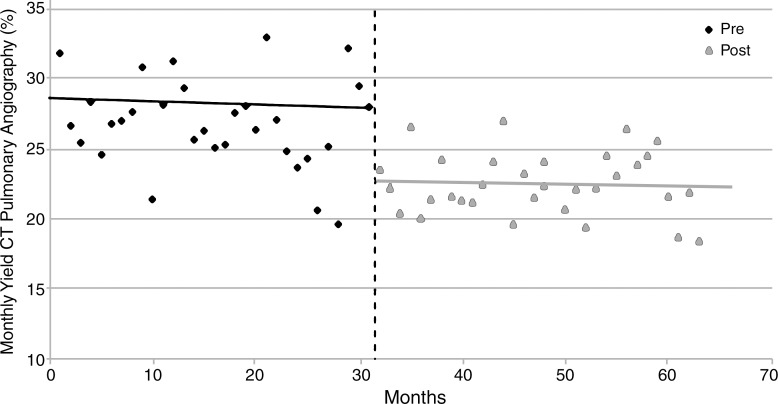
Based on the best-fit line from the preintervention period, use of CT pulmonary angiographic imaging in the month before intervention was estimated to be 26.0 examinations per 1000 admissions (Table 2; Table E2 [online]). By using a similar estimate based on postintervention period monthly use, estimated use of CT pulmonary angiographic imaging in the month immediately after intervention was 22.8 examinations per 1000 admissions (Table 2). This represented a significant relative reduction of 12.3% (P = .008) (Fig 3). There was no significant increase or decrease in use of CT pulmonary angiographic imaging in the periods before (April 1, 2007, to October 31, 2009) and after CDS implementation (November 1, 2009, to June 30, 2012 [P = .52]), which signified a sustained effect of CDS (Table 2). No significant difference in use of CT pulmonary angiographic imaging by clinician specialty was observed (Table 3).
Table 2.
Regression Model Results for Monthly Use and Yield of CT Pulmonary Angiography before and after Implementation of Evidence-based CDS
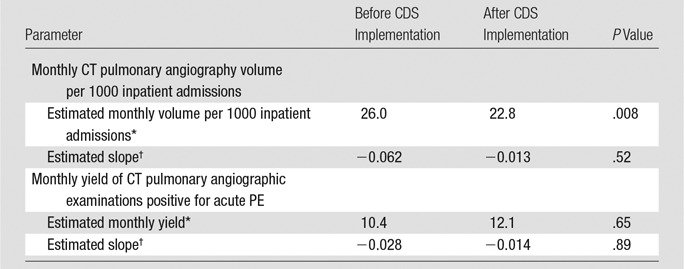
Found by the following equation: (Yi) = α1 + β1Ti + β2Ii + β3Oi
Found by the following equation: β1Ti + β2Ii + β3Oi
Figure 3:
Graph shows linear trend analysis for use of CT pulmonary angiographic imaging before (pre) and after (post) implementation of CDS.
Table 3.
Comparison of Monthly Use and Yield of CT Pulmonary Angiography before and after Implementation of Evidence-based CDS Stratified by Ordering Provider Subspecialty
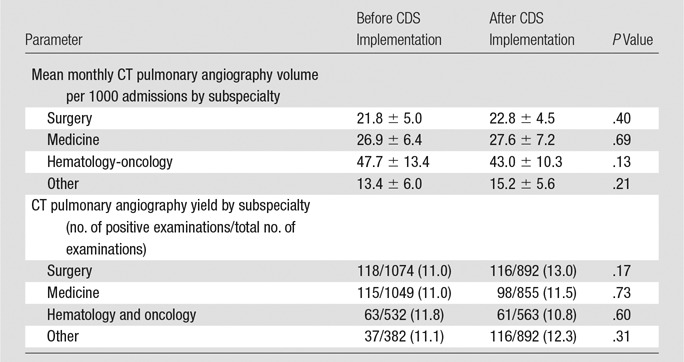
Note.—Data are ± standard deviation where applicable; data in parentheses are percentages.
CT Pulmonary Angiography Yield
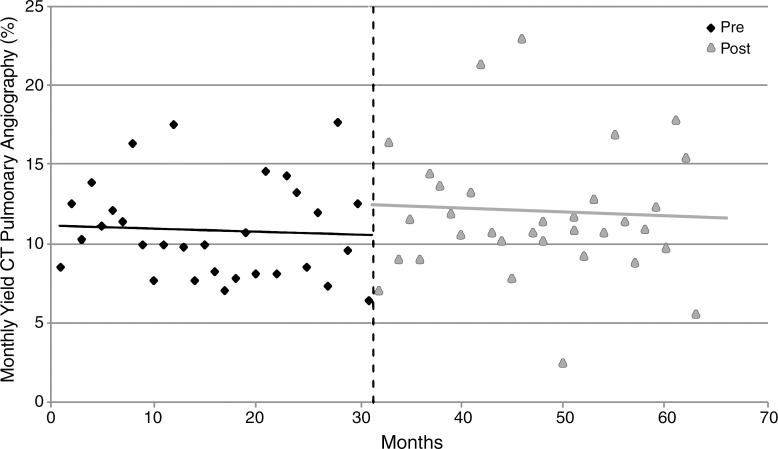
Of 5892 CT pulmonary angiographic examinations performed during the study period, 666 (11.3%) examinations were positive for PE. Based on the best-fit line from the preintervention period, the estimated monthly yield of CT pulmonary angiographic examinations or percentage of CT pulmonary angiographic examinations positive for acute PE in the month before implementation of CDS was 10.4% (Table 2; Table E2 [online]). Based on the best-fit line after intervention, the estimated monthly yield changed from 12.1% in the month after CDS implementation (Table 2; Table E2 [online]), a relative increase of 16.3% ([12.1 − 10.4/10.4] · 100); this difference was not statistically significant (P = .65) (Fig 4). There was no statistically significant increase or decrease in yield of CT pulmonary angiographic examinations in the periods before and after CDS implementation (P = .89). No significant difference in yield according to clinician specialty was observed (Table 3).
Figure 4:
Graph shows linear trend analysis for yield of CT pulmonary angiographic imaging before (pre) and after (post) implementation of CDS.
Discussion
We found that implementation of evidence-based CDS on the basis of a validated decision rule was associated with a significant immediate (12.3%) and sustained decrease in use of CT pulmonary angiographic examinations for evaluation of PE in hospitalized patients. An increase in yield of CT pulmonary angiographic imaging after intervention was not statistically significant. Our results suggest that the adoption of CDS on the basis of high-quality evidence can have an immediate significant effect on study ordering in the inpatient setting,
Our results differ from reported effect of CDS on use of CT pulmonary angiographic imaging in the ED. A study (10) reporting a 20.1% decrease in use of CT pulmonary angiographic imaging in the ED after CDS implementation with a concomitant educational campaign showed a gradual decline in the use of CT pulmonary angiographic imaging over a 2-year period after implementation of CDS. However, a 4-month study (15) did not find a decrease in the use of CT pulmonary angiographic imaging after implementation of CDS in the ED at another institution. Although our study does not allow for direct comparison, we believe this apparent variation in the effect of CDS in different care settings, even on the basis of the same validated decision rule, has important potential implications. It is likely that education-only CDS interventions (with no consequences to ordering providers who ignore the evidence presented in the CDS) will result in heterogeneous acceptance of CDS by providers depending on many factors, including care setting or level of training. Consequences for ignoring evidence may be needed to potentiate the effect of CDS in reducing unwarranted variations in care (9,12,24).
The observed 15.7% overall relative reduction in use of CT pulmonary angiographic imaging after CDS was greater than the estimated 12.3% reduction of use of CT pulmonary angiographic imaging within 30 days after CDS. Although this finding may represent a slight gradual decline in use of CT pulmonary angiographic imaging over the study period, the finding was not statistically significant. Our analysis showed a static trend in use of CT pulmonary angiographic imaging before CDS implementation without a significant change in the use trend before and after implementation of CDS. This is contrary to previous reports of increasing use of CT pulmonary angiographic imaging to evaluate patients suspected of having acute PE in both the ED (10,15,25) and inpatient settings (16). The static trend in use of CT pulmonary angiographic imaging before and after CDS at our institution may have been because of external and institution-specific factors, such as temporal changes in use of CT pulmonary angiographic imaging that were from increased emphasis within the medical literature and general media regarding the risks of medical radiation, increased knowledge of prediction rules to assess probability for acute PE, the effect of learning within our institution because of implementation of a similar CDS tool in our ED 27 months before the current study, and our institution’s established culture of quality. However, the immediate effect of our intervention observed within the first 30 days of CDS implementation argues against contribution of secular trends to our results.
While the yield of CT pulmonary angiographic imaging increased by 16.3%, this difference was not statistically significant, and our overall yield was lower than that of a previous study that reported a yield of 13.5% after implementation of risk stratification in 981 hospitalized patients who underwent CT pulmonary angiographic examinations because they were suspected of having PE (26). Our experience also differs from the findings in previous ED studies that reported increases in yield of CT pulmonary angiographic imaging for PE of between 50% and 81% after implementation of CDS (10,15,27). Our results may be explained in part by an institution-wide initiative that promoted venous thromboembolism prophylaxis in hospitalized patients, which was implemented during our study period. The effect of this concomitant intervention may have decreased the overall prevalence of venous thromboembolism in hospitalized patients at our institution and therefore masked a potentially greater increase in yield of CT pulmonary angiographic imaging after implementation of CDS than we observed.
Within our patient cohort, d-dimer testing was not routinely performed before CT pulmonary angiographic imaging. However, studies have shown that the use of d-dimer testing, in combination with a clinical decision rule that was incorporated in our intervention, may be used effectively to exclude PE in the inpatient population (28–30).
We observed a greater proportion of patients with a previous history of venous thromboembolism in our postintervention cohort. We suggest this observation is likely related to our intervention because patients without history of venous thromboembolic disease, a recognized risk factor for PE, were less likely to undergo CT pulmonary angiography than were those with known venous thromboembolic disease.
Our study had several limitations. First, it was performed at a single institution and so results may not be generalizable. Because our institution is a quaternary care hospital with a large oncology center, the risk for and incidence of thromboembolic disease in our patients may be higher than at other hospitals. Second, although our study demonstrated a sustained decline in use of CT pulmonary angiographic imaging after implementation of CDS, inclusion of control data from a similar institution where the CDS was not implemented would have better allowed us to account for potential secular changes in use of CT pulmonary angiographic imaging over the study period. In addition, the methodologic structure of our study precluded collection of additional patient characteristics, including heart rate, probability of an alternative diagnosis than PE, and direct evaluation of laboratory values including d-dimer level. Therefore, we were not able to independently apply established evidence-based criteria (19) to evaluate the appropriateness of performing CT pulmonary angiography and were only able to determine its use and yield. However, we believe the frequency of clinicians entering erroneous clinical information when ordering imaging studies to bypass perceived intrusive CDS interactions to be small (31). We were also unable to determine whether any patients had missed PE as a result of our CDS intervention because we did not have longitudinal data regarding a large portion of our cohort. These include patients with PE who did not undergo CT pulmonary angiographic imaging because the ordering physician accepted the evidence presented in CDS and cancelled the CT request, because the ordering physician decided not to obtain the CT after they learned about evidence from previous interaction with CDS in a different patient, or because the ordering physician conceivably avoided the computer interactions presented in CDS. The observed 16.3% increase in yield of CT pulmonary angiographic imaging was likely not statistically significant because our study was powered to detect a change in use, and therefore underpowered to detect a significant increase in yield of CT pulmonary angiography, given the overall low number of positive CT pulmonary angiographic studies during the study period. Similarly, our analysis of effect of CDS by ordering provider specialty was likely underpowered.
In conclusion, implementation of CDS on the basis of high-quality evidence was associated with a statistically significant decrease in the use of CT pulmonary angiographic imaging for acute PE in hospitalized patients that occurred within the first 30 days after implementation of CDS. This decrease in use was sustained over the ensuing 32 months. Imaging CDS and CDS-enabled interventions may provide an effective strategy to reduce waste, improve quality of care, and reduce unnecessary radiation exposure for hospitalized patients.
Advance in Knowledge
■ Implementation of evidence-based clinical decision support (CDS) was associated with a significant (12.3% decrease, from 26.0 to 22.8 CT pulmonary angiographic examinations per 1000 admissions before and after CDS, respectively; P = .008) immediate (within 1 month) and sustained (over the 32-month study period) decrease in use of CT pulmonary angiographic imaging for evaluation of acute pulmonary embolism in hospitalized patients.
Implication for Patient Care
■ Adoption of CDS on the basis of high-quality evidence can have an immediate and significant effect on the use of CT pulmonary angiographic imaging in the inpatient setting, with the potential to improve efficiency of care and reduce potentially unnecessary radiation exposure to patients.
SUPPLEMENTAL FIGURE
Received May 24, 2014; revision requested July 10; revision received September 22; accepted October 10; final version accepted November 17.
Funding: This research was supported by the National Institutes of Health (grants T15LM007092 and 1UC4EB012952-01).
Abbreviations:
- CDS
- clinical decision support
- ED
- emergency department
- HITECH
- Health Information Technology and Economic Health
- PE
- pulmonary embolism
Disclosures of Conflicts of Interest: R.M.D. disclosed no relevant relationships. I.K.I. disclosed no relevant relationships. S.A. disclosed no relevant relationships. E.F.G. disclosed no relevant relationships. A.S.R. disclosed no relevant relationships. A.H. disclosed no relevant relationships. R.K. Financial activities related to the present article: disclosed no relevant relationships. Financial activities not related to the present article: author disclosed acting as a consultant for Medicalis and author reported patents for Medicalis. Other relationships: disclosed no relevant relationships.
References
- 1.Brenner DJ, Hall EJ. Computed tomography—an increasing source of radiation exposure. N Engl J Med 2007;357(22):2277–2284. [DOI] [PubMed] [Google Scholar]
- 2.Sodickson A, Baeyens PF, Andriole KP, et al. Recurrent CT, cumulative radiation exposure, and associated radiation-induced cancer risks from CT of adults. Radiology 2009;251(1):175–184. [DOI] [PubMed] [Google Scholar]
- 3.Office of the National Coordinator for Health Information Technology (ONC), Department of Health and Human Services. Health information technology: standards, implementation specifications, and certification criteria for electronic health record technology, 2014 edition; revisions to the permanent certification program for health information technology. Final rule. Fed Regist 2012;77(171):54163–54292. [PubMed] [Google Scholar]
- 4.Blumenthal D. Launching HITECH. N Engl J Med 2010;362(5):382–385. [DOI] [PubMed] [Google Scholar]
- 5.Khorasani R. Computerized physician order entry and decision support: improving the quality of care. RadioGraphics 2001;21(4):1015–1018. [DOI] [PubMed] [Google Scholar]
- 6.Harpole LH, Khorasani R, Fiskio J, Kuperman GJ, Bates DW. Automated evidence-based critiquing of orders for abdominal radiographs: impact on utilization and appropriateness. J Am Med Inform Assoc 1997;4(6):511–521. [DOI] [PMC free article] [PubMed] [Google Scholar]
- 7.Ip IK, Schneider LI, Hanson R, et al. Adoption and meaningful use of computerized physician order entry with an integrated clinical decision support system for radiology: ten-year analysis in an urban teaching hospital. J Am Coll Radiol 2012;9(2):129–136. [DOI] [PubMed] [Google Scholar]
- 8.Vartanians VM, Sistrom CL, Weilburg JB, Rosenthal DI, Thrall JH. Increasing the appropriateness of outpatient imaging: effects of a barrier to ordering low-yield examinations. Radiology 2010;255(3):842–849. [DOI] [PubMed] [Google Scholar]
- 9.Blackmore CC, Mecklenburg RS, Kaplan GS. Effectiveness of clinical decision support in controlling inappropriate imaging. J Am Coll Radiol 2011;8(1):19–25. [DOI] [PubMed] [Google Scholar]
- 10.Raja AS, Ip IK, Prevedello LM, et al. Effect of computerized clinical decision support on the use and yield of CT pulmonary angiography in the emergency department. Radiology 2012;262(2):468–474. [DOI] [PMC free article] [PubMed] [Google Scholar]
- 11.Wasser EJ, Prevedello LM, Sodickson A, Mar W, Khorasani R. Impact of a real-time computerized duplicate alert system on the utilization of computed tomography. JAMA Intern Med 2013;173(11):1024–1026. [DOI] [PMC free article] [PubMed] [Google Scholar]
- 12.Ip IK, Schneider L, Seltzer S, et al. Impact of provider-led, technology-enabled radiology management program on imaging. Am J Med 2013;126(8):687–692. [DOI] [PubMed] [Google Scholar]
- 13.Shinagare AB, Ip IK, Abbett SK, Hanson R, Seltzer SE, Khorasani R. Inpatient imaging utilization: trends of the last decade. AJR Am J Roentgenol 2014;202(3):W277–W283. [DOI] [PubMed] [Google Scholar]
- 14.Remy-Jardin M, Pistolesi M, Goodman LR, et al. Management of suspected acute pulmonary embolism in the era of CT angiography: a statement from the Fleischner Society. Radiology 2007;245(2):315–329. [DOI] [PubMed] [Google Scholar]
- 15.Drescher FS, Chandrika S, Weir ID, et al. Effectiveness and acceptability of a computerized decision support system using modified Wells criteria for evaluation of suspected pulmonary embolism. Ann Emerg Med 2011;57(6):613–621. [DOI] [PubMed] [Google Scholar]
- 16.Prologo JD, Gilkeson RC, Diaz M, Asaad J. CT pulmonary angiography: a comparative analysis of the utilization patterns in emergency department and hospitalized patients between 1998 and 2003. AJR Am J Roentgenol 2004;183(4):1093–1096. [DOI] [PubMed] [Google Scholar]
- 17.Smith-Bindman R, Miglioretti DL, Johnson E, et al. Use of diagnostic imaging studies and associated radiation exposure for patients enrolled in large integrated health care systems, 1996-2010. JAMA 2012;307(22):2400–2409. [DOI] [PMC free article] [PubMed] [Google Scholar]
- 18.Wiener RS, Schwartz LM, Woloshin S. When a test is too good: how CT pulmonary angiograms find pulmonary emboli that do not need to be found. BMJ 2013;347:f3368. [DOI] [PMC free article] [PubMed] [Google Scholar]
- 19.Wells PS, Ginsberg JS, Anderson DR, et al. Use of a clinical model for safe management of patients with suspected pulmonary embolism. Ann Intern Med 1998;129(12):997–1005. [DOI] [PubMed] [Google Scholar]
- 20.Stein PD, Fowler SE, Goodman LR, et al. Multidetector computed tomography for acute pulmonary embolism. N Engl J Med 2006;354(22):2317–2327. [DOI] [PubMed] [Google Scholar]
- 21.Choosing Wisely: An Initiative of the ABIM Foundation. http://www.choosingwisely.org/doctor-patient-lists/. Accessed April 15, 2014.
- 22.NQF IEP-005–10: Candidate measure for pulmonary CT imaging for patients at low risk for pulmonary embolism. http://www.brighamandwomens.org/Departments_and_Services/emergencymedicine/Quality_Improvement.aspx?sub=0. Accessed February 2, 2014.
- 23.Venkatesh AK, Kline JA, Courtney DM, et al. Evaluation of pulmonary embolism in the emergency department and consistency with a national quality measure: quantifying the opportunity for improvement. Arch Intern Med 2012;172(13):1028–1032. [DOI] [PMC free article] [PubMed] [Google Scholar]
- 24.Bates DW, Kuperman GJ, Wang S, et al. Ten commandments for effective clinical decision support: making the practice of evidence-based medicine a reality. J Am Med Inform Assoc 2003;10(6):523–530. [DOI] [PMC free article] [PubMed] [Google Scholar]
- 25.Lee J, Kirschner J, Pawa S, Wiener DE, Newman DH, Shah K. Computed tomography use in the adult emergency department of an academic urban hospital from 2001 to 2007. Ann Emerg Med 2010;56(6):591–596. [DOI] [PubMed] [Google Scholar]
- 26.Mamlouk MD, vanSonnenberg E, Gosalia R, et al. Pulmonary embolism at CT angiography: implications for appropriateness, cost, and radiation exposure in 2003 patients. Radiology 2010;256(2):625–632. [DOI] [PubMed] [Google Scholar]
- 27.Hoo GW, Wu CC, Vazirani S, Li Z, Barack BM. Does a clinical decision rule using D-dimer level improve the yield of pulmonary CT angiography? AJR Am J Roentgenol 2011;196(5):1059–1064. [DOI] [PubMed] [Google Scholar]
- 28.Bruinstroop E, van de Ree MA, Huisman MV. The use of D-dimer in specific clinical conditions: a narrative review. Eur J Intern Med 2009;20(5):441–446. [DOI] [PubMed] [Google Scholar]
- 29.Kruip MJ, Söhne M, Nijkeuter M, et al. A simple diagnostic strategy in hospitalized patients with clinically suspected pulmonary embolism. J Intern Med 2006;260(5):459–466. [DOI] [PubMed] [Google Scholar]
- 30.Wells PS, Anderson DR, Rodger M, et al. Excluding pulmonary embolism at the bedside without diagnostic imaging: management of patients with suspected pulmonary embolism presenting to the emergency department by using a simple clinical model and d-dimer. Ann Intern Med 2001;135(2):98–107. [DOI] [PubMed] [Google Scholar]
- 31.Gupta A, Raja AS, Khorasani R. Examining clinical decision support integrity: is clinician self-reported data entry accurate? J Am Med Inform Assoc 2014;21(1):23–26. [DOI] [PMC free article] [PubMed] [Google Scholar]
Associated Data
This section collects any data citations, data availability statements, or supplementary materials included in this article.


