Our study suggests that qualitative MR imaging background parenchymal enhancement assessment may useful in prediction of breast cancer risk.
Abstract
Purpose
To investigate whether qualitative magnetic resonance (MR) imaging assessments of background parenchymal enhancement (BPE), amount of fibroglandular tissue (FGT), and mammographic density are associated with risk of developing breast cancer in women who are at high risk.
Materials and Methods
In this institutional review board–approved HIPAA-compliant retrospective study, all screening breast MR images obtained from January 2006 to December 2011 in women aged 18 years or older and at high risk for but without a history of breast cancer were identified. Women in whom breast cancer was diagnosed after index MR imaging comprised the cancer cohort, and one-to-one matching (age and BRCA status) of each woman with breast cancer to a control subject was performed by using MR images obtained in women who did not develop breast cancer with follow-up time maximized. Amount of BPE, BPE pattern (peripheral vs central), amount of FGT at MR imaging, and mammographic density were assessed on index images. Imaging features were compared between cancer and control cohorts by using conditional logistic regression.
Results
Twenty-three women at high risk (mean age, 47 years ± 10 [standard deviation]; six women had BRCA mutations) with no history of breast cancer underwent screening breast MR imaging; in these women, a diagnosis of breast cancer (invasive, n = 12; in situ, n = 11) was made during the follow-up interval. Women with mild, moderate, or marked BPE were nine times more likely to receive a diagnosis of breast cancer during the follow-up interval than were those with minimal BPE (P = .007; odds ratio = 9.0; 95% confidence interval: 1.1, 71.0). BPE pattern, MR imaging amount of FGT, and mammographic density were not significantly different between the cohorts (P = .5, P = .5, and P = .4, respectively).
Conclusion
Greater BPE was associated with a higher probability of developing breast cancer in women at high risk for cancer and warrants further study.
© RSNA, 2015
Introduction
Breast cancer accounts for approximately 40 000 deaths among U.S. women each year (1). Early detection with imaging remains critical to decrease mortality rates, particularly in women at high risk for breast cancer. Current American Cancer Society guidelines recommend that women with a 20% or greater lifetime risk of developing breast cancer undergo annual screening breast magnetic resonance (MR) imaging in addition to routine annual screening mammography (2). Unfortunately, tools used to assess risk (eg, Gail, Claus, and Tyrer-Cuzick models) are applied at a population level but are not good predictors of individual risk because the factors used have weak predictive value and are common in the general population (3).
Increasing qualitative mammographic breast density is known to correlate with breast cancer risk (4,5). Several studies have examined the value of adding mammographic density to current risk prediction tools (6,7); however, these models provide only moderate discriminative ability. Analogous to mammographic breast density, qualitative MR imaging assessment of the amount of fibroglandular tissue (FGT) recently was added to the updated American College of Radiology Breast Imaging Reporting and Data System (BI-RADS) atlas (5th edition) (8). This MR imaging feature has shown high correlation to mammographic breast density assessment and may provide superior accuracy in the determination of breast cancer risk (9–11).
Dynamic contrast material–enhanced (DCE) MR imaging also provides physiologic information that could advance imaging-based breast cancer risk assessment. Through the administration of gadolinium-based contrast agents, DCE MR imaging can reveal enhancement kinetic features reflective of breast cancer biology, such as neovascularity and vascular permeability. It is well established that normal FGT also can enhance, a phenomenon known as background parenchymal enhancement (BPE). BPE fluctuates with variations in hormones, particularly estrogen levels, as determined by menstrual cycle phase, menopausal status, tamoxifen therapy, and hormone replacement therapy (12–18). Increased exposure to estrogen in a woman’s life is linked to breast tumorigenesis, and this hormonal effect is mediated by the presence of estrogen receptors (ERs) in the breast tissue (19). A recent study by King et al showed that higher amounts of BPE were associated with breast cancer diagnoses (20), suggesting that BPE could serve as an imaging biomarker of estrogen responsive breast tissue prone to malignant transformation.
The use of MR imaging to improve breast cancer risk prediction through more accurate assessment of amounts of FGT when compared with mammography, coupled with the identification of hormonally responsive tissue, has important potential clinical implications. Combining MR imaging features with clinical parameters to better determine breast cancer risk could facilitate more tailored screening guidelines, direct chemoprevention strategies, and assist in complex patient decisions, such as choosing prophylactic mastectomies. In this vein, we sought to investigate whether qualitative MR imaging assessments of BPE, amount of FGT, and mammographic density are associated with risk of developing breast cancer in high-risk women.
Materials and Methods
Study Population
This retrospective case-control study was approved by our institutional review board, which waived requirements for informed consent. The study was compliant with the Health Insurance Portability and Accountability Act.
A review of our prospectively collected MR imaging database was performed to identify all screening MR imaging examinations performed in women with high risk of breast cancer at our institution between January 1, 2006, and December 31, 2011. High-risk criteria for eligibility at our institution included determination of a lifetime risk of breast cancer of greater than 20% by using a risk assessment tool that is primarily based on family history (most commonly the Tyrer-Cuzick model), presence of a known genetic mutation (eg, BRCA1 or BRCA2), and/or history of chest radiation therapy between the ages of 10 and 30 years. We included women aged 18 years or older who had no history of breast cancer prior to index MR imaging and who had prospectively recorded BPE and mammographic breast density assessments. If multiple MR images were obtained for a subject during the study period, only data from the earliest (index) examination were included. This yielded 487 women who had undergone at least one screening breast MR imaging examination during the study period.
All patient outcomes were determined by using data from the Consortium Oncology Data Integration project. This project is an institutional review board–approved solid tumor clinical research database developed and maintained by the Fred Hutchinson Cancer Research Center in collaboration with the University of Washington, and sources of data for the Consortium Oncology Data Integration include our institutional breast MR imaging and pathology databases and the Cancer Surveillance System regional tumor registry, which has achieved 95% or higher completeness according to the North American Association of Central Cancer Registries. For this study, breast malignancy was defined as pathologic diagnosis of invasive carcinoma or ductal carcinoma in situ (DCIS) in either breast. Tumor ER status was recorded for patients with a breast malignancy. Final pathologic outcomes were confirmed in all study patients by cross-referencing the clinical electronic medical record with the tumor registry databases.
Of the 487 eligible women, 23 (4.7%) were identified as having a breast cancer diagnosis after index MR imaging was performed, and these patients comprised the cancer cohort. Potential control subjects were identified from the remaining 464 women who did not receive a diagnosis of breast cancer during the study period, and matching was based on age and BRCA gene mutation status, maximizing follow-up time. One-to-one matching of each case to a control subject was achieved by randomly selecting a negative control subject for each patient with cancer. Time to diagnosis in the cancer cohort was defined as the time from index MR imaging to the date of tissue collection that led to the cancer diagnosis. Control cohort follow-up time was defined as the time from index MR imaging to 6 months prior to tumor registry inquiry performed on September 30, 2013, to account for lag time between cancer diagnosis and registry documentation.
MR Imaging Technique
Over the course of the study period, two MR imaging protocols, both of which were consistent with American College of Radiology breast MR imaging accreditation program guidelines (21), were used as clinical practice and technology evolved. Patients underwent imaging in the prone position, and imaging sequences included unenhanced and at least two contrast-enhanced T1-weighted fat-suppressed three-dimensional fast spoiled gradient-recalled acquisitions.
From January 2006 through January 2010, examinations were performed with a 1.5-T LX imager (GE Healthcare, Waukesha, Wis) and use of a dedicated eight-channel breast coil (Sentinelle; Invivo, Gainesville, Fla). DCE images were obtained in the axial plane with the following parameters: repetition time msec/echo time msec, 5.5/2.7; flip angle, 10°; field of view, 32–38 cm; section thickness, 1.6 mm; and matrix size, 420 × 420. Initial contrast-enhanced acquisitions were centered at 90 seconds after contrast material administration. After January 2010, examinations were performed with a 3.0-T Achieva TX imager (Philips Healthcare, Best, the Netherlands) and use of a 16-channel dedicated breast coil (Mammotrak, Philips Healthcare). DCE images were obtained in the axial plane with the following parameters: 5.9/3.0; flip angle, 10°; field of view, 22–33 cm; section thickness, 1.3 mm; and matrix size, 440 × 660. Initial contrast-enhanced acquisitions were centered at 110 seconds after contrast material administration.
For all examinations, gadolinium-containing contrast material (Omniscan, GE Healthcare) was power injected (0.1 mmol per kilogram of body weight at a rate of 2 mL/sec) and followed by a 20-mL saline flush, and images were processed by using a commercially available computer-aided evaluation system (CADstream; Merge Healthcare, Chicago, Ill).
Image Interpretation
Mammographic breast density was recorded at the time of clinical breast MR image interpretation by one of six fellowship-trained radiologists (including H.R. and C.D.L.) who specialized in breast imaging and was determined from the screening mammogram obtained closest to and within 12 months prior to MR imaging and in accordance with BI-RADS criteria, as follows (8): almost entirely fatty, scattered areas of fibroglandular density, heterogeneously dense, or extremely dense. Qualitative BPE on MR images was assessed for each study at the time of clinical interpretation by one of five fellowship-trained radiologists (including H.R. and C.D.L.) who specialized in breast imaging in accordance with BI-RADS categories: minimal, mild, moderate, or marked (Fig 1). Determination of BPE was based on the amount of FGT enhancing on the DCE subtraction and maximum intensity projection images, both of which are created by subtracting the unenhanced T1-weighted image from the initial contrast-enhanced image. In cases of substantial patient motion between examinations, BPE was determined via visual comparison of the initial unenhanced and contrast-enhanced images. Assessments and recommendations also were prospectively recorded in accordance with BI-RADS at the time of clinical interpretation, and all MR imaging variables were recorded in the Consortium Oncology Data Integration database and extracted for the purpose of this study.
Figure 1a:
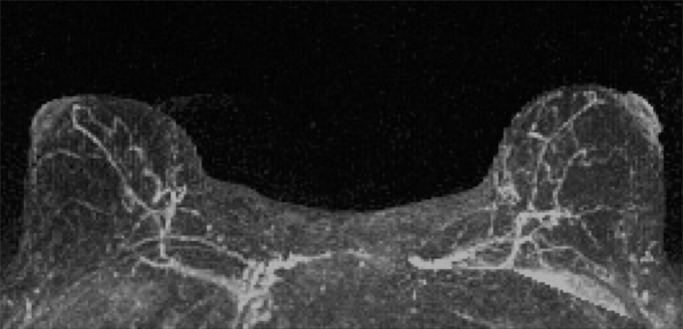
Examples of varying amounts of BPE, as prospectively assessed qualitatively. Axial postcontrast maximum intensity projection MR images show (a) minimal, (b) mild, (c) moderate, and (d) marked BPE.
Figure 1b:
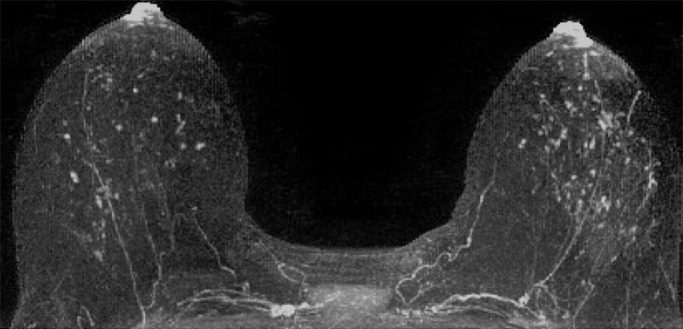
Examples of varying amounts of BPE, as prospectively assessed qualitatively. Axial postcontrast maximum intensity projection MR images show (a) minimal, (b) mild, (c) moderate, and (d) marked BPE.
Figure 1c:
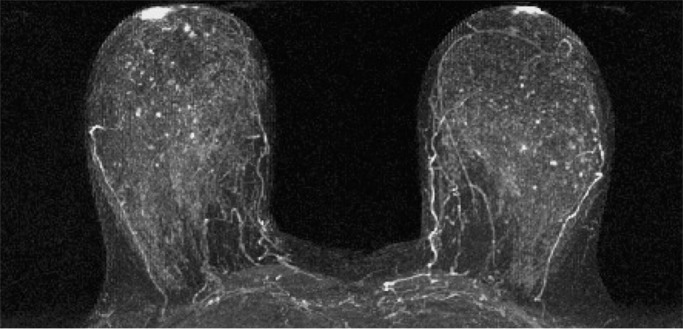
Examples of varying amounts of BPE, as prospectively assessed qualitatively. Axial postcontrast maximum intensity projection MR images show (a) minimal, (b) mild, (c) moderate, and (d) marked BPE.
Figure 1d:
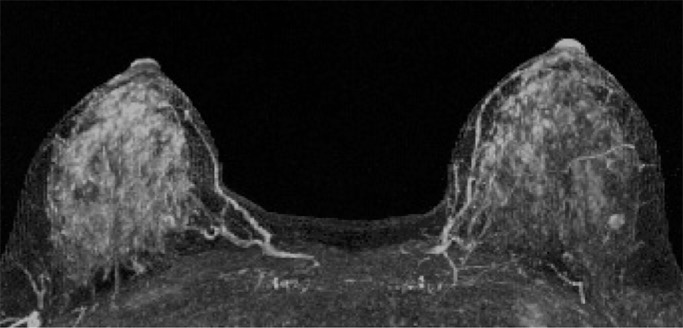
Examples of varying amounts of BPE, as prospectively assessed qualitatively. Axial postcontrast maximum intensity projection MR images show (a) minimal, (b) mild, (c) moderate, and (d) marked BPE.
Because BPE that is elevated due to hormone effects typically has a greater component of central enhancement within the breast parenchyma than BPE that is presumably due to vascular perfusion (22), two fellowship-trained radiologists (B.D., J.S.; 1 and 3 years of breast MR imaging experience, respectively) blinded to patient outcomes retrospectively and independently determined BPE patterns, as follows (Fig 2): If the majority of parenchymal enhancement for a patient was located in the periphery of the breast parenchyma, the BPE pattern was classified as peripheral, whereas if the majority of the breast parenchymal enhancement was located centrally within the parenchyma, the BPE pattern was classified as central. These two radiologists also determined the amount of FGT on each MR image in accordance with BI-RADS criteria, as follows: almost entirely fat, scattered areas of FGT, heterogeneous FGT, or extreme FGT (Fig 3). Differences in interpretation of BPE patterns and amounts of FGT on MR images between the two interpreting radiologists were resolved through consensus.
Figure 2a:
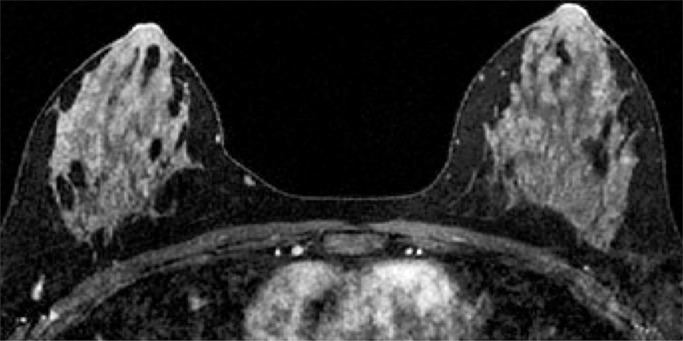
Examples of BPE patterns, as assessed retrospectively, with observers blinded to clinical outcomes. Axial T1-weighted postcontrast fat-saturated images show (a) BPE with a predominantly central pattern and (b) BPE with a predominantly peripheral pattern.
Figure 3a:
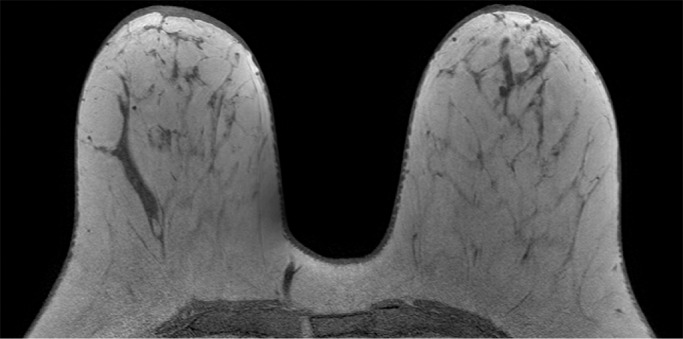
Examples of varying amounts of FGT on breast MR images, as assessed retrospectively, with observers blinded to known mammographic densities. Axial T1-weighted images show examples of breast composition described as (a) almost entirely fat, (b) scattered fibroglandular, (c) heterogeneous, and (d) extreme amount of FGT.
Figure 2b:
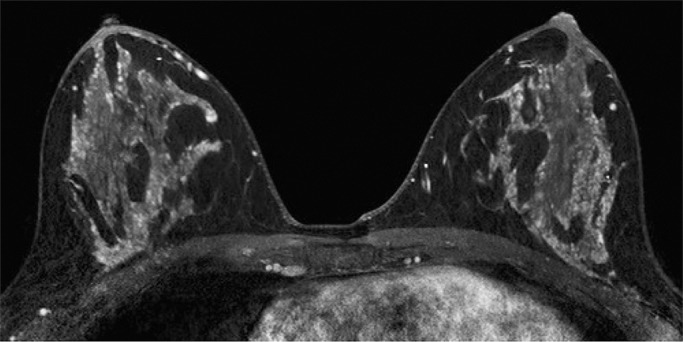
Examples of BPE patterns, as assessed retrospectively, with observers blinded to clinical outcomes. Axial T1-weighted postcontrast fat-saturated images show (a) BPE with a predominantly central pattern and (b) BPE with a predominantly peripheral pattern.
Figure 3b:
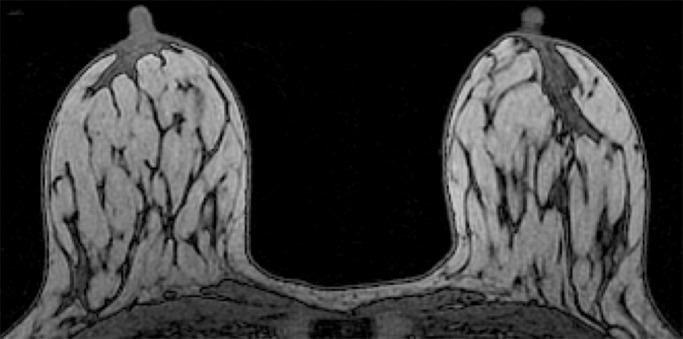
Examples of varying amounts of FGT on breast MR images, as assessed retrospectively, with observers blinded to known mammographic densities. Axial T1-weighted images show examples of breast composition described as (a) almost entirely fat, (b) scattered fibroglandular, (c) heterogeneous, and (d) extreme amount of FGT.
Figure 3c:
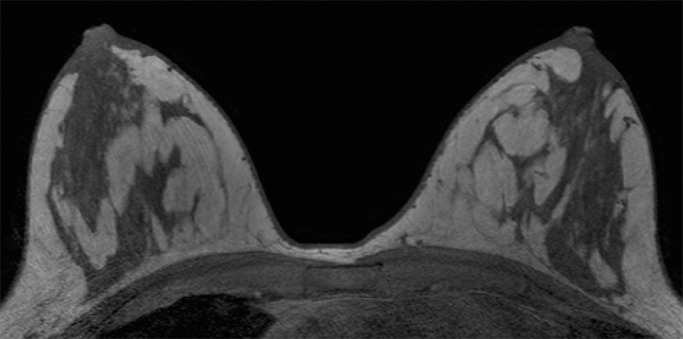
Examples of varying amounts of FGT on breast MR images, as assessed retrospectively, with observers blinded to known mammographic densities. Axial T1-weighted images show examples of breast composition described as (a) almost entirely fat, (b) scattered fibroglandular, (c) heterogeneous, and (d) extreme amount of FGT.
Figure 3d:
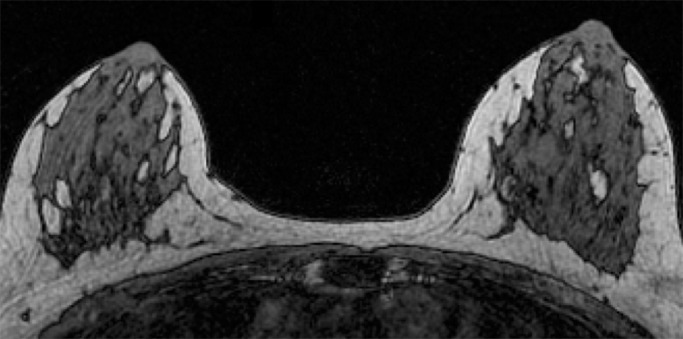
Examples of varying amounts of FGT on breast MR images, as assessed retrospectively, with observers blinded to known mammographic densities. Axial T1-weighted images show examples of breast composition described as (a) almost entirely fat, (b) scattered fibroglandular, (c) heterogeneous, and (d) extreme amount of FGT.
Statistical Analysis
Differences in MR imaging protocol (1.5-T vs 3.0-T imaging) between the cancer and control cohorts were assessed with the Fisher exact test. Amount and dominant pattern of BPE on MR images, amount of FGT on MR images, and mammographic density were compared between the cancer cohort and the control cohort by using conditional logistic regression to estimate odds ratios and corresponding 95% confidence intervals for developing breast cancer. Factors found to differ significantly across patients and control subjects were further analyzed by using receiver operating characteristic curve analysis to identify optimal thresholds to maximize both sensitivity and specificity. Across patients with cancer, logistic regression and the Fisher exact test were used to assess differences in breast tissue imaging features between subjects who developed ER-positive and ER-negative cancers. P < .05 was considered to indicate a significant difference for all comparisons. All computations were performed by using SAS software (version 9.4; SAS Institute, Cary, NC).
Results
Of the 23 breast malignancies diagnosed during the study interval in the cancer cohort, 12 (52%) were invasive and 11 (48%) were DCIS (Table 1). Nine of the twelve (75%) invasive cancers were ER positive, and six DCIS lesions (six of 10, 60%) were ER positive; the ER status of one patient with DCIS was unknown. Within the cancer cohort, mean time from index MR imaging to breast cancer diagnosis was 2.1 years ± 1.6 (standard deviation), with six (26%) of the 23 cancers diagnosed on the basis of suspicious findings described on the index MR images and the remainder diagnosed on the basis of imaging (eight patients at screening MR imaging, six at screening mammography) and three cancers diagnosed on the basis of clinical symptoms, physical examination findings after index MR imaging, or both. None of the index MR imaging findings in the cohort were false-negative (defined as negative MR imaging findings with cancer diagnosed within 365 days after the date of the MR imaging). Mean age of patients in the cancer cohort was 47.7 years ± 10 (range, 31–70 years), and six patients had BRCA1 or BRCA2 gene mutations. Mean follow-up time for the control cohort, matched with the cancer cohort for age and BRCA status, was 5.1 years ± 1.3 (range, 2–7 years). Among the 46 patients included in the study, the two radiologists agreed on BPE pattern in 44; for the two patients with discordant findings, disagreement was resolved by consensus. Within the cancer cohort, 22 women underwent 1.5-T MR imaging and one woman underwent 3.0-T MR imaging; this was not significantly different from the control cohort (n = 19 and n = 4, respectively; P = .3).
Table 1.
Patient Characteristics and Indications of the Cancer Cohort and Matched Negative Controls
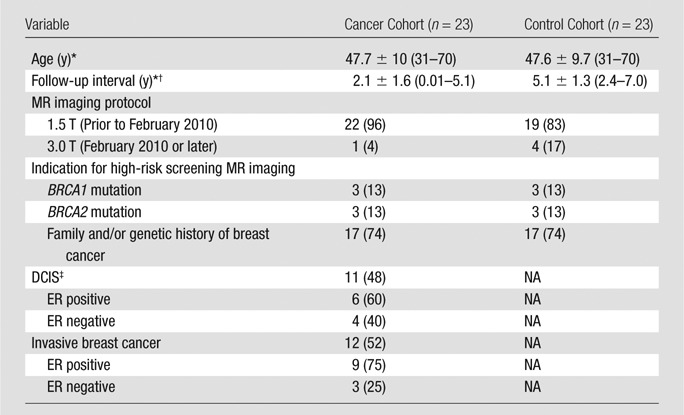
Note.—Unless otherwise indicated, data are numbers of patients and data in parentheses are percentages. All patients were matched for age and BRCA mutation status. NA = not applicable.
* Data are mean ± standard deviation. Data in parentheses are the range.
† Data are time to diagnosis in the cancer cohort and follow-up time in control cohort.
‡ Data on ER status were unavailable for one patient with DCIS.
Association of Qualitative Imaging Features with Developing Breast Cancer
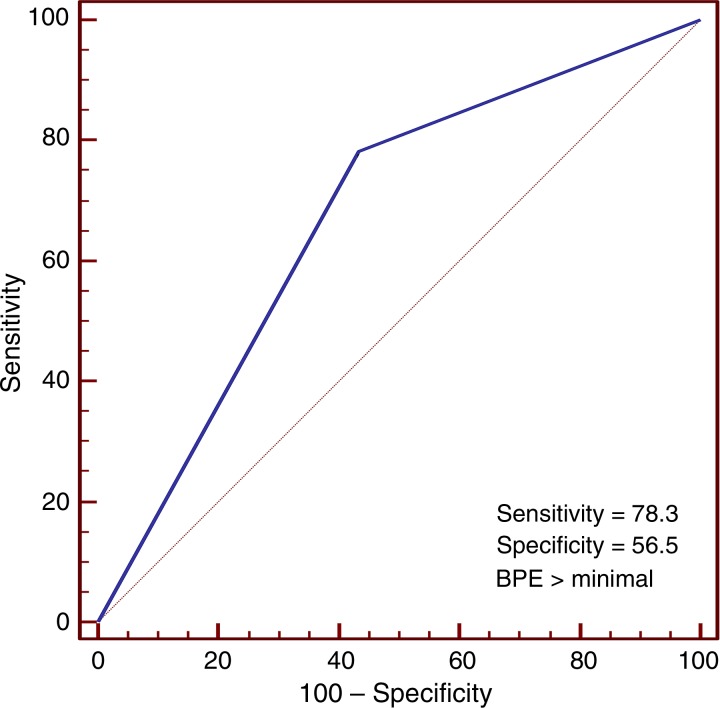
In the cancer cohort, there was no significant association between MR imaging–assessed amounts of FGT or mammographic breast density and cancer development (P = .5 and P = .4, respectively; Table 2). However, conditional logistic regression showed BPE was significantly associated with cancer development (P = .02). Receiver operating characteristic curve analysis further suggested an optimal threshold (for maximizing the area under the curve) of BPE greater than 1 (minimal) in the differentiation of patients with cancer from control subjects (Fig 4). By using this threshold, we found that a significantly higher percentage of women in the cancer cohort had either mild, moderate, or marked BPE (78% [18 of 23 women]) than did women in the control cohort (43% [10 of 23 women], P = .007). Furthermore, women with mild, moderate, or marked BPE were nine times more likely to develop breast cancer during the follow-up interval when compared with women with minimal BPE (odds ratio = 9.0; 95% confidence interval: 1.1, 71.0). BPE pattern (central vs peripheral) was not associated with cancer development (odds ratio, 0.6; 95% confidence interval: 0.1, 2.5). Examples of patients with moderate and marked BPE who developed breast cancer are shown in Figures 5 and 6. (Images for the matched control subjects are shown in Figs E1 and E2 [online].)
Table 2.
Comparison of Imaging Characteristics between the Cancer and Negative Control Cohorts by Conditional Logistic Regression
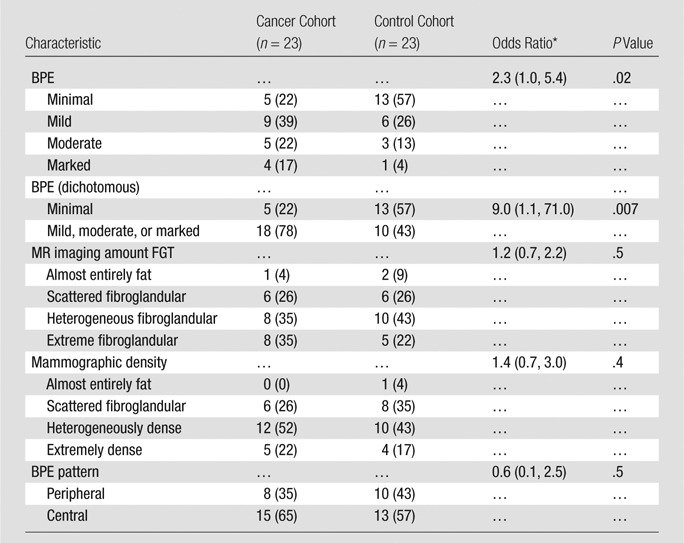
Note.—Unless otherwise indicated, data are numbers of subjects, with percentages in parentheses.
* Data in parentheses are 95% confidence intervals.
Figure 4:
Receiver operating characteristic curve shows accuracy of BPE assessment in the discrimination of patients with cancer (n = 23) and control subjects (n = 23). The area under the curve was 0.70 (95% confidence interval: 0.54, 0.82). An optimal BPE threshold of greater than minimal was identified to maximize sensitivity and specificity, with a resulting diagnostic performance of 78% sensitivity and 57% specificity.
Figure 5:
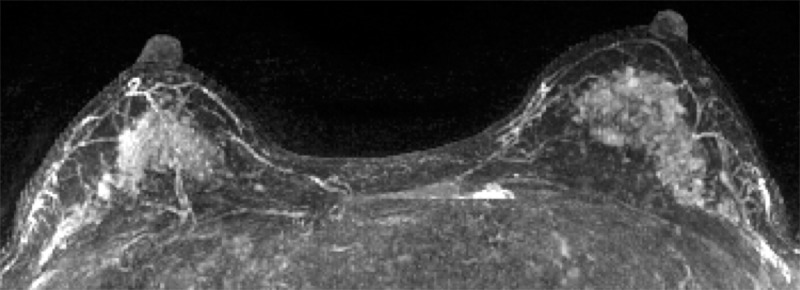
Contrast-enhanced maximum intensity projection in a 41-year-old woman with a family history of breast cancer shows marked BPE. This patient was found to have invasive ductal carcinoma 183 days after index MR imaging. (The maximum intensity projection image from the age- and history-matched control subject is provided in Figure E1 [online].)
Figure 6:
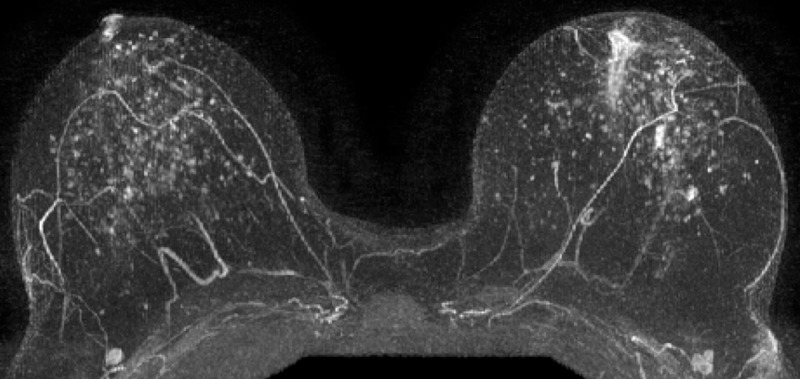
Postcontrast maximum intensity projection in a 48-year-old woman with a genetic history of breast cancer and prior excisional biopsy in the left breast shows moderate BPE. A diagnosis of invasive ductal carcinoma was made 1044 days after index MR imaging. (The maximum intensity projection image from the age- and history-matched control subject is provided in Figure E2 [online].)
Associations of Imaging Parameters with ER-positive Forms of Breast Cancer
For patients within the cancer cohort for whom ER status was known (22 of 23 patients), there were no significant associations of BPE assessment or BPE pattern with ER positivity (P = .9 and P = .8, respectively; Table 3). Similarly, we found no significant associations of MR imaging–assessed amount of FGT or mammographic density with cancer ER status (P = .1 and P = .7, respectively).
Table 3.
Comparison of Imaging Characteristics between Patients Diagnosed with ER-positive and ER-negative Cancers at Logistic Regression
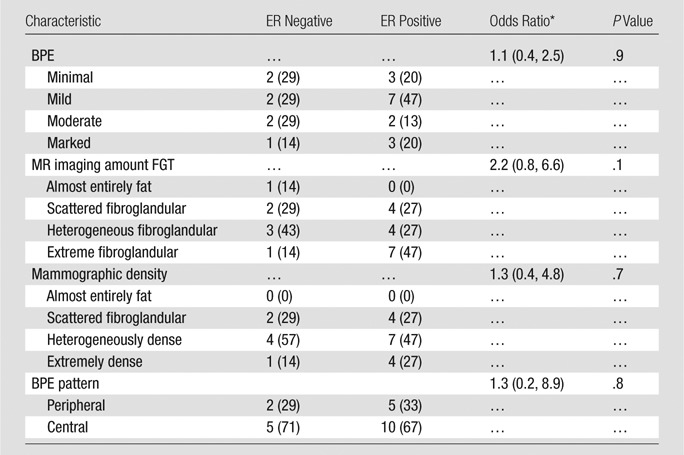
Note.—Unless otherwise indicated, data are numbers of subjects, with percentages in parentheses.
* Data in parentheses are 95% confidence intervals.
Discussion
In our cohort, women with an MR imaging assessment of mild, moderate, or marked BPE were nine times more likely to develop breast cancer than were women with minimal BPE. Our results suggest that this breast MR imaging feature has the potential to improve upon standard clinical models to more accurately determine a woman’s individual breast cancer risk.
While the findings from this study support a previously published report by King et al (20), which showed an association between higher BPE assessments and breast cancer diagnoses, there are several noteworthy design differences that broaden clinical applicability of our findings. In that prior study, the authors reported that women with retrospectively assessed moderate or marked BPE on high-risk screening breast MR images had an approximately 10-fold greater chance of having breast cancer detected with MR imaging when compared with women with minimal or mild BPE. A limitation of their study design was that all patients in the cancer cohort had a visually detectable breast malignancy on the MR images, which could have artificially increased BPE assessments, both through malignancy-associated enhancement that was categorized as part of the BPE and through bias when readers encountered an area of suspicious enhancement. King et al attempted to mitigate the issue of bias by creating a population of patients with false-positive MR examinations matched to patients with cancer; this lowered the magnitude of the association of greater BPE with the cancer cohort by approximately half (odds ratio, 5.1).
In contrast, our study included women at high risk with prospectively assessed BPE who had a subsequent diagnosis of breast cancer after index screening MR imaging. The majority of patients with cancer in this cohort (n = 17) were not identified at index MR imaging, which improves the clinical applicability of using BPE as a marker of future breast cancer risk. Furthermore, all patients at high risk in our study had never previously had a breast cancer diagnosis, whereas 31% of patients included in the cancer cohort in the King et al study had previously undergone treatment for a breast malignancy. This distinction is important because BPE levels are known to decrease over time in the affected breast in women who have undergone prior treatment with radiation (22,23), a factor that could have affected BPE assessments. Finally, King et al did not match for BRCA status, which is currently one of the strongest indicators of breast cancer risk, and unbalanced case control could have led to bias in their results. Our study included 12 patients with BRCA mutations evenly matched between the cohorts; therefore, our study provides more conclusive evidence that BPE levels in women at high risk have the potential to serve as an independent biomarker of breast cancer risk.
Because BPE levels are associated with amounts of circulating estrogen in the body, we also assessed whether women in the cancer cohort with ER-positive malignancies were more likely to have a higher BPE assessment than were those with ER-negative cancer. We found no significant relationship between MR imaging features of normal breast tissue and ER positivity of breast cancers. This suggests that BPE portends a greater risk for developing all breast cancers, not just hormone-sensitive malignancies. We also hypothesized that central patterns of BPE would show a greater association with the development of breast cancer due to an assumed greater hormone-mediated effect on BPE compared with the peripheral so-called picture frame pattern of BPE related to the normal peripheral vascular supply to breast tissue (22). However, we found no differences in the proportion of patients with predominantly central BPE patterns between the cancer and control cohorts.
Finally, we found no differences in mammographic density or the amount of FGT on MR images between the cancer and control cohorts. While mammographic density is well established to be associated with an increased likelihood of a woman developing breast cancer in her lifetime, its role in refining the determination of breast cancer risk in women who are already at high risk is less clear. In fact, one prior study showed that mammographic breast density did not improve breast cancer risk assessment in women who carried the BRCA gene mutation (24). However, two-thirds (31 of 46) of our total cohort of patients had a mammographic density assessment of heterogeneously dense or extremely dense; this fraction is higher than that previously reported in the general population (approximately 50% [25]). This suggests that the effect of mammographic density on breast cancer risk may have already been accounted for in our study population, and further study of the correlation of BPE with breast cancer risk in cohorts with more balanced density assessments is warranted.
The precise reason elevated levels of BPE but not mammographic density or amount of FGT might correlate with breast cancer risk is unknown. While exhibiting BPE requires a patient to have at least some fibroglandular tissue (ie, entirely fatty breasts cannot exhibit BPE), the two assessments are distinct, with recent study findings enabling confirmation that mammographic density does not correlate with BPE levels (26). It is possible that BPE is a marker of physiologically active breast tissue that is more likely to undergo malignant transformation, perhaps specifically identifying areas of increased inflammation that recently have been linked to malignant breast tumorigenesis (27). Additional studies to assess the biologic relationship between BPE and breast cancer development are needed to better explain why it may serve as a biomarker of breast cancer risk.
Our study had several important limitations. First, we used qualitative assessments of BPE, mammographic breast density, and FGT at MR imaging, all of which are potentially prone to inter- and intraobserver variability. It is possible that use of quantitative measurements would strengthen the identified association of BPE with breast cancer risk and enable identification of significant associations of the amounts of FGT with breast cancer risk not evident with qualitative assessments. We also studied BPE in women already known to be at higher risk for breast cancer since women at average risk typically are not screened with breast MR imaging. Accordingly, it remains unknown whether the relationship between increasing BPE and breast cancer risk would extend to the general population of women. Because our MR imaging technique changed during the course of the study, the fraction of control subjects in whom follow-up time was maximized who underwent 1.5-T imaging was greater than the fraction of subjects with cancer who underwent 1.5-T imaging; however, this difference was not significant. Because of theoretical differences in T1 relaxation times at varying field strengths, this may have affected BPE assessments and thereby, the observed associations. Finally, because of the single-institution design and relatively recent use of MR imaging for screening, our cancer cohort was small and follow-up time was limited. As a result, our study may have been underpowered to adequately detect all imaging associations with breast cancer risk (post hoc power, approximately 70%). In addition, thresholds for discriminating between women who developed breast cancer and those who did not could not be tested with a unique data set, thereby limiting applicability of the results. Thus, verification of our findings in larger multi-institutional cohorts is needed.
In conclusion, our study suggests that qualitative MR imaging BPE assessment may be useful in the prediction of breast cancer risk. Mammographic density and MR imaging assessment of amounts of FGT, while known risk factors in women at average risk, may be less predictive in women already determined to be at high risk for breast cancer. If this biomarker is verified in larger multicenter cohorts, the integration of BPE into clinical risk assessment tools could enable screening and chemoprevention strategies to be better tailored to each individual’s true risk.
Advances in Knowledge
■ Women at high risk of developing breast cancer undergoing screening breast MR imaging who have mild, moderate, or marked background parenchymal enhancement (BPE) were nine times more likely to develop breast cancer within a mean follow-up interval of 5.6 years ± 1.3 [standard deviation] than were those with minimal BPE in our cohort (odds ratio = 9.0; 95% confidence interval: 1.1, 71.0).
■ There was no significant difference in mammographic density and MR imaging–assessed amount of fibroglandular tissue in women at high risk in whom breast cancer was diagnosed versus women in whom breast cancer was not diagnosed during the follow-up interval (P > .05 for all comparisons).
Implication for Patient Care
■ BPE is a promising imaging biomarker of breast cancer risk and could aid in refining clinical risk assessment models to individualize screening strategies.
SUPPLEMENTAL FIGURES
Received September 30, 2014; revision requested November 4; revision received December 19; accepted January 9, 2015; final version accepted January 20.
Supported by the International Society for Magnetic Resonance in Medicine (2013-2014 Seed Grant). B.N.D. supported by the Roger E. Moe Fellowship at the University of Washington. J.R.S. is the 2014 American Roentgen Ray Society scholar and receives part of his funding from this scholarship.
Funding: This research was supported by the National Institutes of Health (grant 1R01CA151326).
Abbreviations:
- BI-RADS
- Breast Imaging Reporting and Data System
- BPE
- background parenchymal enhancement
- DCE
- dynamic contrast material enhanced
- DCIS
- ductal carcinoma in situ
- ER
- estrogen receptor
- FGT
- fibroglandular tissue
Disclosures of Conflicts of Interest: B.N.D. disclosed no relevant relationships. H.R. disclosed no relevant relationships. S.C.P. disclosed no relevant relationships. L.A.K. disclosed no relevant relationships. D.L.L. disclosed no relevant relationships. J.R.S. disclosed no relevant relationships. S.P. disclosed no relevant relationships. C.D.L. Activities related to the present article: none to disclose. Activities not related to the present article: received a grant from General Electric and received personal fees from General Electric and Bayer. Other relationships: none to disclose.
References
- 1.Hamstra DA, Rehemtulla A, Ross BD. Diffusion magnetic resonance imaging: a biomarker for treatment response in oncology. J Clin Oncol 2007;25(26):4104–4109. [DOI] [PubMed] [Google Scholar]
- 2.Smith RA, Cokkinides V, Brooks D, Saslow D, Shah M, Brawley OW. Cancer screening in the United States, 2011: a review of current American Cancer Society guidelines and issues in cancer screening. CA Cancer J Clin 2011;61(1):8–30. [DOI] [PubMed] [Google Scholar]
- 3.Wald NJ, Hackshaw AK, Frost CD. When can a risk factor be used as a worthwhile screening test? BMJ 1999;319(7224):1562–1565. [DOI] [PMC free article] [PubMed] [Google Scholar]
- 4.Boyd NF, Byng JW, Jong RA, et al. Quantitative classification of mammographic densities and breast cancer risk: results from the Canadian National Breast Screening Study. J Natl Cancer Inst 1995;87(9):670–675. [DOI] [PubMed] [Google Scholar]
- 5.Byrne C, Schairer C, Brinton LA, et al. Effects of mammographic density and benign breast disease on breast cancer risk (United States). Cancer Causes Control 2001;12(2):103–110. [DOI] [PubMed] [Google Scholar]
- 6.Barlow WE, White E, Ballard-Barbash R, et al. Prospective breast cancer risk prediction model for women undergoing screening mammography. J Natl Cancer Inst 2006;98(17):1204–1214. [DOI] [PubMed] [Google Scholar]
- 7.Tice JA, Cummings SR, Smith-Bindman R, Ichikawa L, Barlow WE, Kerlikowske K. Using clinical factors and mammographic breast density to estimate breast cancer risk: development and validation of a new predictive model. Ann Intern Med 2008;148(5):337–347. [DOI] [PMC free article] [PubMed] [Google Scholar]
- 8.D’Orsi CJ, Sickles EA, Mendelson EB, et al. ACR BI-RADS Atlas, Breast Imaging Reporting and Data System. Reston, Va: American College of Radiology, 2013. [Google Scholar]
- 9.Wei J, Chan HP, Helvie MA, et al. Correlation between mammographic density and volumetric fibroglandular tissue estimated on breast MR images. Med Phys 2004;31(4):933–942. [DOI] [PubMed] [Google Scholar]
- 10.Nie K, Chen JH, Chan S, et al. Development of a quantitative method for analysis of breast density based on three-dimensional breast MRI. Med Phys 2008;35(12):5253–5262. [DOI] [PMC free article] [PubMed] [Google Scholar]
- 11.Nie K, Chang D, Chen JH, Hsu CC, Nalcioglu O, Su MY. Quantitative analysis of breast parenchymal patterns using 3D fibroglandular tissues segmented based on MRI. Med Phys 2010;37(1):217–226. [DOI] [PMC free article] [PubMed] [Google Scholar]
- 12.Delille JP, Slanetz PJ, Yeh ED, Kopans DB, Garrido L. Physiologic changes in breast magnetic resonance imaging during the menstrual cycle: perfusion imaging, signal enhancement, and influence of the T1 relaxation time of breast tissue. Breast J 2005;11(4):236–241. [DOI] [PubMed] [Google Scholar]
- 13.Müller-Schimpfle M, Ohmenhaüser K, Stoll P, Dietz K, Claussen CD. Menstrual cycle and age: influence on parenchymal contrast medium enhancement in MR imaging of the breast. Radiology 1997;203(1):145–149. [DOI] [PubMed] [Google Scholar]
- 14.Kuhl CK, Bieling HB, Gieseke J, et al. Healthy premenopausal breast parenchyma in dynamic contrast-enhanced MR imaging of the breast: normal contrast medium enhancement and cyclical-phase dependency. Radiology 1997;203(1):137–144. [DOI] [PubMed] [Google Scholar]
- 15.Reichenbach JR, Przetak C, Klinger G, Kaiser WA. Assessment of breast tissue changes on hormonal replacement therapy using MRI: a pilot study. J Comput Assist Tomogr 1999;23(3):407–413. [DOI] [PubMed] [Google Scholar]
- 16.Delille JP, Slanetz PJ, Yeh ED, Kopans DB, Halpern EF, Garrido L. Hormone replacement therapy in postmenopausal women: breast tissue perfusion determined with MR imaging—initial observations. Radiology 2005;235(1):36–41. [DOI] [PubMed] [Google Scholar]
- 17.King V, Kaplan J, Pike MC, et al. Impact of tamoxifen on amount of fibroglandular tissue, background parenchymal enhancement, and cysts on breast magnetic resonance imaging. Breast J 2012;18(6):527–534. [DOI] [PubMed] [Google Scholar]
- 18.Schrading S, Schild H, Kühr M, Kuhl C. Effects of tamoxifen and aromatase inhibitors on breast tissue enhancement in dynamic contrast-enhanced breast MR imaging: a longitudinal intraindividual cohort study. Radiology 2014;271(1):45–55. [DOI] [PubMed] [Google Scholar]
- 19.Anderson E. The role of oestrogen and progesterone receptors in human mammary development and tumorigenesis. Breast Cancer Res 2002;4(5):197–201. [DOI] [PMC free article] [PubMed] [Google Scholar]
- 20.King V, Brooks JD, Bernstein JL, Reiner AS, Pike MC, Morris EA. Background parenchymal enhancement at breast MR imaging and breast cancer risk. Radiology 2011;260(1):50–60. [DOI] [PMC free article] [PubMed] [Google Scholar]
- 21.American College of Radiology Breast MRI Accreditation Program . http://www.acr.org/Quality-Safety/Accreditation/BreastMRI. Accessed July 14, 2014.
- 22.Giess CS, Yeh ED, Raza S, Birdwell RL. Background parenchymal enhancement at breast MR imaging: normal patterns, diagnostic challenges, and potential for false-positive and false-negative interpretation. RadioGraphics 2014;34(1):234–247. [DOI] [PubMed] [Google Scholar]
- 23.Li J, Dershaw DD, Lee CH, Joo S, Morris EA. Breast MRI after conservation therapy: usual findings in routine follow-up examinations. AJR Am J Roentgenol 2010;195(3):799–807. [DOI] [PubMed] [Google Scholar]
- 24.Passaperuma K, Warner E, Hill KA, Gunasekara A, Yaffe MJ. Is mammographic breast density a breast cancer risk factor in women with BRCA mutations? J Clin Oncol 2010;28(23):3779–3783. [DOI] [PubMed] [Google Scholar]
- 25.Kerlikowske K, Hubbard RA, Miglioretti DL, et al. Comparative effectiveness of digital versus film-screen mammography in community practice in the United States: a cohort study. Ann Intern Med 2011;155(8):493–502. [DOI] [PMC free article] [PubMed] [Google Scholar]
- 26.Hansen NL, Kuhl CK, Barabasch A, Strobel K, Schrading S. Does MRI breast “density” (degree of background enhancement) correlate with mammographic breast density? J Magn Reson Imaging 2014;40(2):483–489. [DOI] [PubMed] [Google Scholar]
- 27.Bhatelia K, Singh K, Singh R. TLRs: linking inflammation and breast cancer. Cell Signal 2014;26(11):2350–2357. [DOI] [PubMed] [Google Scholar]
Associated Data
This section collects any data citations, data availability statements, or supplementary materials included in this article.


