

Abstract
Effects on human health from the complex radiation environment in deep space have not been measured and can only be simulated here on Earth using experimental systems and beams of radiations produced by accelerators, usually one beam at a time. This makes it particularly important to develop instruments that can be used on deep-space missions to measure quantities that are known to be relatable to the biological effectiveness of space radiation. Tissue-equivalent proportional counters (TEPCs) are such instruments. Unfortunately, present TEPCs are too large and power intensive to be used beyond low Earth orbit (LEO). Here, the authors describe a prototype of a compact TEPC designed for deep space applications with the capability to detect both ambient galactic cosmic rays and intense solar particle event radiation. The device employs an approach that permits real-time determination of  (and thus quality factor) using a single detector. This was accomplished by assigning sequential sampling intervals as detectors “1” and “2” and requiring the intervals to be brief compared to the change in dose rate. Tests with γ rays show that the prototype instrument maintains linear response over the wide dose-rate range expected in space with an accuracy of better than 5% for dose rates above 3 mGy h−1. Measurements of
  for 200 MeV n−1 carbon ions were better than 10%. Limited tests with fission spectrum neutrons show absorbed dose-rate accuracy better than 15%.
Key words: detector, radiation; microdosimetry; radiation, atmospheric; radioactivity, natural
INTRODUCTION
When astronauts travel beyond the protective shield of Earth’s magnetosphere (to the moon, asteroids, Mars) for extended periods, there will be a need for active radiation monitoring for radiation protection and risk assessment. Tissue-equivalent proportional counters (TEPCs) have served as radiation monitors onboard the International Space Station (ISS) and the Space Shuttle. However, those instruments are too large and power intensive to be used on missions beyond low-Earth orbit (LEO). In order to extend the heritage of the TEPC technology to missions beyond LEO, a compact and low-power version of this technology is required. The challenge is to develop a TEPC that can satisfy the size and power requirements while also providing reliable dosimetry for the complex radiation environment in space, which includes both steady-state galactic cosmic-ray (GCR) radiation and highly variable solar particle event (SPE) radiation.
Standard TEPC measurements are difficult in high intensity radiation fields where single events cannot be resolved and where radiation intensity may vary over time. One approach to dosimetry under such conditions is the variance-covariance method using two detectors that operate in phase; i.e., obtaining absorbed dose rate from the rate of charge accumulation in one detector and dose mean lineal energy (yD) from the difference between the variance of the signal from one detector and the covariance of the concomitant signals from the two detectors (Kellerer and Rossi 1984). The variance-covariance method has been used on Earth in the microdosimetric evaluation of high intensity and low intensity time-varying radiation fields using both dual and single detectors (e.g., Breckow et al. 1988; Lillhok 2007; Lillhok et al. 2007; Lindborg et al. 2013).
To meet the stringent size and power requirements for deep space missions, it became clear that multichannel analysis or dual detectors would not be practical. It was decided to employ a variance-covariance approach using a single detector. The approach described here was to develop a spherical Benjamin-type tissue-equivalent plastic detector, a pre-amplifier with charge integrator, a statistics-based algorithm suitable for a single detector, and a compact electronics package with real-time data processing. The results would be wirelessly transmitted to the spacecraft for display and making health physics decisions. This integrated system would eliminate the need for a multichannel analyzer and permit real-time monitoring of dose rate, quality factor, and dose equivalent rate during both ambient conditions and during a SPE. The method used here, together with a charge integrator and data processing, would reduce (perhaps eliminate) the possibility of saturation during exceptionally large SPEs, which is a limitation for conventional TEPCs, including those deployed on the ISS.
DESIGN AND FABRICATION
Radiation detector
The radiation detector is based on the concepts of a spherical TEPC. Specifically, the design incorporates features described by Benjamin et al. (1968). The objective was to improve the uniformity of the electric field along a single anode surrounded by a spherical conducting shell (Fig. 1). The spherical shell has an inside diameter of 18 mm and an outside diameter of 24 mm. The wall thickness is 3 mm. Wall material is A‐150 tissue-equivalent plastic. The thickness of the wall was selected to provide sufficient buildup of delta rays into the spherical gas cavity without causing excessive fragmentation of HZE particles penetrating the plastic wall or attenuation of MeV-energy neutrons (Rademacher et al. 1998; Gersey et al. 2002; Guetersloh et al. 2004).
Fig. 1.

(left) TEPC detector assembly, (center) attached to pre-amplifier circuit boards before the wire cage and vacuum chamber were added, and (right) enclosed in gold-plated vacuum chamber.
To minimize microphonic noise caused by cathode vibration problems, which may occur in space applications, the tissue-equivalent cathode was mounted on prototype boards using the anode insulators and a wire cage providing mechanical support at the upper end of the cathode. This arrangement keeps the cathode securely clamped to the circuit board. The top insulator houses a small coil spring (Kadee part no. #622 HO-Scale Knuckle Spring; Kadee Quality Products Co., White City, OR, USA) to tension the anode wire, and the other end of the anode is soldered to a wire form, which serves as the connection to the charge integrator and is securely bolted to the circuit board. This configuration has eliminated anode breakage and tensioning problems. The anode insulators also house small TE plastic cylinders, which surround the anode wire and function as the field shaping electrodes in the Benjamin design. The insulators were machined from Kel-F plastic rod, and the TE cylinders were epoxyed into counter bores in the inside ends of the insulators. The vacuum chamber is 0.1‐mm-thick aluminum with nickel-gold alloy plating on both the interior and exterior (Fig. 1, right) to provide reliable electromagnetic shielding. The vacuum chamber and base plate are joined with screws compressing an indium wire gasket.
Pre-amplifier and charge integrator
Application of the variance-covariance approach to microdosimetry requires measurement of the total charge produced by the detector in fixed time intervals. Many different approaches can be taken to determine the charge collected, but for a compact portable instrument, the preferred approach is the one that can be implemented in electronics with minimum mass and power consumption. Alternatives include measuring the current with an electrometer and integrating the charge for a fixed time using a voltage-to-frequency converter, recording the pulse height for individual events and summing for the desired time, or collecting charge on a capacitor for the specified time and reading the voltage on the capacitor. Of these basic approaches, measuring the charge on a capacitor appears to require the least electronics, since a relatively simple circuit based on a charge sensitive preamplifier and an analog-to-digital converter will achieve the needed results. The block diagram of a simple charge-sensitive preamplifier is shown in Fig. 2a. When charge from the detector is deposited at the negative input of the operational amplifier, its output voltage increases until the potential difference between the + and – inputs is 0. The output voltage then holds the charge on the feedback capacitor, C1. The feedback resistor, R1, which is usually 108 or 109 Ω, is used to bleed charge off of C1 to prevent the output voltage from reaching the amplifier’s maximum voltage when more charge is received from the detector. If R1 is replaced by a switch and a relatively small resistor, R1a (Fig. 2b), the output voltage will be proportional to the charge collected since the switch opened. The switch can be closed at the end of each charge measurement interval, but this is not necessary, since the voltage can be measured at the beginning and end of the interval and the difference will give the charge collected during the interval. Since the feedback resistor in Fig. 2a is a source of electronic noise, the approach illustrated in Fig. 2b has been used to reduce noise in pulse-height analysis systems.
Fig. 2.

Block diagrams (a) of a conventional charge-sensitive preamplifier and (b) of the preamplifier modified here to integrate charge until the switch is closed by a signal from the microprocessor.
The use of the approach outlined in Fig. 2 as a charge integrator requires only the conventional preamplifier with R1 replaced by a small relay in series with a 10‐MΩ resistor (R1a, needed to prevent oscillation while the relay is closed) and a circuit for closing the relay. If the output voltage is being measured by an analog-to-digital converter and monitored by a microprocessor, the signal to close the relay can be generated by software, and only a driver-to-power relay coil needs to be added. The potential errors in measuring charge with this circuit stem from leakage currents in the input transistor and in the surrounding circuit assembly, as they do with any charge integrator or low current electrometer. Leakage can occur through the relay, across circuit boards, or from the input of the device. With good electrometers, these currents are generally limited to on the order of 10−14 amps (Keithley Instruments Inc. 2014), or 6 × 10⁻¹³ C min−1.
The charge sensitive preamplifier circuit developed by Radeka (1970) for use with early Rossi proportional counters has proven to be an extremely useful low-noise circuit. Consequently, the Radeka circuit was chosen as the basis for a charge integrator of the type illustrated in Fig. 2b. However, progressively lower leakage integrated circuits continue to be developed and may offer reduced minimum current integrators in the future (∼10−15 amps likely, Analog Devices 2014).
One major concern in dosimeter development is the performance of the proportional counters to be used. To evaluate proportional counter performance, the pulse height distributions collected for different radiations have to be analyzed. In order to obtain the pulse height data and to begin the development of the charge integrator based on the Radeka preamplifier design, the standard preamplifier circuit was implemented using surface mount components on printed circuit boards designed to operate inside the vacuum chamber with the proportional counter, Fig. 1b. Placing the preamplifier inside the vacuum chamber eliminates the capacitance to ground that is inherent in the feedthroughs required when placing the preamplifier outside the vacuum system and thus reduces the electronic noise. This approach has proven to be very successful in several experiments (Perez-Nunez and Braby 2011).
Various circuits for resetting the charge integrator (i.e., discharging the feedback capacitor), including semiconductor switches, were tested, but the most successful approach was the use of a miniature reed relay. These relays use switch contacts mounted in a glass capsule inside a solenoid electromagnet and are approximately the size of a conventional integrated circuit package. Many brands and models are available, and several were tested. Since the voltage across the relay will be limited to 10 V or less, an effective resistance of 1016 Ω will limit leakage current through the relay to 10−15 amps, 10% of the current that the authors anticipate measuring. The rated leakage resistance of these devices is typically 1010 to 1012 Ω, but previous experience has shown that the actual resistance is typically much higher if the devices are properly cleaned. A resistor, R1a in Fig. 2b, is required to limit the current during the reset process and to prevent oscillation. The value of R1a is not critical, but 107 Ω is convenient and provides a reset time constant of 10 μs, which is short compared to the time required for relay operation.
To minimize leakage current associated with other components of the charge integrator, a custom input board was designed using Rexolite plastic and metal terminals, instead of printed circuit traces, to mount components. The input transistor, feedback and test capacitors, and reset relay were mounted on a single board. A wire lead (rather than surface mount) 2N4416 was used for the input transistor because its glass header provides higher leakage resistance than the plastic surface mount version. The bias current of the input JFET was adjusted to minimize leakage current to the transistor gate. The leakage current of the resulting assembly is typically less than 10−14 amps, although the current is higher for the first few minutes of operation if the charge integrator has been turned off.
One advantage of using this charge integrator is that the detector performance can be tested at any time by simply making an AC connection to an external shaping amplifier and multichannel analyzer. This can be done by attaching a capacitor to a test point at the output of the charge integrator. This connection does not interfere with charge data collection, so the dose-mean lineal energy can be determined by the variance method and by pulse-height analysis for exactly the same radiation exposure. However, this feature will be used for prototype testing only.
Electronics package, algorithm, and software
The electronics package consists of three interconnected printed circuit boards: sensor board, daughterboard, and main board. The sensor board is used to interface the charge integrator with the daughterboard and main board through plug-in and wired connectors. The daughterboard is where the charge integrator signal is conditioned and converted to digital information. It also contains the chip for USB communications. The main board contains a microcontroller and low noise power supplies. The electronics package is powered by a DC supply nominally between 5.7–9.0 V; either a 6‐V or 9‐V battery can be used.
The charge integrator output, which typically ramps from −1.5 to +5 V, is fed into a differential amplifier on the daughterboard. Voltage divider resistors on the output of the differential amplifier scale the integrator signal to match the input of the analog-to-digital converter (ADC). The integrator voltage is converted to a 24‐bit digital output signal. The converted data is transferred to a memory buffer in the microcontroller on the main board for processing. For the prototype, the sample rate for algorithm calculation can be programmed from 1 to 770 samples s−1. A rate of 10 samples s−1 was used for the test measurements presented here.
On the main board, the digital signal from the ADC is input via serial interface to a microcontroller. In addition to processing the integrator signal and performing calculations, the microcontroller performs two other critical functions. First, a digital output port automatically resets the charge integrator through a transistor on the sensor board. The charge integrator reset voltage level is programmable and typically set between 4 and 5 V DC. Second, the microcontroller sets and maintains the negative high voltage level. The voltage level is typically set at −650 V.
A variance/covariance method using two different detectors that are sufficiently separated from each other can create difficulties in situations where space, mass, and power requirements are limited. For these reasons, the authors have adapted the statistically based method using only one detector to measure a sequence of charges during successive time intervals of equal duration. The concept assumes two virtual detectors, where detector 1 is assigned values during the odd numbered intervals and detector 2 is assigned values during the even numbered intervals. There is no limit on the total change in dose rate over the extended measurement period, but the rate of change between successive intervals must be small enough so that no significant change in dose rate occurs during the odd-even pair. This can be assured by automatically linking sampling rate to dose rate (not done for this prototype instrument).
The authors have employed an algorithm based on a statistical approach developed by Borak and Chapman (2014). It extracts the microdosimetric quantities frequency mean lineal energy ( ) and dose mean lineal energy (
 ) from measurements of energy imparted in N successive time intervals of equal duration. The energy imparted in a given interval, Yi, is the sum of random events from the underlying single event distribution where the number of events in an interval is also random.
Naively, one would expect that  , which is the second moment of the population divided by the first moment of the population, would be estimated simply by the sample analogs of the random sum of those quantities:

The evaluation of this estimator for  was based on computing the expectations of the numerator in eqn (1):

and denominator

to extract the first and second moments of the underlying single event spectrum. However, the simple ratio of

does not yield  because of an extra term in the numerator due to dispersion caused by the random number of events in each interval. The analysis showed that this dispersion could be removed from eqn (4) by inserting a term in the numerator based on the expectation of the product of energy imparted for successive intervals.

This approximation provides an exact solution for over-dispersion when the mean number of events per interval (i.e., dose rate) remains constant during the total period of time required to accumulate data for N intervals. The expectation analysis also showed that the algorithm can provide a suitable estimate of  when there are linear trends in the dose rate during the measurement process.
The final algorithm

was programmed into a Texas Instruments 16‐bit microcontroller. The programming language used is ANSI C. The C program file was compiled with TI’s Code Composer Studio Version 4 through a USB-Debug-Interface converter. The C programming follows a command structure that is used to control the microcontroller from LabView or a terminal program such as HyperTerminal or TeraTerm.
The charge integrator voltage, which varies between −1.5 and +5 V dc, can be sampled at intervals determined by the desired sampling rate (for the tests described here, 10 samples s−1 was used) and placed in a buffer for processing. For the present prototype, the number of samples per dataset in the buffer is fixed at 300. Once the buffer has received 300 samples, the dataset is analyzed by the algorithm. The algorithm requires a sample set composed of the voltage difference between consecutive samples of raw voltage data from the charge integrator.
As illustrated and described below, the microprocessor calculates absorbed dose rate, dose equivalent rate, and total integrated dose and transmits them serially to a laptop computer with LabView software, which simulates the display that would exist on a hand-held or other unit in space.
TESTING AND VALIDATION
Prior to integrating with the microprocessor, the detector (Fig. 1) was evaluated for response to background (beam turned off), 226 MeV protons (0.42 keV μm−1), and 200 MeV n−1 carbon ions (16 keV μm−1) at the Heavy Ion Medical Accelerator (HIMAC) of the National Institute of Radiological Sciences in Chiba, Japan. For these measurements, a multichannel analyzer (MCA) was used to collect the data from the pulse heights processed by a spectroscopic amplifier.
Observed in Fig. 3 are the MCA spectra measured for protons and carbon ions. These are compared with a background measurement when the beam was turned off. For these measurements, the authors used identical high-voltage and exposure durations. One can see that these low-LET protons were detected above background, which was one of the considerations in performing the initial prototype test measurements. Another consideration was evaluating the angular dependence of the sensor. The carbon-ion results were used to characterize the response as a function of incident angle as described below.
Fig. 3.

MCA spectra compared for 226‐MeV protons and 200‐MeV n−1 carbon ions. Background (source off) is plotted for comparison. The x-axis was converted from channel number to pulse height in volts.
Prior to these measurements, the detector was filled and calibrated using 241AmBe neutrons at Texas A&M University (TAMU). The neutron drop-point was identified, and a conversion factor obtained for y (keV μm−1) per channel. The  results listed below for 200 MeV n−1 carbon were obtained using this neutron drop-point calibration.
The angular dependence of the detector was evaluated using plane parallel beams of C-12 ions at 200 MeV n−1 with incident angles 0, 45, 75, and 90 degrees relative to a plane perpendicular to the anode wire. The  values obtained as a function of angle are listed in Table 1. It is notable that the
  values do not indicate appreciable angular dependence, although some (about 10%) decrease is suggested at the 90° position.
Table 1.
Dose mean lineal energy ( ) measured for 200 - MeV n−1 carbon as a function of angle.

For the following source testing experiments, the TEPC prototype was fully integrated with the microprocessor, which was programmed to operate in variance-covariance mode. A laptop computer with LabView software (National Instruments, Austin, TX, USA) was used to display the data generated by the prototype and to permit remote operation.
The prototype was exposed to a broad range of gamma-ray dose rates at the Stanford Linear Accelerator Center (SLAC) health physics instruments calibration facility. Both 137Cs and 60Co gamma-ray sources were used. A NIST calibrated tissue-equivalent ion chamber was used as a standard to measure dose rate at the detector position. The rate of charge increase in the charge integrator was shown to be proportional to dose rate. This is observed in Fig. 4, where the slope of the charge increase (measured in V s−1) is plotted as a function of dose rate. In this case, the net slopes are plotted; i.e., slopes measured with radiation source minus slopes measured without the radiation source. The results demonstrate (1) a linear response from ambient GCR levels to the much higher dose rates possible from a large SPE, likely less than 100 mGy h−1 during EVA (Wilson et al. 2006) and much less inside a spaceship or a shielded planetary habitat; and (2) a reproducible response as observed for measurements made on different dates using two different gamma-ray sources. It is noted that a linear response was also observed for 241AmBe neutrons tested over a similar range of slopes (from 0.0125 to 1.278 V s−1) at TAMU (data not shown). These results demonstrate system linearity and reproducibility for the measurement of charge integration, which is proportional to absorbed dose rate.
Fig. 4.

Linear response of the prototype to a broad range of gamma-ray dose rates. Net slopes are slopes measured with radiation source minus slope measured without radiation source. The slope measured without radiation source was determined to be 0.21 ± 0.02 V s−1 and resulted from a leakage current that was observed to be stable during these test measurements, permitting confident background subtraction.
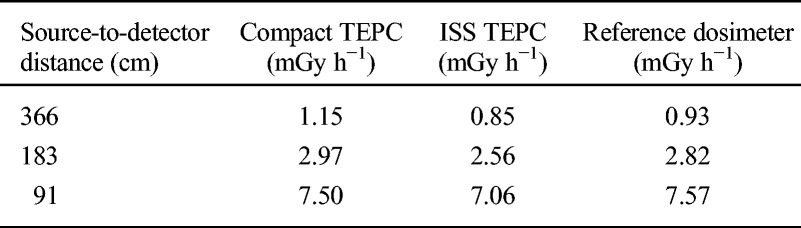
Measurement results obtained using the compact TEPC were also compared with results from other radiation dosimeters exposed to either 137Cs gamma rays or 241AmBe neutrons at TAMU. For 137Cs gamma rays, comparisons were made between responses of the compact TEPC, a 2‐in cylindrical TEPC operating in the pulse height mode and being prepared for deployment to the ISS, and a calibrated Far West 80‐cc tissue-equivalent ion chamber (TEIC). In this comparison, the Far West 80‐cc TEIC was used as the standard reference dosimeter. The results are seen in Table 2. The compact TEPC was within 1% and 5% of the standard Far West ion chamber at 7.50 and 2.97 mGy h−1, respectively, but was 24% higher than the TEIC at 1.15 mGy h−1 due to the leakage current in the charge integrator. The TEPC operating in pulse-height mode was consistently about 9% low, probably due to the loss of low y events, which are blocked by the lower level discriminator. The results confirmed that the compact TEPC correctly measures absorbed dose rate, at least at the dose rates used for these intercomparisons. Further reductions in the leakage current of the charge integrator will be achieved with new integrated circuit developments and will reduce errors at low-dose rates.
Table 2.
Gamma-ray intercomparisons.
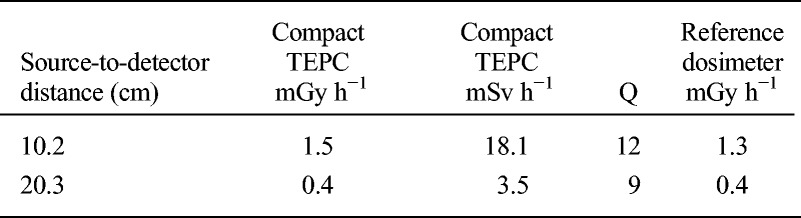
For 241AmBe fission neutrons, comparisons were made with results obtained using the calibrated 80‐cc Far West TEIC reference dosimeter. Results are seen in Table 3. The measured dose rates for 241AmBe neutrons agree well with the reference dosimeter results. The absorbed dose rates (mGy h−1) and dose-equivalent rates (mSv h−1) for the two source-to-detector distances were calculated in real-time by the compact TEPC microprocessor. The algorithm in the microprocessor calculates the quality factor (Q) for each sampling set (in this case, 300 measurements) based on ICRP (1991) with the assumption that  equals the dose-mean LET (ICRU 1983) and then obtains the dose-equivalent rate for each sampling set from the product of Q and the absorbed dose rate. The results from a sufficient number of sampling sets are then averaged to provide mSv h−1 and Q for the compact TEPC data in Table 3. The results for Q of 9 and 12 are in agreement with Q values of about 10 obtained for 241AmBe neutrons using TEPCs with 2‐μm simulated diameter (Al-Bayati 2012).
Table 3.
Neutron intercomparisons.
CONCLUSION
In conclusion, a compact TEPC prototype has been developed and initial radiation testing performed. The TEPC is being designed to meet the stringent requirements for future deep-space human exploration missions. Key characteristics include small mass (∼250 g), low power consumption (∼0.5 W), omni-directionality, tissue equivalence, broad LET response (can detect minimally ionizing protons), and broad dose-rate response that includes both GCR and SPE radiations. The TEPC can provide absorbed dose to skin during SPE and determine absorbed dose to BFO (with buildup cap), and it demonstrates good reproducibility.
Acknowledgments
The authors acknowledge support from the National Space Biomedical Research Institute (NSBRI) through grant RE01302 at NASA Ames Research Center (T. Straume, PI) and Texas A&M University (L. Braby, Co-PI), and grant RE01301 at Colorado State University (T. Borak, PI). We wish to acknowledge the support and assistance provided by administrative and technical personnel at the Heavy Ion Medical Accelerator (HIMAC) at the National Institute of Radiological Sciences in Chiba, Japan; at the NASA Space Radiation Laboratory (NSRL) in Brookhaven National Laboratory; at the 88” Cyclotron Facility at the Lawrence Berkeley National Laboratory; and at the Stanford Linear Accelerator Center (SLAC). Valuable advice and assistance were provided by C. Zeitlin and K. Neal at the Southwest Research Institute (SwRI) and J. Miller at LBNL. Graduate students L. Manglass and D. Oertli were instrumental in assembling equipment, performing experiments and analyzing data at Colorado State University (CSU). R. Adame and J. Jablonski (CSU) were responsible for timely and precise manufacturing of parts and supplies for detector components. H. Tran was responsible for microelectronics and microprocessor programming support at NASA Ames and H. Liu supported the pre-amplifier development efforts at TAMU.
Footnotes
The authors declare no conflicts of interest.
(Manuscript accepted 6 May 2015)
REFERENCES
- Al-Bayati SN. The application of experimental microdosimetry to mixed-field neutron-gamma dosimetry. Ontario: University of Ontario Institute of Technology; 2012. Thesis. [Google Scholar]
- Analog Devices. 2015. Available at http://www.analog.com/en/products/amplifiers/operational-amplifiers/low-input-bias-current-amplifiers.html Accessed 3 March 2015.
- Benjamin PW, Kemshall CD, Redfearn J. A high resolution spherical proportional counter. Nucl Instr Meth 59: 77– 85; 1968. [Google Scholar]
- Borak TB, Chapman PL. Description and verification of an algorithm for obtaining microdosimetric quantities for high-LET radiation using a single TEPC without pulse height analysis. Radiat Res 182: 396– 407; 2014. [DOI] [PubMed] [Google Scholar]
- Breckow J, Wenning A, Roos H, Kellerer AM. The variance–covariance method: microdosimetry in time varying low dose-rate radiation fields. Radiat Environ Biophys 27: 247– 259; 1988. [DOI] [PubMed] [Google Scholar]
- Gersey B, Borak TB, Zeitlin CJ, Miller J, Heilbronn L, Murakami T, Iwata Y. The response of a spherical tissue equivalent proportional counter to 56Fe particles from 200-1000 MeV/nucleon. Radiat Res 157: 350– 360; 2002. [DOI] [PubMed] [Google Scholar]
- Guetersloh SB, Borak TB, Taddei PB, Zeitlin CJ, Heilbronn L, Miller J, Murakami T, Iwata Y. The response of a spherical tissue-equivalent proportional counter to different ions having similar LET. Radiat Res 161: 64– 71; 2004. [DOI] [PubMed] [Google Scholar]
- International Commission on Radiological Protection. 1990 recommendations of the International Commission on Radiological Protection. Oxford: Pergamon Press; ICRP Publication 60; Ann ICRP 21(1/3); 1991. [Google Scholar]
- International Commission on Radiation Units and Measurements. Microdosimetry. Bethesda, MD: ICRU; ICRU Report 36; 1983. [Google Scholar]
- Keithley Instruments, Inc. 2015. Available at www.keithley.com/products/dcac/highresistance/?nm=6487 Accessed 7 April 2015.
- Kellerer AM, Rossi HH. On the determination of microdosimetric parameters in time-varying radiation fields. Radiat Res 97: 237– 245; 1984. [Google Scholar]
- Lillhok JE. The microdosimetric variance–covariance method used for beam quality characterization in radiation protection and radiation therapy. Stockholm: Department of Medical Radiation Physics, Stockholm University; 2007. Dissertation. [Google Scholar]
- Lillhok JE, Grindborg J-E, Lindborg L, Gudowska I, Carlsson G, Söderberg J, Kopéc M, Medin J. Nanodosimetry in a clinical neutron therapy beam using the variance–covariance method and Monte Carlo simulations. Phys Med Biol 52: 4953– 4966; 2007. [DOI] [PubMed] [Google Scholar]
- Lindborg L, Hultqvist M, Tedgren AC, Nikjoo H. Lineal energy and radiation quality in radiation therapy: model calculations and comparison with experiment. Phys Med Biol 58: 3089– 3105; 2013. [DOI] [PubMed] [Google Scholar]
- Perez-Nunez D, Braby LA. Replacement tissue-equivalent proportional counter for the international space station. Radiat Protect Dosim 143: 394– 397; 2011. [DOI] [PubMed] [Google Scholar]
- Radeka V. Charge amplification without charge leak resistor. IEEE Trans Nucl Sci 17: 433– 439; 1970. [Google Scholar]
- Rademacher SE, Borak TB, Zeitlin C, Heilbronn L, Miller J. Wall effects observed in tissue equivalent proportional counters from 1.05 GeV/nucleon 56Fe Particles. Radiat Res 149: 387– 395; 1998. [PubMed] [Google Scholar]
- Wilson JW, Anderson BM, Cucinotta FA, Ware J, Zeitlin CJ. Spacesuit radiation shield design methods. Troy, MI: SAE International; SAE Report 2006‐01‐2110. 2006. [Google Scholar]