Abstract
Beta-lactoglobulin (BLG), a bovine dairy protein, is a promiscuously interacting protein that can bind multiple hydrophobic ligands. Fatty acids (FAs), common hydrophobic molecules bound to BLG, are important sources of fuel for life because they yield large quantities of ATP when metabolized. The binding affinity increases with the length of the ligands, indicating the importance of the van der Waals (vdW) interactions between the hydrocarbon tail and the hydrophobic calyx of BLG. An exception to this rule is caprylic acid (OCA) which is two-carbon shorter but has a stronger binding affinity than capric acid. Theoretical calculations in the current literature are not accurate enough to shed light on the underlying physics of this exception. The computed affinity values are greater for longer fatty acids without respect for the caprylic exception and those values are generally several orders of magnitude away from the experimental data. In this work, we used hybrid steered molecular dynamics to accurately compute the binding free energies between BLG and the five saturated FAs of 8 to 16 carbon atoms. The computed binding free energies agree well with experimental data not only in rank but also in absolute values. We gained insights into the exceptional behavior of caprylic acid in the computed values of entropy and electrostatic interactions. We found that the electrostatic interaction between the carboxyl group of caprylic acid and the two amino groups of K60/69 in BLG is much stronger than the vdW force between OCA’s hydrophobic tail and the BLG calyx. This pulls OCA to the top of the beta barrel where it is easier to fluctuate, giving rise to greater entropy of OCA at the binding site.
Keywords: Beta-lactoglobulin (BLG), fatty acid (FA), steered molecular dynamics (SMD), binding free energy
Introduction
Milk, a complete food for the mammalian neonate, can supply fatty acids (FAs), vitamins, carbohydrates, inorganic elements, and proteins. Beta-lactoglobulin (BLG), which has been studied extensively in both isolated and naturally occurring states, is the major whey protein present in the milk of many ruminant species.1 Bovine BLG is a relatively small protein of 162 amino acid residues, with a molecular weight of 18.4 kDa.2 There are several genetic variants of BLG, with the A and B variants being the most common which differ by two amino acids at positions 64 and 118.3 These two variants both have nine beta-strands which form a flattened and conical barrel, called a calyx (Fig. 1).4 BLG belongs to the lipocalin family, which typically contain a beta-barrel, inside which small hydrophobic molecules can usually be found.5 Native BLG has one main well-defined binding site per monomer which is formed by the calyx as show in Fig. 1.6–8
Fig. 1.
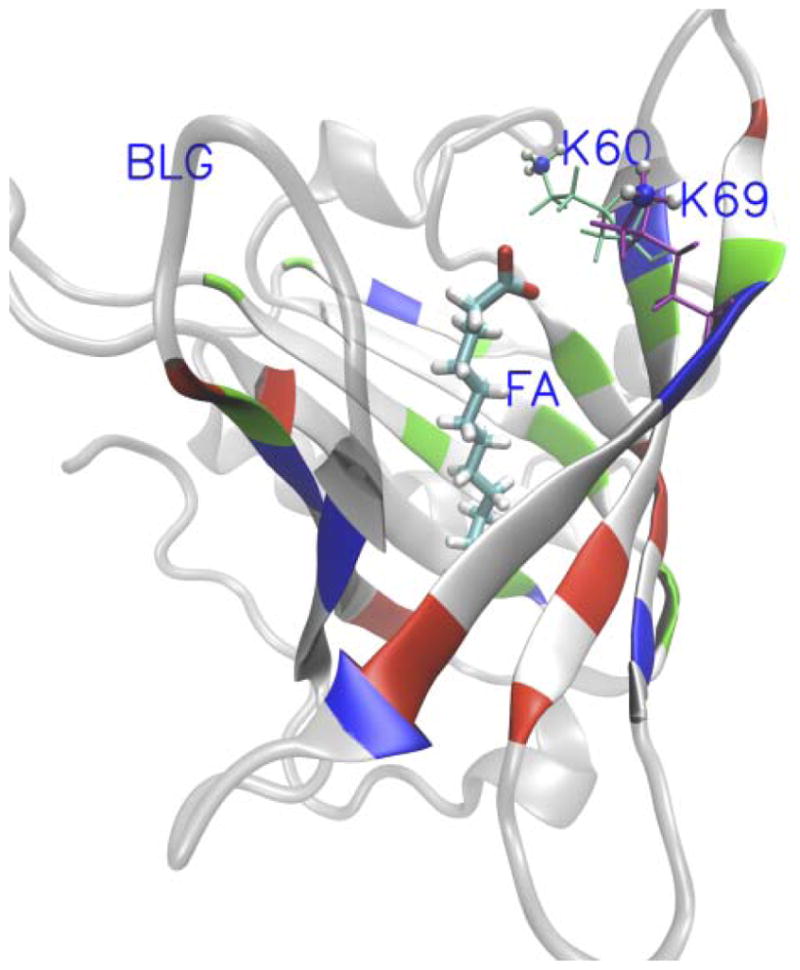
Crystal structures of BLG-FA complex. The fatty acid is represented by Licorice. The N-groups and the rest of K60/69 are represented by VDW and lines, respectively. The beta sheets of BLG are represented by NewCartoon colored by residues types in Opaque and others of BLG are colored by grey in transparent. This graphics were rendered with VMD.9
Fatty acids, common hydrophobic molecules bound to BLG, are carboxylic acids with an unbranched aliphatic chain. They are important sources of fuel for life because they yield large quantities of ATP when metabolized. Many cell types can use fatty acids for energy. There exist many configurations in the complex of beta-lactoglobulin and fatty acids (FAs). The binding properties between BLG and different fatty acids characterized by experimental and theoretical methods are reported.10–14 Most authors agree that there are two main interactions between BLG and the fatty acids. One is hydrophobic interaction between the aliphatic chain and cavity formed by the beta-strands of the protein, the other is the electrostatic interaction between the carboxyl group of fatty acids (C-group) and the two amino groups of K60/69 (N-groups) which are located at the entrance of the cavity (Fig. 1). All fatty acids have similar structure differing only in the length of the hydrocarbon chain. Longer hydrocarbon chains strengthen the interaction between BLG and the FA due to the greater van der Waals forces. But the eight-carbon caprylic acid is an exception, whose binding affinity is greater than that of the ten-carbon capric acid according to experimental results (Fig. 2). Why this? There is no satisfactory explanation about this exception.
Fig. 2.
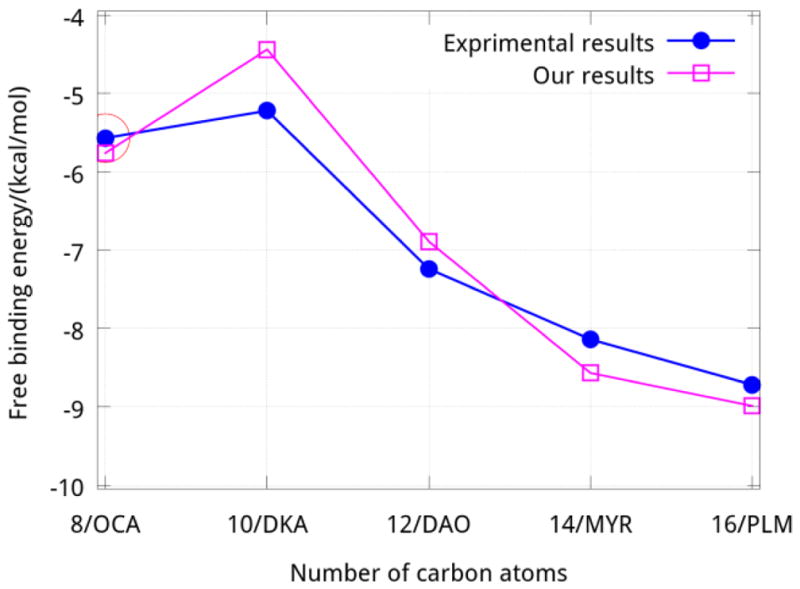
The free energy of binding between BLG and FAs
In this work, we computed the free energy of binding between native bovine beta-lactoglobulin (BLG) and caprylic acid (C8:0, OCA, Octanoic acid), capric acid (C10:0, DKA, Decanoci acid), lauric acid (C12:0, DAO, Dodecanoic acid), myristic acid (C14:0, MYR, Tetradecanoic acid), palmitic acid (C16:0, PLM, Hexadecanoic acid) using hybrid steered molecular dynamics15–17 (hSMD) at neutral pH value. Though many methods, such as molecular mechanics generalized Born/Poisson-Boltzmann surface area (MM-GB/PBSA),12, 13, 18–22 are popular for calculation of binding free energy, they tend to disagree with experimental results. Listed in Table 1 are the results calculated by GBSA. The values of these results agree with experimental results only in general trend. Quantitatively, results from GBSA are quite far away from experiments. Additionally, the sequence of free energy of binding BLG to OCA and DKA are contrary between the results of GBSA and experimental data. On the other hand, hSMD has been validated to be able to calculate accurately the absolute binding free energy.15–17 In each of these configurations the aliphatic tail is immersed in the hydrophobic cavity, whereas the carboxyl moiety, highly exposed to the bulk, interacts with nearby amino acids (K60 and K69) at the cavity’s entrance. The values found for the free energy of binding agree well with experimental data. In agreement with previous studies, we found that the binding affinity increases with the length of the fatty acids.2, 13, 21 Interestingly, the binding affinity of the eight-carbon acid (OCA) is greater than that of the ten-carbon acid (DKA).11 In this paper we aim to address this difference and to seek an explanation for this exceptional “behavior” of OCA based on accurate free energy calculations.
Table 1.
The free energies of BLG-FA complex (kcal/mol)
| Fatty acids | Det(Å12) | ΔPMF | Eb | ΔGGBSA2,13 | ΔGexp10,11 |
|---|---|---|---|---|---|
| C8:0 OCA | 0.2260 | −10.78 ±0.76 | −5.76 ±0.76 | −2.66 | −5.57 |
| C10:0 DKA | 0.0300 | −6.09 ±1.08 | −4.44 ±1.08 | −4.40 | −5.22 |
| C12:0 DAO | 0.2130 | −12.85 ±1.25 | −6.89 ±1.25 | −12.37 | −7.24 |
| C14:0 MYR | 0.0003 | −17.63 ±0.82 | −8.57 ±0.82 | −12.66 | −8.14 |
| C16:0 PLM | 0.0013 | −16.59 ±0.87 | −8.99 ±0.87 | −20.92 | −8.72 |
Materials and methods
System Settings
The crystal structures of BLG conjugated with OCA, DKA, DAO, MYR and PLM were downloaded from the Protein Data Bank (pdb) using the entries 3NQ9, 3NQ3, 3UEU, 3UEV and 3UEW, respectively. All crystallographic water molecules were deleted in our starting model. The PDBs (3NQ9 and 3NQ3) including the fatty acids OCA and DKA had a complete list of residues, whereas the others were missing 4–6 residues. Patching was performed on the proteins when initializing the structure with the VMD software. The Charmm27 force field23–25 was used to reproduce the parameters of proteins and fatty acids. For the purpose of mimicking physiological conditions, each system was solvated in a cubic box of water and sodium chloride was added to the solution and the concentration of ions was set to 150mM/L.
Molecular Dynamics Simulation Parameters
For all systems, equilibrium MD and non-equilibrium hybrid steered molecular dynamics (hSMD) simulations were carried out using Langevin stochastic dynamics with the NAMD program26. The systems were simulated in the NPT ensemble at the constant temperature of 300K and constant pressure of 1atm using the Nose-Hoover Langevin piston pressure control27, 28 implemented in NAMD. The time step was set to 1 fs and the unit cell grid used for Particle Mesh Ewald (PME), which describes the electrostatic force, was 128×128×128. The non-bonded list was generated using a cutoff distance of 10Å. The CA atoms of the beta-sheet and alpha-helix were kept fixed to their original position for the entire simulation. The ligands were pulled along the D direction (defined by the bottom and the entrance of calyx) at the constant speed of 2.5 Å/ns in all simulations.
Calculation of Absolute Binding Free Energy
The standard binding affinity at one binding site is related to the potential of mean force (PMF) as15
| (1) |
The 3D integrations are over the x, y, z coordinates of the ligand’s positon r1. r1 is the ligand’s position which was chosen as the center of mass of one segment of or the whole ligand. W[r1] is the 3D PMF. The subscripts “site” and “bulk” indicate that r1 is near the PMF minimum and r1=r1∞ in the bulk region far from the protein, respectively. Since ligand is not small, it can be better described with the positions (r1, r2, … rn) of n centers of mass of its n segments. Based on the relationship15 of between the 3D and 3n-D PMFs and the following equation.
| (2) |
We can calculate the absolute binding free energy from the hybrid steered molecular dynamics (hSMD) method15, 16, using following equation.
| (3) |
Where kB and T are the Boltzman’s constant and the temperature of simulation. Both W(r10, r20, …, rn0) and W(r1∞, r2∞, …, rn∞) are the Potential of Mean Forces (PMF) of the complex in its bound and dissociated state, respectively. c0 =6.02×10⁻⁴ Å−3. Zn0 and Zn∞ are two terms related with the bound state and the dissociated state.
Standard SMD involves pulling one center of mass of one-selection of the ligand atoms using a spring of finite, carefully chosen, stiffness. The hSMD approach involves pulling n (n=1,2,3,…) centers of mass of n selected segments of the ligand and using n springs of infinite stiffness to disallow any fluctuation of the pulling centers along the way to produce the PMF curve. hSMD does not make use of the constraining potential at any time during the simulation and therefore dose not require careful removal of artifacts as in the conventional SMD.
Because of the relative short lengths of fatty acids used in this study, we will steer only two centers of mass. Therefore, we can rewrite the above formula as follows:
| (4) |
Here W(r10, r20) and r10/r20 are the PMF of the complex and the positions of the first and second steered atoms in their bound states, while W(r1∞, r2∞) and r1∞/r2∞ are the PMF of the complex and the positions of the two steered atoms in their corresponding dissociated states.
For all BLG-FA complexes in this work, the two steered centers of mass correspond to those of the first and last carbon atoms of the fatty acid in Fig. 3. To carry out the calculation of Eb, we need to compute three main terms in equation (4). The first is the difference (ΔPMF) in potential of means force (PMF) between one chosen bound state and its corresponding dissociated state. Next, the partial partition function of the bound state is approximated below as Gaussian29,
Fig. 3.
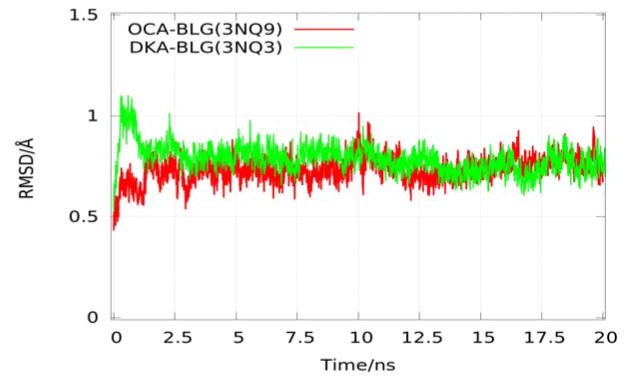
Root-mean-square-deviations (RMSD) of CA atoms relative to their initial minimized complex structures as function of time
| (5) |
| (6) |
| (7) |
The term Det represents the determinant; it reflects in this case the entropy of BLG-FA. δx1 defined as δx1 = x1 − 〈x1〉, is the measure of fluctuation of the index atoms with respect to its average position. The third and last term to compute is the partial partition function defined bellow.
| (8) |
Where W∞(r) is the PMF (reversible work) for stretching the fatty acid between the two steered centers; it is a function of r, the distance between the two centers.
Simulation
All molecular dynamics simulations were used to minimize and to equilibrate each system for 2 ns and 2.5~5 ns, respectively; the CA atoms of the beta-sheet and alpha-helix were all kept fixed during this and the following steps except those resulting from the patches added to the BLG-FA complexes list above. The methodological simplification of keeping fixed the CA atoms of the beta-sheet and alpha-helix during the simulation is based on the assumption that the crystal structure is close enough to the real structure in aqueous environment. This simplification is valid only when the fixed CA atoms do not deviate significantly between the bound and the dissociated states, of course. This will be the case if the binding pocket (or calyx) is much greater than the ligand. Fortuiously, in the systems we studied, that is indeed the case (Fig. 4), consequently hosting a fatty acid there via vdW/hydrophobic interactions does not alter the beta-sheet and alpha-helix conformation.
Fig. 4.
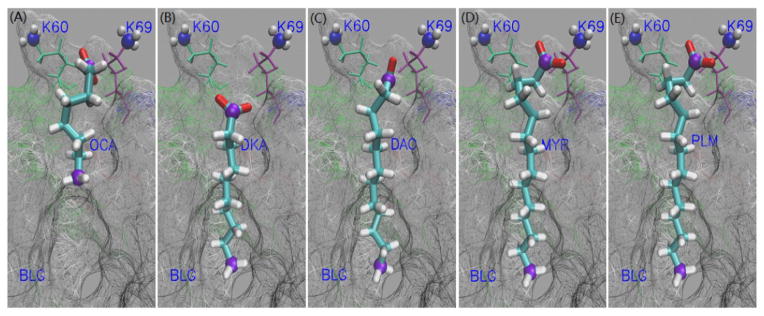
Crystal structures of FA-BLG complex. The fatty acids are represented by Licorice, while the first and the last carbon atoms of the FA are represented by CPK in violet color. The N-groups and the rest of K60/69 are represented by VDW and lines, respectively. The part of BLG protein (residues shielding our eyes are deleted) is represented by Surf by residues type in Wireframe representation method. For (A)–(E), the fatty acid is OCA, DKA, DAO, MYR and PLM, respectively. These graphics were rendered with VMD.9
Once all system were equilibrated, we extracted the coordinates of the first (C1) and the last carbon atom (Cm; For OCA, DKA, DAO, MYR and PLM, m= 8, 10, 12, 14, 16, respectively) to be steered in the following 15 ns relaxing process. We computed Z20 in the bound state. The ligand was then dragged far enough to separate the FA from the protein. In the transition from bound state to unbound state, the initial conformation to start the hSMD was arbitrarily selected from the equilibrated conformations. In this case, we selected the last conformation after equilibration, We performed four times, each time equilibrating the starting conformation for 2 ns. The PMF difference (ΔPMF) of each complex was the average of the four results obtained. In the third and last step, corresponding to the fatty acid being in the unbound state, the Cm atom is kept fixed while the first atom C1 is steered along the D1m direction (from the first carbon atom C1 to the last one Cm of FA) at a constant speed of 2.5Å/ns. Z2∞ are computed. After these three parts were obtained, according to formula (4), the free energy of binding for each BLG-FA complex was calculated.
Results and Discussion
Since the CA atoms of the beta-sheet and alpha-helix were all kept fixed for the entire simulation, all the systems began to reach equilibrium from 2.5 ns~5 ns. Figure 3 shows the RMSD plots of CA atoms of the complexes BLG-OCA and BLG-DKA since their minimization states. From the equilibrated states of each BLG-FA, the binding affinity values were computed by conducting five sets of SMD runs. In each set, one FA was pulled out of the calyx. Following the schemes described above and using two steering centers (the first and the last carbon atoms of FA shown in Fig. 4), we obtained the PMF along the dissociation path from the binding site of FAs (Fig. 5). From Fig. 5 and Table 1, we can see that the PMF difference values (ΔPMF), one of the three factors contributing to the free energy, is a function of the number of carbon atoms except the DKA system and the results agree well with experimental results in rank. From equation (4) above, with fluctuations at the bound state and rotation and fluctuation in the bulk being fully accounted for, the free energy of binding for each BLG-FA complex was calculated and the results are reported in Table 1. It is easy to see how well the values obtained using the novel technique hSMD agree well with experimental data of the free energy of binding of BLG-FA. It is worthy of noting that the free energy of BLG-OCA, −5.76 kcal/mol, is greater than that of BLG-DKA, −4.44 kcal/mol, in agreement with the experimental data.
Fig. 5.
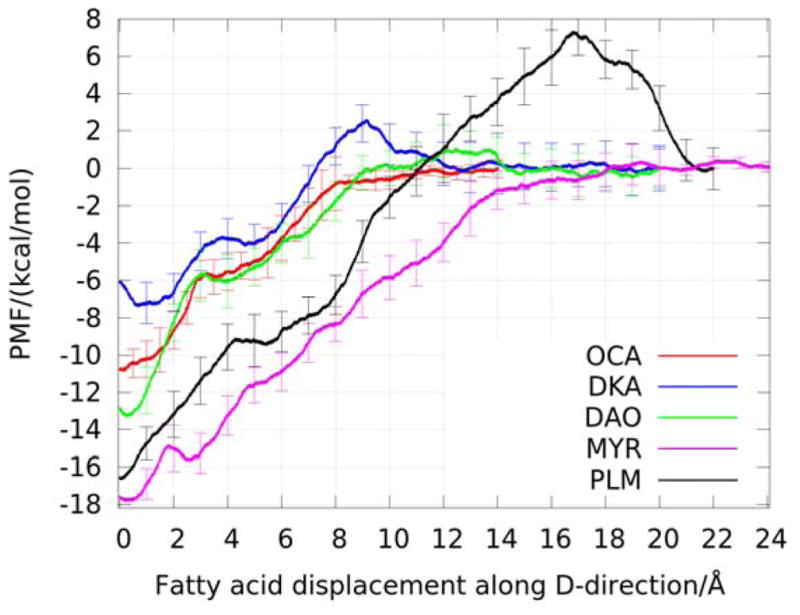
The PMF along the path of pulling FA out of the binding pocket
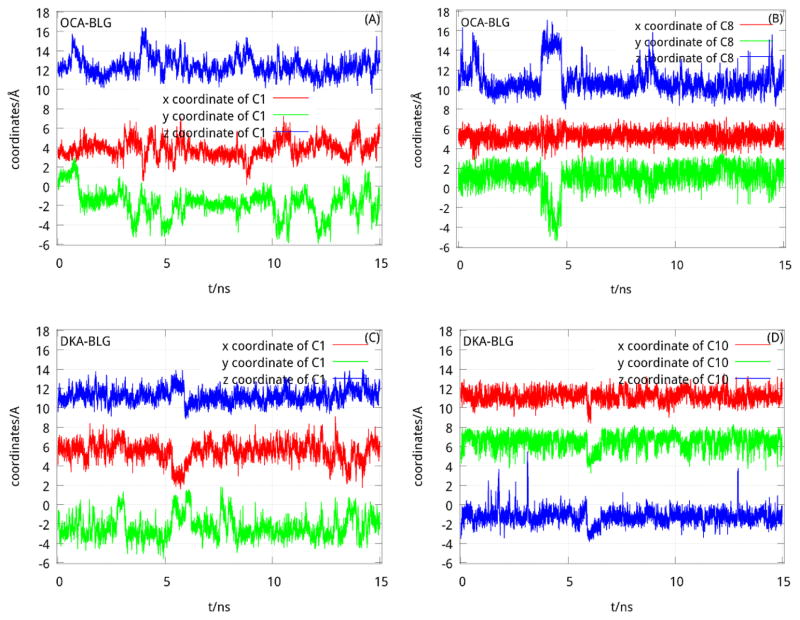
The term Det which appears in Table 1 is tied to the entropy of the complex BLG-FA. We can see that the complex of BLG-OCA has the highest entropy (0.226Å12). An explanation of this result is linked to the size of OCA. The shorter length of OCA provides it with more room to fluctuate inside the cavity of BLG. It was validated in Fig. 6 that the amplitudes of coordinates of C1 and C8 carbon atoms of caprylic acid in BLG-OCA complex are obviously greater than that (C1 and C10) in BLG-DKA complex. A direct consequence of this is an increase in entropy with a final value higher than other complexes in this study. This entropy increases the binding energy of OCA to BLG by favoring the motion of OCA inside the cavity of the protein.
Fig. 6.
The coordinates of the steered atoms:(A) and (B) are the coordinates of C1 and C8 of OCA in BLG-OCA complex, respectively; while (C) and (D) are the coordinates of C1 and C10 of DKA in BLG-DKA complex, respectively.
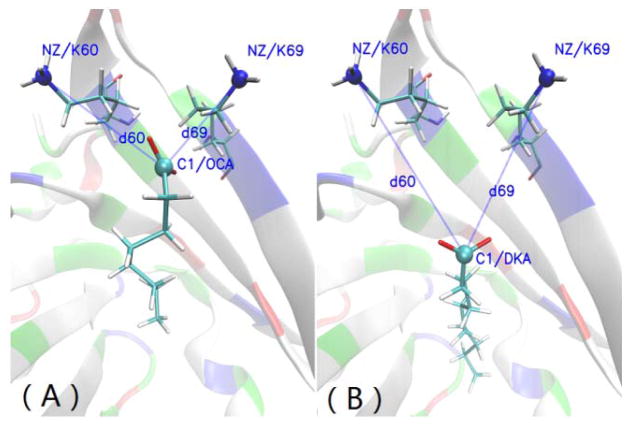
From the Fig. 4(A)–(E), one can clearly see that the bottoms of the tail of all fatty acids except the OCA are at the same level. Interestingly, the carboxyl groups of OCA and other FAs are closer to the entrance of the cavity than the head of DKA. When the fatty acid is inside the cavity (Fig. 1), there are two main interactions: the van de Waals forces between the carbon chain of the FA and the hydrophobic cavity of BLG, and the electrostatic interaction between the carboxyl moiety and the amino acids (K60 and K69 shown in Fig. 1) of the protein in the cavity. As shown in Table 2 and as expected, van der Waals interactions (Evdw) become greater as the number of carbon atoms in the FA increases. This is easy to understand. We can see from the Table 2 that thought the same carboxyl group in FA, the electrostatic interactions (Eele) between FAs and BLG vary greatly in magnitude. The highest is −91.08 kcal/mol between OCA and BLG, while the lowest is −21.97 kcal/mol between DKA and BLG. Additionally, we computed the electrostatic energies ( ) and the vdW interactions ( ) between the C-group (C1, O1 and O2) of fatty acid and the N-groups (NZ, HZ1, HZ2 and HZ3) of K60/69. The results are reported in Table 2. The variation in electrostatic interaction between C-group and N-group in each system of BLG-FA complexes is also considerable. The value in the BLG-OCA complex (−108.98 kcal/mol) is six times higher than that of BLG-DKA complex (−18.96 kcal/mol). To understand this, we calculated the distance (d60 and d69) between the C1 atom of the fatty acids and NZ atom of K60/69 (Fig. 7). The distances between the C1 atom and the N atoms of K60/69 in BLG-DKA, 9.73Å and 8.06Å (Table 3), are furthest among all the BLG-FA complexes. This agrees with the value in the crystal system and the calculated electrostatic interaction.
Table 2.
Electrostatic and vdW interactions in energy terms between the C-group of fatty acids and the NZ-groups of K60/69 in BLG and energy terms between the BLG and FAs (kcal/mol)
| Fatty acids |
|
|
Eele | Evdw | ||
|---|---|---|---|---|---|---|
| C8:0 OCA | −108.98 | 3.74 | −91.08 | −12.40 | ||
|
| ||||||
| C10:0 DKA | −18.96 | 0.08 | −21.97 | −18.15 | ||
| C12:0 DAO | −43.24 | 0.66 | −58.90 | −18.86 | ||
| C14:0 MYR | −71.27 | 1.29 | −57.26 | −27.50 | ||
| C16:0 PLM | −75.36 | 1.66 | −62.03 | −29.53 | ||
and are the electrostatic and van der Waals interaction energy values between the C-group of FA and N-groups of K60/69 in BLG-FA complexes, respectively. Eele and Evdw are the electrostatic and van der Waals interaction energy levels between the FA and protein in BLG-FA complexes, respectively. The values are averaged over the 15-ns snapshots in the relaxing process.
Fig. 7.
The distances between the C1 atom of the fatty acids (OCA and DKA) and N atoms of K60/69: The fatty acid and K60/69 are represented by Licorice. The C1 atoms of the fatty acids and N atoms of K60/69 are represented by CPK and colored by name. The BLG is represented by NewCartoon in Opaque as background. This graphics were rendered with VMD.9
Table 3.
Distances between the C1 of fatty acid and NZ atoms of K60/69 in BLG-FA (Å)
| Fatty acids | d60 | d69 | ||
|---|---|---|---|---|
|
| ||||
| simulation | crystallography10,11, 30 | simulation | crystallography10, 11,30 | |
|
| ||||
| C8:0 OCA | 5.22 | 6.80 | 5.86 | 4.97 |
| C10:0 DKA | 9.73 | 8.69 | 8.06 | 8.74 |
| C12:0 DAO | 7.86 | 7.48 | 6.64 | 5.89 |
| C14:0 MYR | 5.23 | 7.34 | 6.26 | 3.20 |
| C16:0 PLM | 5.95 | 5.96 | 4.61 | 3.91 |
d60 and d69 are the distances between the C1 atom and the NZ atoms of K60/69 in BLG-FA complex, respectively. The values are averaged over the 15-ns snapshots in the relaxing process.
The electrostatic interaction between the C-group and the N-groups at the entrance of the cavity is greater than the vdW interaction of the whole BLG-FA complex. This is especially true for OCA where the electrostatic interaction (−108.98 kcal/mol) is almost 10 times the vdW interaction (−12.40 kcal/mol) between OCA and BLG. In the case of the DKA, the electrostatic interaction is of the same order with the vdW interaction of BLG-DKA (Table 2). From Fig. 8, it is also clear that the electrostatic interaction between the C-group and the N-groups in BLG-OCA complex is far greater than the vdW interaction between OCA and protein for more than half the time of the 15-ns (Fig. 8(A)), while the electrostatic interaction varies around the vdW interaction between DKA and protein during the simulation (Fig. 8(B)). This strong electrostatic interaction, added to the shortest length of the FA, is sufficient to move OCA closer to the entrance of the cavity than DKA. A direct consequence of this is a stronger binding of OCA to BLG than that of DKA.
Fig. 8.
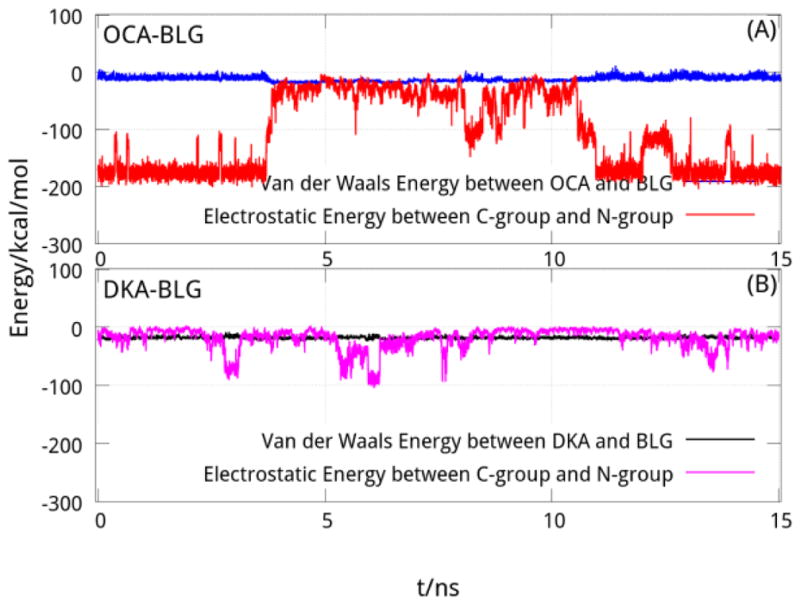
The electrostatic and vdW energy of complex of OCA and DKA binding BLG
From Table 2, it can be seen that the lowest vdW energy of the BLG-FA complex increases with the number of carbon atoms of the fatty acid. Its smallest value is for the BLG-OCA complex. This will lead to a weaker interaction with the hydrophobic cavity of the protein, hence, allowing the carboxyl group of OCA to stay closer to K60/69. On the other hand, BLG-PLM has the highest vdW interaction energy and will therefore have the strongest hydrophobic interaction. The strong hydrophobic interaction will drag the tail of the FA deeper in the cavity. But because of the number of its carbon atoms, the entire ligand cannot fit in the calyx; this explains why in its equilibrated state the carboxyl group of PLM is almost in contact with the bulk. We can say that, as the length of the FA increases, it becomes more difficult for the protein to contain the entire ligand in its cavity, although an increase in length correspond to a stronger vdW energy. The best balance between the hydrophobic interaction and the length of the FA is observed for DKA (Fig. 4), where the entire ligand is well deep inside the cavity and its carbonyl group is far away from the bulk.
Conclusion
Three terms must be taken into ccount when computing the binding free energy between BLG and FAs: the van der Waals interaction, the entropy and the electrostatic interactions. Electrostatic energy varies with the distance between the carboxyl group of fatty acids and the N-groups of K60/69 in the protein, while the entropy and the van der Waals energies change with the length of the fatty acid. We showed that the entropy contribution is the highest for the shortest ligand OCA. We believe that entropy and electrostatic energy are both important factors influencing the binding affinities of fatty acids to beta-lactoglobulin. These quantities are greater for BLG-OCA than for BLG-DKA, and can be the reason why the binding free energy of OCA to BLG is greater than that of DKA. We expect these results to provide some useful guidance for new food discovery.
Acknowledgments
The authors thank Dr. Liao Y. Chen for guidance. The authors also thank support from the NIH (GM084834) and the computing resources provided by the Texas Advanced Computing Center at University of Texas at Austin.
References
- 1.Le Maux S, Bouhallab S, Giblin L, Brodkorb A, Croguennec T. Dairy Sci Technol. 2014;94:409–426. doi: 10.1007/s13594-014-0160-y. [DOI] [PMC free article] [PubMed] [Google Scholar]
- 2.Bello M, Garcia-Hernandez E. Biopolymers. 2014;101:744–757. doi: 10.1002/bip.22454. [DOI] [PubMed] [Google Scholar]
- 3.Godovac-Zimmermann J, Krause I, Baranyi M, Fischer-Fruhholz S, Juszczak J, Erhardt G, Buchberger J, Klostermeyer H. J Protein Chem. 1996;15:743–750. doi: 10.1007/BF01887148. [DOI] [PubMed] [Google Scholar]
- 4.Papiz MZ, Sawyer L, Eliopoulos EE, North AC, Findlay JB, Sivaprasadarao R, Jones TA, Newcomer ME, Kraulis PJ. Nature. 1986;324:383–385. doi: 10.1038/324383a0. [DOI] [PubMed] [Google Scholar]
- 5.Flower DR. Biochem J. 1996;318(Pt 1):1–14. doi: 10.1042/bj3180001. [DOI] [PMC free article] [PubMed] [Google Scholar]
- 6.Wu SY, Perez MD, Puyol P, Sawyer L. J Biol Chem. 1999;274:170–174. doi: 10.1074/jbc.274.1.170. [DOI] [PubMed] [Google Scholar]
- 7.Kontopidis G, Holt C, Sawyer L. J Dairy Sci. 2004;87:785–796. doi: 10.3168/jds.S0022-0302(04)73222-1. [DOI] [PubMed] [Google Scholar]
- 8.Ragona L, Fogolari F, Zetta L, Perez DM, Puyol P, De Kruif K, Lohr F, Ruterjans H, Molinari H. Protein Sci. 2000;9:1347–1356. doi: 10.1110/ps.9.7.1347. [DOI] [PMC free article] [PubMed] [Google Scholar]
- 9.Humphrey W, Dalke A, Schulten K. J Mol Graph Model. 1996;14:33–38. doi: 10.1016/0263-7855(96)00018-5. [DOI] [PubMed] [Google Scholar]
- 10.Loch JI, Polit A, Bonarek P, Olszewska D, Kurpiewska K, Dziedzicka-Wasylewska M, Lewinski K. Int J Biol Macromol. 2012;50:1095–1102. doi: 10.1016/j.ijbiomac.2012.03.002. [DOI] [PubMed] [Google Scholar]
- 11.Loch J, Polit A, Gorecki A, Bonarek P, Kurpiewska K, Dziedzicka-Wasylewska M, Lewinski K. J Mol Recognit. 2011;24:341–349. doi: 10.1002/jmr.1084. [DOI] [PubMed] [Google Scholar]
- 12.Bello M, Gutierrez G, Garcia-Hernandez E. Biophys Chem. 2012;165:79–86. doi: 10.1016/j.bpc.2012.03.009. [DOI] [PubMed] [Google Scholar]
- 13.Bello M. Biopolymers. 2014;101:1010–1018. doi: 10.1002/bip.22483. [DOI] [PubMed] [Google Scholar]
- 14.Chen J, Wang J, Zhu W, Li G. J Comput Aided Mol Des. 2013;27:965–974. doi: 10.1007/s10822-013-9693-z. [DOI] [PubMed] [Google Scholar]
- 15.Chen LY. J Chem Theory Comput. 2015;11:1928–1938. doi: 10.1021/ct501162f. [DOI] [PMC free article] [PubMed] [Google Scholar]
- 16.Chen LY. Molec Membrane Biol. 2015;32:19–25. doi: 10.3109/09687688.2015.1006275. [DOI] [PMC free article] [PubMed] [Google Scholar]
- 17.Hu GD, Xu SC, Wang JH. Chem Biol Drug Des. 2015 doi: 10.1111/cbdd.12598. [DOI] [Google Scholar]
- 18.Chen J, Wang J, Zhang Q, Chen K, Zhu W. J Biomol Struct Dyn. 2015 doi: 10.1080/07391102.2014.1003146.1-13. [DOI] [PubMed] [Google Scholar]
- 19.Ren S, Zeng J, Mei Y, Zhang JZ, Yan SF, Fei J, Chen L. Drug Metab Dispos. 2013;41:60–71. doi: 10.1124/dmd.112.048264. [DOI] [PubMed] [Google Scholar]
- 20.Yi CH, Chen JZ, Shi SH, Hu GD, Zhang QG. Mol Simulat. 2010;36:454–460. [Google Scholar]
- 21.Bello M, Portillo-Tellez MD, Garcia-Hernandez E. Biochemistry. 2011;50:151–161. doi: 10.1021/bi1016155. [DOI] [PubMed] [Google Scholar]
- 22.Yi CH, Zhang QG. Acta Chimica Sinica. 2010;68:2029–2034. [Google Scholar]
- 23.Brooks BR, Brooks CL, 3rd, Mackerell AD, Jr, Nilsson L, Petrella RJ, Roux B, Won Y, Archontis G, Bartels C, Boresch S, Caflisch A, Caves L, Cui Q, Dinner AR, Feig M, Fischer S, Gao J, Hodoscek M, Im W, Kuczera K, Lazaridis T, Ma J, Ovchinnikov V, Paci E, Pastor RW, Post CB, Pu JZ, Schaefer M, Tidor B, Venable RM, Woodcock HL, Wu X, Yang W, York DM, Karplus M. J Comput Chem. 2009;30:1545–1614. doi: 10.1002/jcc.21287. [DOI] [PMC free article] [PubMed] [Google Scholar]
- 24.MacKerell AD, Bashford D, Bellott M, Dunbrack RL, Evanseck JD, Field MJ, Fischer S, Gao J, Guo H, Ha S, Joseph-McCarthy D, Kuchnir L, Kuczera K, Lau FT, Mattos C, Michnick S, Ngo T, Nguyen DT, Prodhom B, Reiher WE, Roux B, Schlenkrich M, Smith JC, Stote R, Straub J, Watanabe M, Wiorkiewicz-Kuczera J, Yin D, Karplus M. J Phys Chem B. 1998;102:3586–3616. doi: 10.1021/jp973084f. [DOI] [PubMed] [Google Scholar]
- 25.Mackerell AD, Jr, Feig M, Brooks CL., 3rd J Comput Chem. 2004;25:1400–1415. doi: 10.1002/jcc.20065. [DOI] [PubMed] [Google Scholar]
- 26.Phillips JC, Braun R, Wang W, Gumbart J, Tajkhorshid E, Villa E, Chipot C, Skeel RD, Kale L, Schulten K. J Comput Chem. 2005;26:1781–1802. doi: 10.1002/jcc.20289. [DOI] [PMC free article] [PubMed] [Google Scholar]
- 27.Martyna GJ, Tobias DJ, Klein ML. J Chem Phys. 1994;101:4177–4189. [Google Scholar]
- 28.Feller SE, Zhang YH, Pastor RW, Brooks BR. J Chem Phys. 1995;103:4613–4621. [Google Scholar]
- 29.Chen LY. Biochim Biophys Acta. 2013;1828:1786–1793. doi: 10.1016/j.bbamem.2013.03.008. [DOI] [PMC free article] [PubMed] [Google Scholar]
- 30.Evoli S, Guzzi R, Rizzuti B. Proteins. 2014;82:2609–2619. doi: 10.1002/prot.24625. [DOI] [PubMed] [Google Scholar]


