Abstract
Purpose
We present a polarization-sensitive optical detection platform for label-free quantitative optical biosensing diagnosis using liquid crystals (LCs). This is capable of determining quantitatively the optical birefringence of optical cells containing LCs, whose orientation depends on the immobilized biomolecules.
Patients and methods
This technique uses a polarization-dependent double-port detection without any polarizer at a single wavelength and removes the need of aligning optical cells of LCs in the azimuthal direction, with respect to the light path through the optical cell. Thus, this technique enables a stand-alone detection in a relatively compact format without an additional optical instrument, such as a retardation compensator, a Michael–Levy chart, and a spectrophotometer, in order to determine the optical birefringence quantitatively.
Results
We demonstrate that bovine serum albumin immobilized on the gold surface of the cell hybrid interfaces that support both homeotropic and planar anchoring of LCs causes optical phase retardation change which can be determined quantitatively. We also provide estimation of the zenithal orientation of LCs near the gold surface of the hybrid interfaces, based on the phase retardation determined. The estimated limit of bovine serum albumin detection is approximately 2.1 μM.
Conclusion
This optical technique with LCs can serve an optical platform for label-free quantitative diagnosis of proteins in a real time manner.
Keywords: biological sensors, LC orientation, protein sensing, tag-free diagnosis
Introduction
Liquid crystals (LCs) that exhibit an intermediate phase between solid and liquid find a broad range of applications that include not only image display devices but also nanoscale material fabrication1–4 and label-free optical biosensing.5–14 What makes LCs useful mainly stems from its optical anisotropy properties such as optical birefringence, which arises from the different refractive indices along two molecular axes of LCs, ie, no and ne along the ordinary and the extraordinary axes, respectively. The orientations of LCs dominate changes in optical birefringence of LCs, and its control forms a basis of electro-optical switching and LC-based optical biosensors.
Recently, LCs have been employed to detect biological species such as nucleic acids,10 peptides,11,12 proteins,6,9 viruses,13,14 etc. In these techniques, biomolecules of interest were imaged by spotting and amplifying their presence, making them attractive biosensor transducers without fluorophores or enzymes. Most of LC-based biosensors studied so far comprised optical cells where LCs were in contact with two surfaces of materials, which were chemically functionalized to form two interfaces confining them. This optical cell was then sandwiched between two orthogonal polarizers (the so-called source polarizer and an analyzer) for optical birefringence analysis, as shown in Figure 1.
Figure 1.
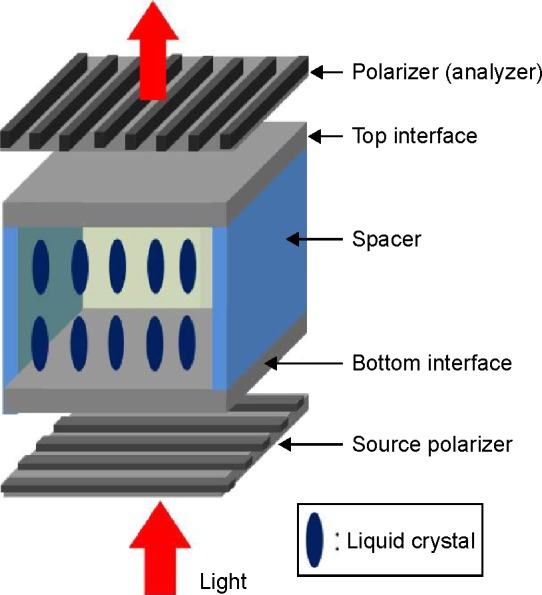
Schematic for measurement of cell birefringence-dependent luminance using two polarizers.
The two interfaces of the optical cell governed the orientations of the LCs near the interfaces and further influenced their orientations within the optical cell. The LCs’ orientation then accounted for the corresponding optical birefringence and thus governed luminance of light emitting from the analyzer. Thereby, the detection of optical luminance with its color enabled one to recognize the presence of the biological species immobilized on one of the interfaces. Further, signal processing of the luminance led to estimating concentrations of the target molecules immobilized on the interface. Optical birefringence of LCs in the two-polarizer scheme, however, had to be obtained by using an additional instrument/method, such as a retardation compensator, a Michael–Levy chart,15 and a spectrophotometer.16 This indicates the limited capability of a quantitative measurement of optical birefringence of LCs in the two-polarizer scheme without such an additional device or method which made the whole detection system bulky and costly. Recently, our group has reported optical birefringence-assisted sensing platform for label-free optical biosensing with the aid of a plasmonic sensing head, where combined effects of optical intensity and birefringence were measured for quantitative diagnosis of analytes with the minimum resolvable refractive index of approximately 10−6 RIU.17
In this paper, we present an optical sensing system with an optical cell that contains LCs of 4-cyano-4′-pentylbiphenyl (5CB) for a quantitative optical biosensing without a spectrophotometer or a retardation compensator. The key elements that make the detection system relatively compact include a rotatable half-wave plate (λ/2), a polarizing beam splitter, and a balanced detector (BD) that replaces a photodetector in a conventional system. These enable a quantitative diagnosis of optical birefringence induced by analytes immobilized on one interface of the optical cell. The detection technique presented needs no alignment of an optical cell with respect to the incident optical polarization due to the use of circular polarization of incident light. In addition, this technique can measure the induced birefringence quantitatively without a spectrophotometer.16 However, it should be noted that the technique presented cannot afford to provide the relevant optical images of LCs in real time, unlike that of Yang et al.17
The detection technique presented is a modified version of that reported in Nguyen et al18 for quantitative measurement of optical birefringence. Unlike the reported optical technique that used the combined effects of optical intensity and birefringence in Nguyen et al18 we can, however, extract only the birefringence information in this work to estimate LCs’ orientations subject to the properties of interface where biological molecules are immobilized. We arrange different types of hybrid interfaces with gold (Au) surface where bovine serum albumin (BSA) is immobilized. We demonstrate that BSA immobilization on Au surface decreases the degree of LC anchoring on the surface and thus changes optical birefringence. The detection technique presented enables one to obtain quantitative estimation of optical birefringence changes in real time. The experimental measurements allow theoretical estimate of quantitative zenithal orientation of LCs near the Au surface responsible for such birefringence change.
Material and methods
Preparation of optical cells with 5CB
Prior to surface treatment (such as octyltrichlorisilane [OTS] functionalization19 and deposition of metal layers) of the glass substrate,20 the entire substrates are rinsed with piranha cleaning procedure.19,20 After sequential deposition of a titanium (Ti) layer of 8 nm thickness and a Au layer of 20 nm thickness, using an electron beam evaporator with a deposition angle of 0° or 45°, the Au-coated surface is treated with ethanolic solution of 1 mM octanethiol or 1 mM 11-mercaptoundecanoic acid (11-MUA). For the purpose of BSA detection, BSA molecules are immobilized onto the 11-MUA-treated Au surface activated with 50 mM N- hydroxysuccinimide and 200 mM N-(3-dimethylaminopropyl)-N′-ethylcarbodiimide hydrochloride.
Optical cells are fabricated by pairing a bottom substrate (eg, an OTS-treated glass, a Au-coated glass or a Au-coated glass with BSA-immobilization) with a top substrate (an OTS-treated glass). The slides are then aligned facing each other while being kept apart by inserting a plastic spacer of the thickness 12 μm at the edge of the surfaces. The cells are held together using a pair of binder clips and heated to approximately 40°C by placing on a warm plate and applying heat with a heat gun. After 5CB is heated to a temperature of its isotropic phase (>35°C) within a glass syringe, it is dispensed into the optical cell cavity. The 5CB is then drawn into the space between the two surfaces by capillary forces. Next, the cell is slowly cooled to room temperature over a period of 1 hour. Upon cooling, the 5CB shifts from the isotropic to the nematic phase.
Results
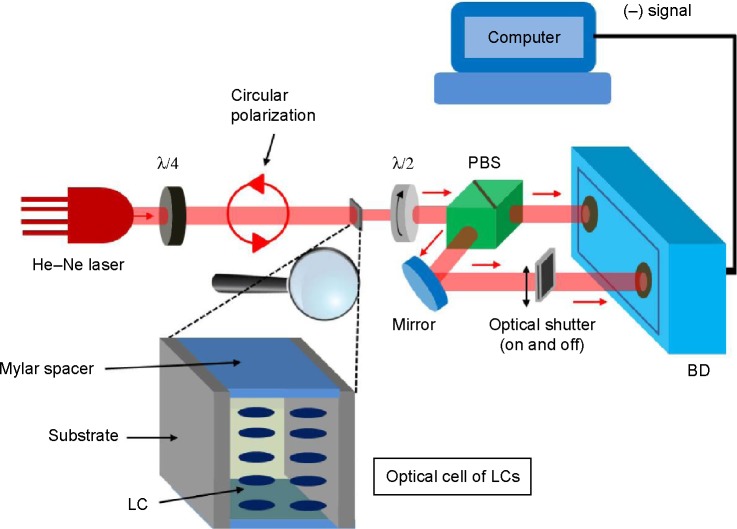
A visible light source (He–Ne laser at the wavelength [λ] of 632.8 nm) at which LCs are transparent is passed through the optical cell of LCs, as shown in Figure 2. Circular polarization of light is secured at the input of the optical cell, using a quarter-wave plate (λ/4) placed before the optical cell of thickness d in order to ensure optimized detection of the birefringence of LCs regardless of their orientations inside the cell. This implies that an optical cell containing LCs does not need to be aligned at a specific azimuthal angle, unlike the measurement technique using two polarizers.
Figure 2.
Schematic for measurement of cell optical birefringence using polarization-sensitive double-port detection.
Abbreviations: λ/4, quarter-wave plate; λ/2, half-wave plate; PBS, polarizing beam splitter; BD, balanced detector; LCs, liquid crystals.
The light at the output of the optical cell is then passed through a rotatable λ/2, allowing both vertical and horizontal polarizations of the output light to be rotated simultaneously. The subsequent polarizing beam splitter divides the light into vertical and horizontal polarizations, each of which will then enter the BD’s respective port. The BD produces the electrical signals (S_) in proportion to the subtraction of horizontally polarized light intensity (SH) from the vertically polarized one (SV), as given by:
| (1) |
Here, α is the proportionality constant associated with conversion of optical power into electric voltage, Iout is the light intensity at the output of the optical cell, θ is the angle between the effective ordinary axis of the optical cell and the horizontal axis, and φ is the angle between the optic axis of the λ/2 and the horizontal axis. The optical retardation of the optical cell is given by:
| (2) |
The detailed derivation of Equation 1 can be found in Nguyen et al.18
The rotation of λ/2 allows both the maximum and the minimum of S_ to be achieved and the subsequent subtraction (S) between the maximum and minimum is given by:
| (3) |
Unlike Nguyen et al18 we use an optical shutter to block the light entering one port of the BD, eg, the port for vertically polarized light, as shown in Figure 2, and measure the BD output (S_ with SV =0) while rotating λ/2 by 180°. This aims to eventually obtain the maximum and the minimum of the BD output (S_), as done above with the two open ports of the BD. Note that the S_ in this case corresponds to the subtraction between optical intensity of horizontally polarized light and zero intensity of vertically polarized light. Even in this case, maximum and minimum of S_ can be obtained by rotating λ/2. Then, the sum of the maximum and minimum of the S_ becomes birefringence independent, giving . Thus, we can estimate the γ as given by:
| (4) |
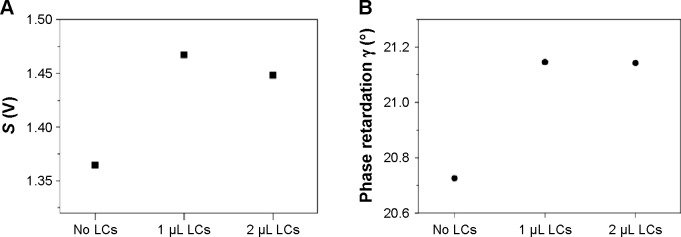
In this work, we use the top substrate of an optical cell as a reference interface, which is supposed to produce least birefringence in this system. Various surfaces such as OTS-functionalized glass surface and glass substrate where Au is deposited at 45°, can be used as a reference interface that can be reproducible. The OTS-functionalized surface supports homeotropic orientation of LCs and is expected to produce the smaller optical birefringence than the other. We experimentally check the birefringence properties of the two kinds of interfaces by measuring S and γ. Figure 3A and B show the S and γ for optical cells with the OTS–OTS interfaces, while Figure 4A and B for optical cells with the Au45–Au45 interfaces. The Au45 interface is treated with octanethiol to make planar orientation of LCs. The injection of LCs (1 or 2 μL) into the optical cell causes the S to increase despite the fact that the transmitted intensity of light through the cells remains nearly unchanged for both cases (OTS–OTS interfaces and Au45–Au45 interfaces). This is due to the fact that the γ increases with the LCs injection compared to that of the empty cell, which reflects the inherent background birefringence. Note that, in the case of OTS–OTS interfaces, the γ increases by less than 5% with the LCs injection, revealing that the OTS–OTS interfaces allow the negligible response of the optical cell to the LCs injection or to its concentration change.
Figure 3.
Measured parameters S and γ for the optical cells with 5CB LCs (OTS–OTS interfaces).
Notes: (A) Parameter S ≡ max (S−) − min (S−) =2αIout sin γ; (B) optical phase retardation .
Abbreviations: LCs, liquid crystals; 5CB, 4-cyano-4′-pentylbiphenyl; OTS, octyltrichlorisilane.
Figure 4.
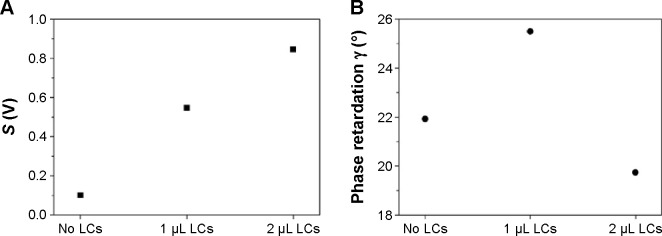
Measured parameters S and γ for the optical cells with 5CB LCs (Au45–Au45 interfaces). 2π
Notes: (A) Parameter S ≡ max (S−) − min (S−) =2αIout sin γ; (B) optical phase retardation .
Abbreviations: LCs, liquid crystals; 5CB, 4-cyano-4′-pentylbiphenyl; Au45, gold-coated surface at a deposition angle of 45°.
Meanwhile, for the optical cell with the Au45–Au45 interfaces (1 μL), the γ decreases much larger than OTS–OTS case, and further increase in injected LC concentration even decreases birefringence as shown in Figure 4B. This may be due to the fact that additional injection of LCs induces change in the orientations of LCs from planar to random orientations.
For BSA detection, we fabricate another pair of optical cells of the same size as before, each of which has both the OTS interface (reference) and the Au45 interface. The Au45 interface used is expected to produce the planar anchoring of LCs at a specific azimuthal angle on its surface, allowing for the hybrid interfaces with the OTS-based homeotropic anchoring. Under polarized optical microscope, optical image, which is uniform across the cell surface, is observed due to the planar anchoring with a given azimuthal direction of the hybrid interfaces. These hybrid interfaces are chosen to serve as a basis for a biosensor head, where we can harvest efficiently the change in its optical birefringence upon additional biomolecules immobilized on the Au interface.
Discussion
Figure 5A and B show the values of S, γ, and the corresponding zenithal angle θ for orientation of LCs at the OTS–OTS45 hybrid interfaces. θ is the average angle of the director of the LCs near the Au surface (measured from surface normal) and can be obtained using the following approximation for the hybrid interfaces:15
| (5) |
Figure 5.
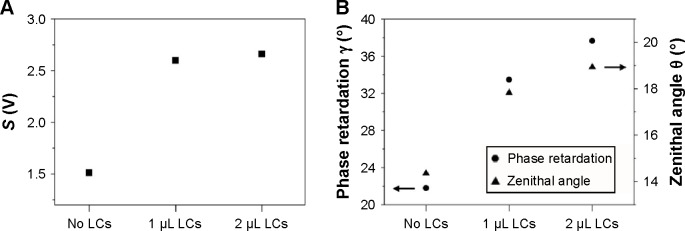
Measured parameters S and γ for the optical cells with 5CB LCs (OTS–Au45 interfaces).
Notes: (A) Parameter S ≡ max (S−) − min (S−) =2αIout sin γ; (B) optical phase retardation with the estimated zenithal angle θ of 5CB LCs.
Abbreviations: LCs, liquid crystals; 5CB, 4-cyano-4′-pentylbiphenyl; OTS, octyltrichlorisilane; Au45, gold-coated surface at a deposition angle of 45°.
The fact that the light intensity at the output of the optical cells does not change substantially with the LC concentration in the case of Figure 5A and B reflects the concentration-induced γ change. The hybrid interfaces used, therefore, yield higher sensitivity of the γ response to the LCs’ injection or to its concentration change than the OTS–OTS interfaces. θ characterizes the orientation of LCs near the Au interface and increases with the concentration. This reveals that the higher concentration of LCs that leads to the larger optical birefringence produces the higher degree of planar anchoring in the hybrid interfaces (OTS–Au45 interfaces).
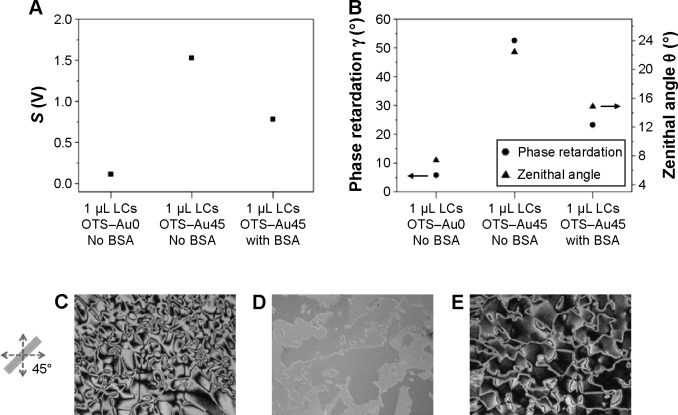
In order to see the effects of the Au deposition angle of the interface, we compare the two kinds of hybrid interfaces, ie, the hybrid interfaces described above (OTS–Au45 interfaces), and those consisting of the OTS-functionalized interface (reference) and the Au interface deposited at the angle of 0° (OTS–Au0 interfaces). As illustrated in Figure 6A and B, the OTS–Au0 interfaces with 1 μL LCs produce the S and the γ, both of which are substantially smaller than those of the OTS–Au45 interfaces, respectively, for the same amount of LCs injected in between. The OTS–Au0 hybrid interfaces provide a γ even smaller than that of the OTS–OTS interfaces. The fact that target biomolecules immobilized to LCs on the Au surface are likely to disrupt their orientations in a random fashion and consequently decrease γ leads us to use OTS–Au45 hybrid interface for sensing analyte molecules. This is due to the fact that planar anchoring of LCs on the Au surface (45° deposition) produces birefringence much larger than the case with Au surface of 0° deposition.
Figure 6.
Measured parameters S, γ, and the corresponding zenithal angle θ for the optical cells with 5CB LCs subject to the OTS–Au0 or the OTS–Au45 interfaces for the BSA sensing.
Notes: (A) Parameter S ≡ max (S−) − min (S−) =2αIout sin γ; (B) optical phase retardation with the estimated zenithal angle θ of 5CB LCs; (C) optical images of 5CB supported on OTS–Au0 with no BSA; (D) OTS–Au45 with No BSA; and (E) OTS–Au45 with BSA.
Abbreviations: LCs, liquid crystals; 5CB, 4-cyano-4′-pentylbiphenyl; OTS, octyltrichlorisilane; Au0, gold-coated surface at a deposition angle of 0°; Au45, gold-coated surface at a deposition angle of 45°; BSA, bovine serum albumin.
Note that the S, γ, and θ in the case of OTS–Au45 interfaces, with 1 μL LCs in between as shown in Figure 5A and B, are different from those shown in Figure 6A and B, respectively. This is due to the fact that we modify the Au surface with different chemicals (11-MUA) for BSA immo-bilization, which can cause change in LC orientation. Both this LC orientation change and variation of coupling of laser power into the fiber can account for such change in S and γ. However, we can still observe the optical image, which is uniform across the cell surface, under a polarized optical microscope.
For detecting BSA biomolecules, we choose to use the OTS–Au45 hybrid interfaces. We find that the immobilization of BSA biomolecules of concentration 10 mg/mL on its Au surface decreases the γ by 56% as shown in Figure 6B. This indicates that the immobilized BSA molecules reduces the optical anisotropy of the whole optical cell by weakening the degree of planar anchoring of the LCs near the Au surface. This feature is characteristic to a specific kinds of biomolecules and can thus be exploited for label-free (fluorophore-free) biosensor applications.
The standard deviation (δ) of output signal S in the optical cell without BSA is measured to estimate BSA detection limit21 (Clim) in the case of OTS–Au45 interface using the following equation:
| (6) |
where C is the BSA concentration. The Clim is approximately 140 μg/mL (corresponding to BSA concentration of 2.1 μM). The detection limit of the proposed system is lower than that using LCs polarization modulator for glucose sensor,22 but much higher than that using highly birefringent nematic LCs.23 This indicates that, in terms of detection limit, the presented optical platform with LCs is at least comparable to the conventional LC-based detection platform with two polarizers, and its detection limit can be improved by using LCs of intrinsically high birefringence.
We use a polarized light microscope (ECLIPSE LV100POL; Nikon, Tokyo, Japan) to view the images of the optical textures formed by the light transmitted through the optical cells filled with 5CB as illustrated in Figure 6C–E, for OTS–Au0 interfaces without BSA, OTS–Au45 interfaces without BSA, and OTS–Au45 interfaces with BSA, respectively. These images show qualitative agreement with the measured parameter values of γ due to the fact that the presence of defect lines represents random nature of LC orientations. In case of OTS–Au0 without BSA, due to the nonexistence of the anisotropic topography, the random orientation of LCs increases the orientational complexity of LCs through the entire LC domains, corresponding to small birefringence. In this case, there are more defect lines as shown in Figure 6C. However, the uniform orientation of LCs on the OTS–Au45 without BSA corresponds to higher birefringence. This stems from the anisotropic surface topography which is induced by homogeneous orientation of LCs through the LC domains. There are a smaller number of defect lines as shown in Figure 6D. In Figure 6E, LCs are at the intermediate orientation between random and uniform, and this represents the coexistence of partial-random and uniform orientation of LCs on the OTS–Au45 interfaces treated with BSA. The immobilization of BSA masks surface topography, which eventually induces the orientation change of LCs from uniform to random in some domains. This leads to decrease in birefringence of LCs. This can be checked by the defect lines of concentration at a level between those of OTS–Au0 No BSA and OTS–Au45 No BSA as shown in Figure 6E.
Conclusion
In conclusion, we present an optical detection platform that employs the polarization-sensitive double-port detection without polarizers. This platform measures optical birefringence of an optical cell containing LCs for label-free optical biosensor application. This method neither requires the prealignment of an azimuthal orientation of an optical cell with LCs, with respect to the optical components involved in the platform nor an additional optical instrument/method, such as a retardation compensator, the Michael–Levy chart, and a spectrophotometer, to estimate the optical birefringence quantitatively in a real time. We demonstrate that BSA immobilized on the Au surface in the OTS–Au45 interfaces induces change in optical phase retardation, and the estimated detection limit is approximately 2.1 μM. The experimental measurements allow us to provide the theoretical estimate of quantitative change in the zenithal orientation of LCs near the Au surface due to the BSA immobilization, which turns out to decrease the degree of planar anchoring of LCs on the Au surface.
Future study can cover the use of different concentration of BSA in different LC cell configurations. In addition, for the next form of the optical biosensor platform that delivers the birefringence information directly, the two steps of measurements described in this paper, ie, optical measurements with two BD ports open and that with only a single port open, can be automated in an integrated format with an additional signal process circuit that performs the simple calculation of Equations 3 and 4.
Acknowledgments
This research was supported by the Gachon University research fund of 2014 (GCU-2014-0157) and also by Basic Science Research Program through the National Research Foundation of Korea (NRF) funded by the Ministry of Education, Science and Technology (2011-0009353).
Footnotes
Disclosure
The authors report no conflicts of interest in this work.
References
- 1.Yang CS, Awschalom DD, Stucky GD. Growth of CdS nanorods in non-ionic amphiphilic triblock copolymer systems. Chem Mater. 2002;14:1277–1284. [Google Scholar]
- 2.Hulvat J, Stupp S. Liquid-crystal templating of conducting polymers. Angew Chem. 2003;42:778–781. doi: 10.1002/anie.200390206. [DOI] [PubMed] [Google Scholar]
- 3.Karanikolos GN, Alexandridis P, Mallory R, et al. Templated synthesis of ZnSe nanostructures using lyotropic liquid crystals. Nanotechnology. 2005;16:2372–2380. doi: 10.1088/0957-4484/16/10/063. [DOI] [PubMed] [Google Scholar]
- 4.Wan Y, Zhao D. On the controllable soft-templating approach to mesoporous silicates. Chem Rev. 2007;107:2821–2860. doi: 10.1021/cr068020s. [DOI] [PubMed] [Google Scholar]
- 5.Gupta VK, Skaife JJ, Dubrovsky TB, et al. Optical amplification of ligand-receptor binding using liquid crystals. Science. 1998;279:2077–2080. doi: 10.1126/science.279.5359.2077. [DOI] [PubMed] [Google Scholar]
- 6.Skaife JJ, Abbott NL. Quantitative interpretation of the optical textures of liquid crystals caused by specific binding of immunoglobulins to surface-bound antigens. Langmuir. 2000;16:3529–3536. [Google Scholar]
- 7.Skaife JJ, Abbott NL. Influence of molecular-level interactions on the orientations of liquid crystals supported on nanostructured surfaces presenting specifically bound proteins. Langmuir. 2001;17:5595–5604. [Google Scholar]
- 8.Han GR, Jang CH. Measuring ligand-receptor binding events on polymeric surfaces with periodic wave patterns using liquid crystals. Colloids Surf B Biointerfaces. 2012;94:89–94. doi: 10.1016/j.colsurfb.2012.01.023. [DOI] [PubMed] [Google Scholar]
- 9.Jang CH, Tingey ML, Korpi NL, et al. Using liquid crystals to report membrane proteins captured by affinity microcontact printing from cell lysates and membrane extracts. J Am Chem Soc. 2005;127:8912–8913. doi: 10.1021/ja051079g. [DOI] [PubMed] [Google Scholar]
- 10.Park SJ, Min JH, Hu QZ, et al. Detection of mRNA from Escherichia coli in drinking water on nanostructured polymeric surfaces using liquid crystals. Colloid Polym Sci. 2014;292:1163–1169. [Google Scholar]
- 11.Hu QZ, Jang CH. Using liquid crystals to report molecular interactions between cationic antimicrobial peptides and lipid membranes. Analyst. 2012;137:567–570. doi: 10.1039/c1an15743d. [DOI] [PubMed] [Google Scholar]
- 12.Park JS, Teren S, Tepp WH, et al. Formation of oligopeptide-based polymeric membrane at interfaces between aqueous phases and ther-motropic liquid crystals. Chem Mater. 2006;18:6147–6151. [Google Scholar]
- 13.Jang CH, Cheng LL, Olsen CW, et al. Anchoring of nematic liquid crystals on viruses with different envelope structures. Nano Lett. 2006;6:1053–1058. doi: 10.1021/nl060625g. [DOI] [PubMed] [Google Scholar]
- 14.Han GR, Song YJ, Jang CH. Label-free detection of viruses on a polymeric surface using liquid crystals. Colloids Surf B Biointerfaces. 2014;116:147–152. doi: 10.1016/j.colsurfb.2013.12.037. [DOI] [PubMed] [Google Scholar]
- 15.Miller DS, Carlton RJ, Mushenheim PC, et al. Introduction to optical methods for characterizing liquid crystals at interfaces. Langmuir. 2013;29:3154–3169. doi: 10.1021/la304679f. [DOI] [PMC free article] [PubMed] [Google Scholar]
- 16.Popov P, Mann EK, Jakli A. Accurate optical detection of amphiphilies at liquid-crystal-water interfaces. Appl Phys Express. 2014;1:034003(1)–034003(9). [Google Scholar]
- 17.Yang S, Wu C, Tan H, et al. Label-free liquid crystal biosensor based on specific oligonucleotide probes for heavy metal ions. Anal Chem. 2013;85:14–18. doi: 10.1021/ac302989h. [DOI] [PubMed] [Google Scholar]
- 18.Nguyen TT, Lee EC, Ju H. Bimetal coated optical fiber sensors based on surface plasmon resonance induced change in birefringence and intensity. Opt Express. 2014;22:5590–5598. doi: 10.1364/OE.22.005590. [DOI] [PubMed] [Google Scholar]
- 19.Tingey ML, Wilyana S, Snodgrass EJ, et al. Imaging of affinity micro-contact printed proteins by using liquid crystals. Langmuir. 2004;20:6818–6826. doi: 10.1021/la049728+. [DOI] [PubMed] [Google Scholar]
- 20.Luk YY, Tingey ML, Hall DJ, et al. Using liquid crystals to amplify protein-receptor interactions: design of surfaces with nanometer-scale topography that present histidine-tagged protein receptors. Langmuir. 2003;19:1671–1680. [Google Scholar]
- 21.Homola J. Surface plasmon resonance sensors for detection of chemical and biological species. Chem Rev. 2008;108:462–493. doi: 10.1021/cr068107d. [DOI] [PubMed] [Google Scholar]
- 22.Lo YL, Yu TC. A polarimetric glucose sensor using a liquid-crystal polarization modulator driven by a sinusoidal signal. Opt Commun. 2006;259:40–48. [Google Scholar]
- 23.Sun S-H, Lee M-J, Lee Y-H, Lee W, Song X, Chen C-Y. Immunoassays for the cancer biomarker CA125 based on a large-birefringence nematic liquid crystal mixture. Biomed Opt Express. 2015;6:245–256. doi: 10.1364/BOE.6.000245. [DOI] [PMC free article] [PubMed] [Google Scholar]


