

Abstract
Objective
Friedreich ataxia (FRDA) is an autosomal recessive ataxia resulting from mutations in the frataxin gene (FXN). Such mutations, usually expanded guanine–adenine–adenine (GAA) repeats, give rise to decreased levels of frataxin protein in both affected and unaffected tissues. The goal was to understand the relationship of frataxin levels in peripheral tissues to disease status.
Methods
Frataxin levels were measured in buccal cells and blood, and analyzed in relation to disease features. Site-directed mutant frataxin was also transfected into human embryonic kidney cells to model results from specific point mutations.
Results
There was no evidence for change in frataxin levels over time with repeated measures analysis, although linear regression analysis of cross-sectional data predicted a small increase over decades. GAA repeat length predicted frataxin levels in both tissues, and frataxin levels themselves predicted neurological ratings (accounting for age). Compound heterozygous patients for a GAA expansion and a point mutation in FXN generally had lower levels of frataxin than those homozygous for the presence of two GAA repeat expansions, though levels varied dramatically between tissues in some compound heterozygotes for point mutations. The G130V mutation led to decreased levels of frataxin in vitro as well as in vivo, while the R165C mutation produced normal immunoreactive levels of frataxin both in vitro and in vivo. Start codon mutations led to low levels of frataxin in buccal cells but preserved immunoreactive frataxin levels in blood.
Interpretation
The present data show that peripheral frataxin levels reflect disease features in FRDA, but emphasize the need for interpretation of such levels in the context of specific mutations.
Introduction
Friedreich ataxia (FRDA) is an autosomal recessive disorder associated with progressive ataxia, cardiomyopathy, scoliosis, and diabetes.1,2 In 98% of individuals, FRDA is caused by homozygous expanded guanine–adenine–adenine (GAA) repeats in the frataxin gene (FXN), with the other 2% of individuals being compound heterozygotes for a point mutation or, less commonly, a deletion3–9 in one allele and expanded GAA repeat on the other. The expanded GAA repeat decreases expression of the mitochondrial protein frataxin by disrupting mRNA transcription.1 Most pathogenic point mutations disrupt RNA splicing, translation initiation, or protein folding of frataxin and result in minimal functional protein.3–8 Other mutations (e.g., R165C, W155R, I154F, and G130V) are not within the core of the protein, and could give rise to dysfunctional frataxin that is present but less active.9,6 Thus, in all individuals, FRDA likely reflects loss of functional frataxin. Reduced frataxin levels impair the function of mitochondrial iron-sulfur-cluster-containing enzymes and ability to produce ATP.10,11 Frataxin-depleted cells have an increased sensitivity to oxidative stress.10,11
At present, no treatment is approved for FRDA, but multiple therapeutics in development may increase levels of frataxin. Erythropoietin raises frataxin levels in peripheral tissues by nontranscriptional means, but the effect appears too small to produce significant effects.12 Selective histone deacetylase inhibition has been successful in vitro and in mice, and has increased levels of frataxin mRNA in a phase I trial.13,14 Interferon-γ increases frataxin levels in mice and in FRDA patient-derived cells.15,16
Consequently, accurate assessments of frataxin are crucial in advancing therapeutic development in FRDA. As the mutations in FXN are found in all cells, frataxin deficiency occurs both in affected and unaffected tissues. Affected tissues such as cardiac and neuronal tissue are difficult to sample, making assessment of frataxin levels in peripheral tissues (e.g., blood, buccal cells) important in monitoring the disease and the response to therapies. Patients with FRDA have frataxin levels in peripheral tissues that range from 2% to 30% of control levels.7,9,17,18 These levels correlate with age of onset and inversely with the length of the GAA repeat. In carriers, who do not develop symptoms of FRDA, frataxin protein levels range from 30% to 80% of control levels.7,9,17,18 The lack of symptoms observed in carriers suggests that restoration of frataxin levels in patients to those observed in carriers may lead to substantial improvement in the course of the disease. Fulfilling such a goal requires a detailed understanding of the measurement of frataxin in subjects. In the present study we increased the sample size of our previous cohort,7 used repeated measures of subjects, extended correlations in multiple tissues, and looked in detail at results from compound heterozygotes for GAA expansions and selected point mutations to examine the utility of frataxin measurement in buccal cells and blood cells.
Methods
Patients
The protocol was approved by the Institutional Review Boards of all sites. Informed consent was obtained from each subject. Whole blood and buccal cell samples were obtained from patients with FRDA in a longitudinal clinical natural history study at the Children’s Hospital of Philadelphia, University of California–Los Angeles Medical Center, Emory University School of Medicine, University of Iowa, University of Florida, University of South Florida, The Ohio State University and Sick Kids Hospital (Toronto).19–21 Clinical information19–21 included the Friedreich Ataxia Rating Scale (FARS) exam, individual performance measures (timed 25-foot walk; nine-hole peg test, low-contrast letter acuity) and performance measure composites Z2 and Z3. The performance measure composites were derived as described from the nine-hole peg test and timed 25 foot walk (Z2), with low contrast letter acuity added in the Z3 score.19,20 GAA repeat lengths were available from clinical testing on blood samples, and the correlation of GAA length with age of onset is 0.6.19–21 Carrier samples were available from siblings and parents of FRDA subjects. Control samples included relatives not carrying GAA repeats, step-siblings, and healthy volunteers unrelated to FRDA subjects.
Frataxin assay
Buccal cell and whole blood samples were obtained at clinical visits from subjects and were prepared and assayed for frataxin immunoreactivity by lateral flow (“dipstick”) as described previously.7 We attempted to get blood and buccal cells at the same visit. The lateral flow assay has low coefficients of variation making it useful in large cohorts.7
Western blot
Buccal or fibroblast cells were collected in extraction buffer (Abcam, Cambridge, MA) and mixed with sodium dodecyl sulfate (SDS) sample buffer. Following extraction, a sample (28 μg) of total protein was boiled for 5 min and loaded onto 15% polyacrylamide gel. Following SDS polyacrylamide gel electrophoresis (PAGE), proteins were transferred to nitrocellulose, blocked with 3% dry milk, and incubated with mouse anti-frataxin antibody (Abcam, Cambridge, MA). Blots were then incubated with appropriate horseradish peroxidase (HRP)-conjugated secondary antibodies and developed with enhanced chemiluminescence (Pierce, Rockford, IL).
Transfection of HEK cells and immunocytochemical staining
The pcDNA3/FXN mutant constructs for FXNG130V, FXNR165C, FXNI154F, were generated using the Stratagene Quick-Change XLII Site-Directed Mutagenesis Kit (La Jolla, CA) with specific primers using human Frataxin1-210 as a template. The primers for these mutations were as follows: 5′ CAGTTTGACAGTTAAGACAACACTCCCAAAGGAGACATC 3′ (G130V); 5′ CAGTCCAGTCATAACACTTAGGTCCACTGGATGG 3′ (R165C); and 5′ GATGGAGAAGATAGCCAGAATTGCTTGTTTGGCGT 3′ (I154F). All mutations were verified by sequencing.
Coverslips were coated with 5 mg/mL poly-D-lysine and seeded with human embryonic kidney (HEK)-293 cells, maintained in Dulbecco’s Modified Eagle’s Medium supplemented with 10% fetal bovine serum and Penicillin/Streptomycin. Once cells reach 70% confluency, HEK-293 cells were cotransfected with 3 μg pcDNA3/FXNG130V, FXNR165C, FXNI154F, or FXNWildtype and 3 μg of mitoGFP in a six-well plate. Twenty-four hours after transfection cells were fixed with 4% Paraformaldehyde, permeablized with 0.3% Triton, and blocked with 10% bovine serum albumin. Mouse anti-Frataxin antibody (ab110328; Abcam, Cambridge, MA) was then added and incubated overnight, followed by Alexa Fluor® 568 (Life technologies, Eugene, OR) fluorescent second antibody the next day.
Fibroblasts
In order to address specific results arising in buccal and blood cells, fibroblasts were prepared from skin biopsies from patients with FRDA or controls. The biopsies from subjects with FRDA included a patient with long GAA repeats (repeat lengths of 901, 901), a patient with short GAA repeats (126, 520), and a patient with a G130V allele with a single expanded GAA of 762 repeats on the other allele.
Immunoprecipitation
To identify the molecular weight of frataxin in blood (as western blots are confounded by high levels of hemoglobin), samples of control and patient whole blood (400 μL) were mixed with 1600 μL extraction buffer (Abcam, Cambridge, MA) with a protease inhibitor cocktail (1:500 dilution; Calbiochem, Darmstadt, Germany) and incubated on ice for ≥10 min. Blood samples were then centrifuged at 16,000g for 10 min. The supernatant was transferred to a new tube and incubated with 60 μL of protein G beads (Invitrogen, Carlsbad, CA) at 4°C for 1 h to remove proteins that bind nonspecifically to the beads. The samples were then centrifuged at 500g for 5 min and the supernatant was incubated with mouse anti-frataxin antibody (1 μg/mL, Abcam, Cambridge, MA) overnight at 4°C. On the second day, 25 μL of protein G beads were added to the samples and incubated at 4°C for 2 h. The samples were then centrifuged at 500g for 5 min, and the beads were washed four times with extraction buffer. A total of 50 μL of sample buffer for SDS-PAGE was then added, and the mixture was boiled for 5 min. Beads were pelleted by centrifugation, and a fixed volume of supernatant was applied to a 15% polyacrylamide gel for SDS-PAGE.
Separation of components of whole blood
Briefly, whole blood was drawn into acid–citrate–dextrose Vacutainer tubes, transferred to polypropylene tubes, and centrifuged for 15 min at 129g with no brakes.22 The pellet was saved as the red blood cell (RBC) fraction (though it also included peripheral blood mononuclear cell (PBMC)) and the upper platelet-rich plasma layer was transferred to a new tube and spun again at 329g with no brakes for 15 min. The platelets were contained in the pellet.
Statistical analysis
Initial data analysis was performed using STATA software (v. 11.1; StataCorp LC) (College Station, TX) and SAS (Cary, NC). Mean patient frataxin levels were expressed as a percentage of average control levels derived from series of control samples from the same assay. The mean age at collection for each patient was used in this study. For linear regressions, models were created to predict frataxin levels using age, sex, and shorter GAA repeat length as independent variables. In preliminary analyses, collection site was also used as an independent variable. In addition, models were created to assess the ability of frataxin level to predict neurologic features using age and sex as independent variables along with buccal or blood frataxin protein level. Significance was determined based on P < 0.05.
Results
Patient clinical and demographic information
The 521 FRDA patients were first characterized demographically (Table1). There were no significant differences in mean age or sex between buccal and whole blood assay subjects (data not shown).
Table 1.
Demographic features
| Sample | N | Shorter GAA length | Age, years (range) | Sex (% female) |
|---|---|---|---|---|
| FRDA | 521 | 622 ± 240 (41–1150) | 28.4 ± 15.5 (3–78) | 49.5% |
| Carriers | 306 | – | 47.8 ± 12.8 (2–79) | 58.0% |
| Controls | 119 | – | 38.1 ± 14.9 (4–80) | 47.2% |
GAA, guanine–adenine–adenine; FRDA, Friedreich ataxia.
Assessing the variability in frataxin measurements
The short-term reproducibility of the frataxin assay previously was excellent for technical replicates, but had larger variability in repeated sampling in buccal and whole blood samples.7,14 In addition, previous regression analyses suggested that peripheral frataxin levels changed minimally over the course of a lifetime. To revisit these issues, the variability in frataxin measurements was assessed in repeated samplings over several years by examining the relationship between the difference in frataxin level between the first and second samplings and the interval in time between samplings. There was no relationship between the difference in frataxin levels and the interval between measurements in buccal cells (R2 = 0.013, P = 0.17) and whole blood (R2 = 0.0004, P = 0.81) (Fig.1A and B). There was also little-to-no correlation of the difference in frataxin levels between measurements with GAA repeat length (buccal: R2 = 0.0405, P = 0.016; blood: R2 = 0.0003, P = 0.858) or age (buccal: R2 = 0.047, P = 0.009; blood: R2 = 0.0048, P = 0.422) in either tissue. Although these models were statistically significant in buccal cells, the low R2 values demonstrated a minimal relationship identified only due to the large size of the cohort. In contrast, the difference between the first and second frataxin samplings was predicted by the first frataxin measurement from buccal cells (R2 = 0.47, P < 0.001) and whole blood samples (R2 = 0.23, P < 0.001) (Fig.1C and D). The second measurement significantly proceeded toward the mean frataxin level for the cohort, showing that regression to the mean is the dominant identifiable feature of sampling variability with no evidence for biological changes in frataxin levels over time.
Figure 1.

Repeated-measures analysis of frataxin in blood and buccal cells. The change in frataxin levels between samples (ordinate, expressed as a percentage of mean control value from unaffected individuals) was evaluated as a function of time between samples (abscissa; A and B) and initial sample value (abscissa, expressed as a percentage of mean control value from unaffected individuals; C and D) in buccal cells (A and C) and whole blood (B and D). There was essentially no relationship between the difference between the first and second measurements of frataxin levels and the time difference between those two samples. Although the relationship was statistically significant in buccal cells, the R2 value was very low and the slope of the association revealed a change in frataxin value of less than 1% per year. In contrast there was an inverse relationship between the initial frataxin value and the change in value, consistent with regression to the mean as the reason for the mean decrease in frataxin level with serial measurement in both blood and buccal swabs. N = 143 for buccal swabs, n = 137 for blood.
Relationship of frataxin data to disease features
As frataxin levels appear not to change over short periods of time, mean levels from each subject were used to reexamine the relationship between frataxin levels and disease features. In initial models, sex and collection site showed no association with frataxin levels, and were omitted from subsequent models (data not shown). Frataxin levels in buccal cells correlated with GAA repeat length on the shorter allele (R2 = 0.19, P < 0.001) and with the average age of collection from patients (R2 = 0.13, P < 0.001) (Fig.2A and B). In addition, age of onset correlated with blood and buccal frataxin level. Linear regression models demonstrated that both GAA repeat length on the shorter allele (regression coefficient = −0.024 ± 0.004, P < 0.001) and mean age at the time of collection (regression coefficient = 0.21 ± 0.06, P = 0.001) independently predicted frataxin levels (R2 = 0.22, P < 0.001). Frataxin levels in patient buccal cells decreased with increasing repeat number, but increased with age accounting for GAA repeat length. For whole blood samples, R2 values were higher, as frataxin levels correlated with GAA repeat length on the shorter allele (R2 = 0.44, P < 0.001) and with the average age of collection from patients (R2 = 0.24, P < 0.001) (Fig.2C and D). Multiple regression with both of these variables demonstrated that both age (regression coefficient = 0.38 ± 0.07, P < 0.001) and GAA repeat length (regression coefficient = −0.043 ± 0.004, P < 0.001) inde-pendently predicted frataxin levels in whole blood (R2 = 0.49, P < 0.001). In contrast, age correlated poorly with frataxin levels from buccal cells or blood in control individuals (n = 120) and in FRDA carriers (n = 306) (r < 0.12 for both tissues in both control and carrier groups).
Figure 2.

Relationship between frataxin levels and disease features. Buccal cell (A and B) and blood (C and D) frataxin levels (ordinate, expressed as a percentage of mean control value from unaffected individuals) were assessed in relationship to guanine–adenine–adenine (GAA) repeat length and age (abscissa). Frataxin levels in both tissues correlated inversely with GAA repeat length and directly with age. N = 350 for (A), 321 for (B), 405 for (C), and 350 for (D).
The GAA repeat in FRDA may display somatic variability that mediates the tissue selectivity of FRDA23; thus the ratio of buccal and whole blood frataxin measurements was also analyzed. While the mean ratio was 1.00, the buccal to blood ratio correlated with the repeat length of the shorter allele (R2 = 0.0703, P < 0.001) and the age at collection (R2 = 0.0173, P = 0.034) (Fig.3). But only GAA repeat length predicted the ratio in multivariate models (regression coefficient = 0.00082 ± 0.00027; P = 0.003; R2 = 0.073).
Figure 3.
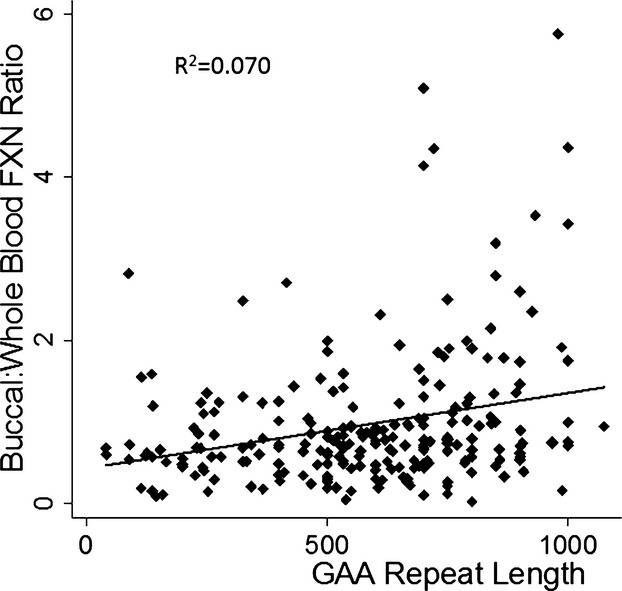
Relationship between ratio of buccal to whole blood frataxin levels and disease features. The ratio of buccal to blood frataxin level (ordinate) correlates with the short guanine–adenine–adenine (GAA) length (abscissa) (P < 0.001). Longer GAA repeats are associated with a high buccal/blood ratio. N = 230 for ratio.
Prediction of clinical status by frataxin levels
We next sought to ascertain whether buccal cell or whole blood levels more closely reflected neurological status. In linear regression models of quantitative neurological scores (FARS score, and the performance measure composites Z2 and Z3) accounting for age and sex, blood frataxin values predicted scores with higher R2 values than buccal cells, although both were highly significant (Table2). In addition, the regression coefficient, indicating the slope of the relationship between FARS score and frataxin levels, was larger for blood frataxin values compared with buccal values (blood regression coefficient = −0.549 ± 0.061; buccal regression coefficient = −0.318 ± 0.073). This shows that the change in FARS score associated with a given change in frataxin level is greater for blood.
Table 2.
Relation of frataxin levels and disease features in linear regression models
| Parameter | Blood | Buccal cells | ||||
|---|---|---|---|---|---|---|
| Z 2 1 | Z 3 2 | FARS | Z 2 1 | Z 3 2 | FARS | |
| Age | <0.0001 | <0.0001 | <0.0001 | <0.0001 | <0.0001 | <0.0001 |
| Sex | 0.83 | 0.78 | 0.62 | 0.90 | 0.87 | 0.96 |
| Frataxin level | <0.0001 | 0.0016 | <0.0001 | 0.029 | 0.77 | <0.0001 |
| Overall model R2 (P value) | 0.23 (<0.0001) | 0.093 (<0.0001) | 0.24 (<0.0001) | 0.11 (<0.0001) | 0.06 (0.0009) | 0.10 (<0.0001) |
P values are shown for the relationship of age, sex, and frataxin level with the outcome measures Z2, Z3 and FARS score in linear regression models. FARS, Friedreich Ataxia Rating Scale.
Z2 is defined as the sum of the z scores of the reciprocal of the nine-hole peg test and the reciprocal of the timed 25-foot walk.
Z3 is defined as the sum of the z scores of the reciprocal of the nine-hole peg test, the reciprocal of the timed 25-foot walk, and the low-contrast letter acuity vision test.
Frataxin levels in subjects with point mutations, deletions, and unidentified mutations
Frataxin levels were then analyzed in compound heterozygotes for GAA expansions in conjunction with point mutations and deletions, as well as in a few FRDA subjects with unknown mutations. We previously reported subjects with only a single disease-causing mutation and phenotypes exactly matching that of FRDA, who had disease-level frataxin levels in buccal swabs.7 One further such individual in the subjects was identified here.
For analysis of frataxin levels in subjects with point mutations, one can conceptually group the subjects with point mutations into those with G130V (a common missense mutation with a milder atypical phenotype)3,4,24; those carrying mutation of I154, R165, or W155 (which alter iron binding properties of frataxin)25,26; missense mutations in the core of the protein (e.g., L106S), which are predicted to lead to folding abnormalities and yield essentially no protein27; and nonsense, start codon, and splice site mutations, which also should lead to no protein. In compound heterozygotes for a GAA expansion and a point mutation or deletion, frataxin levels were plotted against the length of their single GAA repeat in both buccal cells and whole blood (Fig.4A and B) and the best-fit line from Figure1A or C (frataxin levels in buccal cells or blood for subjects homozygous for GAA repeat expansions) was overlaid on the point mutation data. In general, compound heterozygotes had frataxin levels in buccal cells that were lower than expected based on their single GAA repeat size when compared to subjects with 2 GAA repeat expansions. This is most readily interpreted as showing that point mutations make less immunoreactive frataxin protein than what is expected from the longer GAA repeat in 2 GAA repeat patients. This was true, albeit less so, for the most common point mutation, G130V. Levels of G130V frataxin in fibroblasts were also lower than those observed with longer GAA repeat lengths or shorter GAA repeat lengths, consistent with this mutation producing lower levels of frataxin (Fig.4C). There were variations in frataxin levels between specific groups of point mutations. Individuals heterozygous for mutations associated with dysfunctional frataxin had higher levels, particularly those with R165C mutations, suggesting a preservation of immunoreactive frataxin. Although there was a single patient of each mutation type in this group, the R165C (FRDA onset at age eight, blind by age 18)5 and W155R (onset at age four, death by age 18) subjects had frataxin levels far greater than that expected based on their age of onset and clinical severity.5
Figure 4.
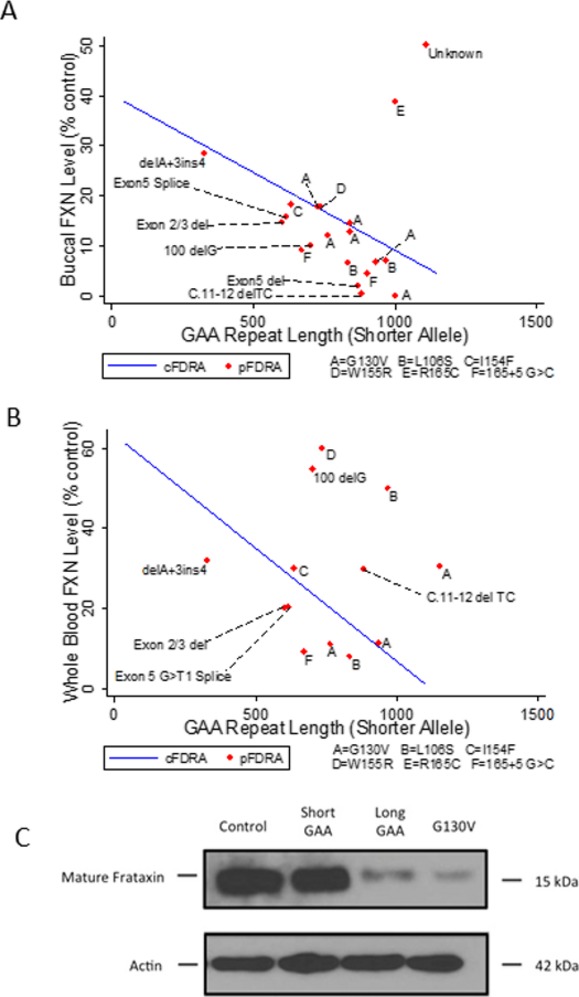
Frataxin levels in subjects with point mutations. Frataxin levels in buccal cells (ordinate, expressed as a percentage of mean control value from unaffected individuals) (A) and blood (B) were plotted in patients with point mutations against their expanded triplet repeat length (abscissa). Results from individual patients (pFRDA) are shown and labeled with the specific point mutation (A = G130V; B = L106S; C = I154F; D = W155R; E = R165C; F = 165 + 5 G>C, a splice site mutation). The line is the best fit line of frataxin level versus shorter GAA repeat length for patients carrying 2 GAA repeat expansions (cFRDA). These graphs thus present whether a point mutation generates more frataxin than the average shorter GAA repeat length in subjects with 2 GAA repeats. Almost all point mutation patients fall beneath the best fit line in buccal cells, showing that such point mutations make less frataxin than the shorter GAA repeat. The exceptions were subjects with G130V mutations, which approached the line, and mutations such as R165C, in which levels were greater than those displayed by the line. For simplicity, an individual carrying a short GAA repeat length (90) and a c.2delT mutation with highly discrepant levels between buccal cells (22% of control) and blood (157% of control) is not displayed, nor are two individuals with FARA carrying a single point mutation (L156P or c.2delT) and no identified GAA repeats (reference 7) (C). In fibroblasts, G130V patients had levels less than those of both a short GAA repeat patient and a long GAA repeat patient. FRDA, Friedreich ataxia; GAA, guanine–adenine–adenine.
Previous studies suggested that specific mutations (G130V, I154F) might be processed differently by mitochondrial processing peptidase, thus affecting their ability to enter mitochondria.24 To assess this potential mechanism for the lower levels of selected point mutations, mutant frataxin constructs carrying G130V, I154F, or R165C were co-transfected with mito-GFP (as a mitochondrial marker) into HEK cells, and the distribution of frataxin was compared to that in cells transfected with wild type (Fig.5). HEK cells transfected with wild-type frataxin or frataxin carrying the R165C point mutation had immunoreactive frataxin localized to mitochondria, while HEK cells transfected with frataxin carrying the G130V or I154F point mutation had no immunoreactive frataxin overlapping with mitoGFP (Fig.4C). This shows that the retained levels of R165C frataxin are intrinsic to the expression or stability of this mutant, and that the lower levels observed of G130V and I154F may reflect altered entry into the mitochondria as proposed.24
Figure 5.

Localization of point mutation frataxin in transfected cells. HEK cells were transfected with mitoGFP (green) in conjunction with wildtype (A), G130V (B), R165C (C), or I154F (D) frataxin (all detected with red). G130V and I154F frataxin failed to colocalize with mitoGFP, a marker of mitochondria, as shown by the separate red and green colors. In contrast, wild-type and R165C frataxin (A and C) colocalize with mitoGFP as shown by the yellow color. This shows that wild-type and R165C readily enter mitochondria while G130V and I154F are relatively excluded. Scale bars as shown.
In addition, there were substantial discrepancies in frataxin levels between blood and buccal cells in multiple subjects with point mutations and a single GAA repeat (not shown). These individuals had blood frataxin levels that were in the expected range for carriers or controls, while having buccal cell frataxin levels in the lower portion of the patient range. While the buccal to blood ratio varied among most subjects slightly, only five individuals had ratios of less than 0.10. Two of these individuals carried truncation mutations in the first 5 amino acids (c.2delT and c.11-12delTC). A third subject who carried a c.2delT mutation in conjunction with a pathologic but short (90) GAA repeat had disease levels in buccal cell (22%) with high control levels (157%) in blood. To understand this, we analyzed the distribution of frataxin in blood in more detail in one subject with the c.2delT mutation (subject PA 002 in reference 7). The proband had very low levels of frataxin in buccal cells (4.5% of control), consistent with his clinical phenotype of FRDA, but higher amounts of frataxin in whole blood (62.8% of control). To determine the source of the frataxin in blood, whole blood was fractionated from this subject and his father (who also carries the c.2delT mutation), and frataxin was measured from buccal cells, whole blood, platelets, and the RBC pellet (Fig.6A). The RBC pellet, which contains low levels of mitochondria but the highest absolute amounts of frataxin,14 was responsible for the relatively elevated frataxin level seen in whole blood in the proband and for an elevated amount of frataxin in blood in his c.2delT carrier father. This suggests that this start codon mutation in FXN leads to retained immunoreactive frataxin in RBC through an unknown mechanism. Fractionated blood from a subject with a frameshift mutation at amino acid 34 (c.100delG) and in subjects who are homozygous for GAA repeat expansions did not show this pattern (Fig.6B). Although there was variability in the amount of frataxin in different fractions in blood in the c.100delG subject, the variability was less than in the subject heterozygous for a c.2delT mutation.
Figure 6.
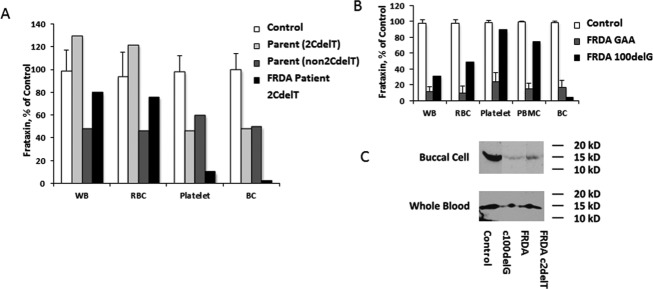
Relative levels of frataxin in blood of FRDA patients with selected point mutations. As three patients with protein truncating mutations in the first few amino acids had extremely low ratios of frataxin in buccal cells to blood, we addressed the localization in one such individual in greater detail (A). In this subject, frataxin levels were extremely low in buccal cells, while in the carrier range in blood. His father, who carried the start codon mutation c.2delT, had a similar pattern, being in the carrier range in buccal cells and in the control range in blood. When blood was fractionated, the high level in blood in the FRDA patient and the father reflected the RBC component. His mother, who did not carry this mutation, had carrier levels in all fractions. (B) This pattern of high levels in RBC was not found in subjects with 2 GAA repeats or in a subject with a frameshift mutation at amino acid 34 (c.100delG). (C) We assessed the molecular weight (MW) of frataxin in these subjects to insure that the atypical levels did to reflect processing issues. Frataxin had the same MW in buccal cells and blood in control individuals, c.100delG subject, and the subject with the start codon mutation (c.2delT). FRDA, Friedreich ataxia; RBC, red blood cell; GAA, guanine–adenine–adenine.
To explain these discrepancies, the size of frataxin in buccal cells and in blood was determined. In both sample types, frataxin was found at 15 kDa in controls and in the patient with the c.2delT mutation (Fig.6C). This shows that the frataxin in whole blood in subjects with the c.2delT mutation is a size consistent with mature frataxin.
Discussion
In the present analysis we expanded upon our previous studies using repeated measurements of frataxin to define the relationship of frataxin levels with disease features and genetic status.7 In peripheral tissues, frataxin levels are stable over the short term but may slowly increase over a lifetime based on statistical models. While both buccal cell and whole blood frataxin levels are predicted by age and GAA repeat length, the predictions are more robust using blood values, and blood values are more closely associated with neurological severity. In addition, frataxin measurements in compound heterozygotes for a single expanded GAA repeat and a point mutation depend on the exact mutation, with most mutations leading to decreased levels, others retaining frataxin immunoreactivity, and some leading to tissue-dependent discrepancies. All of these issues must be considered in therapeutic trials using measurement of frataxin in peripheral tissues.
Repeated measurements of frataxin showed that frataxin in peripheral tissues stays constant over short periods of time, but linear regression models from cross sectional data predict a small increase in frataxin with age. These results do not conflict as the predicted increase (∼0.2–0.4% of control per year based on the regression coefficients) is smaller than the variability of the assay. Biologically, the increase could reflect several phenomena. Over many years, individuals may select for cells with shorter GAA repeats and thus higher frataxin levels. In addition, it has been proposed that the GAA repeat length changes, increasing in affected tissue (such as heart and brain) and decreasing in unaffected tissue (such as blood), over time.23 Another possible explanation is an age-dependent change in the extraction of frataxin from cells. Still, changes in frataxin over the course of a lifetime should be sufficiently small that they would not obscure meaningful effects of therapeutic intervention.
In this study, while frataxin levels from both buccal cells and blood were associated with the biological variables of age, GAA length, and FARS scores, the associations were more robust with levels from blood. Blood sampling is more reproducible than sampling of buccal cells, perhaps leading to better statistical relationships. However, the slope of the relationship between GAA repeat length and frataxin level is also smaller in buccal cells than in blood, suggesting that there may be true differences in frataxin regulation between the tissues. There is consequently a difference in the ratio of frataxin in buccal cells to blood that changes with GAA repeat length. These data must be interpreted in the context of two of the paradoxes of frataxin levels in FRDA, namely that frataxin levels in unaffected tissues overlap between FRDA, carriers and controls, and that the levels in FRDA patients are higher than usually observed in recessive metabolic diseases. As the levels in buccal cells are slightly lower in FRDA patients (more consistent with a diseased phenotype or an affected tissue), buccal cell measurements might be more relevant for studies of therapeutic intervention. This is suggested by a recent study of interferon-γ in which changes in buccal cells appeared to be more readily identified than in blood.15 Nevertheless, the present results emphasize the need for interpretation of changes in frataxin levels in the context of the baseline relationships with disease-related variables.
Our data also address potential mechanisms involved in the pathogenesis of FRDA by point mutations. In general, most point mutations probably give rise to no functional frataxin, and in many patients are associated with a more severe phenotype. In the present cohort of compound heterozygous patients, this is generally true, particularly for truncating mutations, protein core mutations, and splice site mutations. In contrast, patients with R165C and W155R, non-core mutations with frataxin that functions abnormally, had retained frataxin levels relative to their disease severity.7,18 Thus for these mutations, the frataxin level does not match the severe phenotype.
In addition, levels in patients heterozygous for G130V or I154F mutations were discrepant with the milder phenotypes usually seen with these mutations. Levels associated with G130V were depressed compared to the best fit line for subjects homozygous for two GAA repeats and were also decreased in fibroblasts. In addition, in transfected HEK cells, G130V and I154F frataxin fail to colocalize with mitoGFP, showing that they enter the mitochondrion poorly (as suggested previously using model reporter constructs).24 This accounts for the low levels of the G130V mutant in patients, but the pathogenicity of I154F is more complicated. This mutation also may be less functional and may lie in the core of the protein, suggesting multiple mechanisms for causing disease.25,24,27 While the exact functionality of G130V is unclear, the present data implicate loss of protein for its pathogenicity. However, this does not explain the atypical phenotype of patients carrying this mutation. Such individuals usually have a mild phenotype characterized by atypical spasticity and a relative absence of arm, speech and cardiac dysfunction. This would not be readily explained by a uniform loss of frataxin, and implies the presence of unidentified cell-selective features of the pathophysiology of G130V. Another explanation for the paradoxically mild phenotype relies on the proposed progressive somatic expansion of the GAA repeats in FRDA.23 If GAA repeats expand as hypothesized in affected (e.g., brain) but not unaffected (blood, buccal cell) tissue, then over time the level of frataxin in affected tissues would fall in individuals with GAA repeat-mediated pathology, but not in individuals with G130V mutations. This would give rise to paradoxically elevated levels in blood of individuals homozygous for GAA repeat expansions compared with compound heterozygotes for G130V, as observed here.
There also appears to be a cell-selective preservation of immunoreactive frataxin in RBC in some subjects, particularly those heterozygous for nonsense mutations in the first few amino acids in the protein. This occurred in both carriers and patients with the start codon mutation and was also found in a subject with a frameshift mutation at amino acid four (which predicts synthesis of a protein of only three correct amino acids followed by an extended frame-shifted peptide). It occurred to a lesser extent in a patient with a frameshift mutation at amino acid 34 (c.100delG), leading to an abnormal frataxin containing only 75 amino acids (Fig.6). The reason for the higher levels of frataxin in RBC is unclear, particularly since the size of the frataxin in RBCs matches that in other cell types. This could reflect existence of a distinct RBC-selective splice variant, but evidence for such differential splicing is limited.28 Alternatively, as proposed by Zhu et al., such mutations may allow utilization of an alternate start codon that results in a truncated form of frataxin missing its N-terminal mitochondrial-targeting sequence.29 In RBCs, such a form might be more readily retained due to the relatively incomplete cell biological machinery of erythrocytes, including ubiquitin-based degradation systems.30 This alternative start codon is found at amino acid 76, essentially identical to the processing site of mature frataxin; thus, the molecular weight of mature mitochondrial frataxin and frataxin derived from this alternative start codon would be almost indistinguishable. As the frataxin made from an alternative start site would not be localized to mitochondria, it serves as a reminder of the difference between functional and immunoreactive frataxin, and the variability that can occur in cell selective processing events. However, such an explanation cannot be used to explain the relatively elevated levels of frataxin in the blood of subjects with deletions or other point mutations. Consequently, multiple mechanisms may contribute to the elevated levels in blood in some patients. Thus, the present work demonstrates the complexity of peripheral frataxin levels in FRDA, and the need for consideration of multiple factors in interpretation of the results of clinical intervention studies.
Acknowledgments
We acknowledge the support of Marek Napierela (University of Alabama) for aid in fibroblast culture, and the coordinators of the Friedreich Ataxia Clinical Outcome Measure Study for data entry. We also thank the subjects and families for donating their time and samples in participating. This work was supported by a grant from the Friedreich Ataxia Research Alliance.
Author Contributions
Mr. Lazaropoulos, Dr. Dong, Mr. Greeley, Dr. Deutsch, Mr. Christie, Ms. Clark were involved in Performance of basic experiments. Ms. Seyer, Ms. Brigatti, Mr. Christie, Mr. Greeley, Dr. Perlman, Dr. Lynch, Dr. Mathews, Dr. Zesiewicz, Dr. Subramony, Dr. Wilmot, Dr. Gomez, Dr. Yoon, and Dr. Hoyle contributed to collection of clinical data. Ms. Seyer, Ms. Brigatti, Ms. Clark, Dr. Deutsch, Dr. Perlman, Dr. Lynch, Dr. Mathews, Dr. Zesiewicz, Dr. Subramony, Dr. Wilmot, Dr. Gomez, Dr. Yoon, Dr. Wilson, and Dr. Hoyle were involved in conceptualization of experiments. Mr. Lazaropoulos, Dr. Lynch, Dr. Deutsch, Ms. Brigatti contributed to writing of first Draft. All authors performed critical revision and editing.
Conflict of Interest
Mr. Christie, Ms. Brigatti, Mr. Greeley, Dr. Dong, Ms. Clark, Dr. Deutsch, Ms. Seyer, Dr. Wilson, and Mr. Lazaropoulos have nothing to disclose. Dr. Lynch reports grants from Friedreich Ataxia Research Alliance for the present work, and grants from Edison Pharmaceutical, Viropharma, and Reata outside the submitted work. Dr. Subramony reports grants from Friedreich Ataxia Research Alliance FARA, during the conduct of the study; personal fees from Athena Diagnostics, outside the submitted work. Drs. Perlman, Yoon, Gomez, Zesiewicz, Hoyle, and Brocht report grants from the Friedreich’s Ataxia Research Alliance during the conduct of the study. Dr. Mathews reports grants from Friedreich’s Ataxia Research Alliance during the conduct of the study, and grants from Viropharma, Serepta, Prosensa, and Eli Lilly outside the submitted work. Dr. Wilmot reports grants from the Friedreich Ataxia Research Alliance during the study, and personal income from Santhera pharmaceuticals outside the study. Ms. Farmer is an employee of the Friedreich At axia Research Alliance.
References
- Lynch DR, Farmer JM, Balcer LJ, Wilson RB. Friedreich ataxia: effects of genetic understanding on clinical evaluation and therapy. Arch Neurol. 2002;59:743–747. doi: 10.1001/archneur.59.5.743. [DOI] [PubMed] [Google Scholar]
- Campuzano V, Montermini L, Molto MD, et al. Friedreich ataxia: autosomal recessive disease caused by an intronic GAA triplet repeat expansion. Science. 1996;271:1423–1427. doi: 10.1126/science.271.5254.1423. [DOI] [PubMed] [Google Scholar]
- Cossee M, Durr A, Schmitt M, et al. Friedreich’s ataxia: point mutations and clinical presentation of compound heterozygotes. Ann Neurol. 1999;45:200–206. doi: 10.1002/1531-8249(199902)45:2<200::aid-ana10>3.0.co;2-u. [DOI] [PubMed] [Google Scholar]
- Bidichandani SI, Ashizawa T, Patel PI. Atypical Friedreich ataxia caused by compound heterozygosity for a novel missense mutation and the GAA triplet-repeat expansion. Am J Hum Genet. 1997;60:1251–1256. [PMC free article] [PubMed] [Google Scholar]
- McCormack ML, Guttmann RP, Schumann M, et al. Frataxin point mutations in two patients with Friedreich’s ataxia and unusual clinical features. J Neurol Neurosurg Psychiatry. 2000;68:661–664. doi: 10.1136/jnnp.68.5.661. [DOI] [PMC free article] [PubMed] [Google Scholar]
- Anheim M, Mariani LL, Calvas PC, et al. Exonic deletions of FXN and early-onset Friedreich ataxia. Arch Neurol. 2012;69:912–916. doi: 10.1001/archneurol.2011.834. [DOI] [PubMed] [Google Scholar]
- Deutsch EC, Santani AB, Perlman SL, et al. A rapid, noninvasive immunoassay for frataxin: utility in assessment of Friedreich ataxia. Mol Genet Metab. 2010;101:238–245. doi: 10.1016/j.ymgme.2010.07.001. [DOI] [PMC free article] [PubMed] [Google Scholar]
- Zühlke CH, Dalski A, Habeck M, et al. Extension of the mutation spectrum in Friedreich’s ataxia: detection of an exon deletion and novel missense mutations. Eur J Hum Genet. 2004;12:979–982. doi: 10.1038/sj.ejhg.5201257. [DOI] [PubMed] [Google Scholar]
- Saccà F, Marsili A, Puorro G, et al. Clinical use of frataxin measurement in a patient with a novel deletion in the FXN gene. J Neurol. 2013;260:1116–1121. doi: 10.1007/s00415-012-6770-5. [DOI] [PubMed] [Google Scholar]
- Pandolfo M. Molecular pathogenesis of Friedreich ataxia. Arch Neurol. 1999;56:1201–1208. doi: 10.1001/archneur.56.10.1201. [DOI] [PubMed] [Google Scholar]
- González-Cabo P, Palau F. Mitochondrial pathophysiology in Friedreich’s ataxia. J Neurochem. 2013;126(suppl 1):53–64. doi: 10.1111/jnc.12303. [DOI] [PubMed] [Google Scholar]
- Mariotti C, Nachbauer W, Panzeri M, et al. Erythropoietin in Friedreich ataxia. J Neurochem. 2013;126(suppl 1):80–87. doi: 10.1111/jnc.12301. [DOI] [PubMed] [Google Scholar]
- Soragni E, Miao W, Iudicello M, et al. Epigenetic therapy for Friedreich ataxia. Ann Neurol. 2014;76:489–508. doi: 10.1002/ana.24260. [DOI] [PMC free article] [PubMed] [Google Scholar]
- Plasterer HL, Deutsch EC, Belmonte M, et al. Development of frataxin gene expression measures for the evaluation of experimental treatments in Friedreich’s ataxia. PLoS One. 2013;8:e63958. doi: 10.1371/journal.pone.0063958. [DOI] [PMC free article] [PubMed] [Google Scholar]
- Seyer L, Greeley N, Foerster D, et al. Open-label pilot study of interferon gamma-1b in Friedreich ataxia. Acta Neurol Scand. 2015;132(1):7–15. doi: 10.1111/ane.12337. [DOI] [PubMed] [Google Scholar]
- Tomassini B, Arcuri G, Fortuni S, et al. Interferon gamma upregulates frataxin and corrects the functional deficits in a Friedreich ataxia model. Hum Mol Genet. 2012;21:2855–2861. doi: 10.1093/hmg/dds110. [DOI] [PMC free article] [PubMed] [Google Scholar]
- Nachbauer W, Wanschitz J, Steinkellner H, et al. Correlation of frataxin content in blood and skeletal muscle endorses frataxin as a biomarker in Friedreich ataxia. Mov Disord. 2011;26:1935–1938. doi: 10.1002/mds.23789. [DOI] [PubMed] [Google Scholar]
- Saccà F, Puorro G, Antenora A, et al. A combined nucleic acid and protein analysis in Friedreich ataxia: implications for diagnosis, pathogenesis and clinical trial design. PLoS One. 2011;6:e17627. doi: 10.1371/journal.pone.0017627. [DOI] [PMC free article] [PubMed] [Google Scholar]
- Friedman LS, Farmer JM, Perlman S, et al. Measuring the rate of progression in Friedreich ataxia: implications for clinical trial design. Mov Disord. 2010;25:426–432. doi: 10.1002/mds.22912. [DOI] [PMC free article] [PubMed] [Google Scholar]
- Lynch DR, Farmer JM, Tsou AY, et al. Measuring Friedreich ataxia: complementary features of examination and performance measures. Neurology. 2006;66:1711–1716. doi: 10.1212/01.wnl.0000218155.46739.90. [DOI] [PubMed] [Google Scholar]
- Regner SR, Wilcox NS, Friedman LS, et al. Friedreich ataxia clinical outcome measures: natural history evaluation in 410 participants. J Child Neurol. 2012;27:1152–1158. doi: 10.1177/0883073812448462. [DOI] [PMC free article] [PubMed] [Google Scholar]
- Basu SS, Deutsch EC, Schmaier AA, et al. Human platelets as a platform to monitor metabolic biomarkers using stable isotopes and LC-MS. Bioanalysis. 2013;5:3009–3021. doi: 10.4155/bio.13.269. [DOI] [PMC free article] [PubMed] [Google Scholar]
- De Biase I, Rasmussen A, Endres D, et al. Progressive GAA expansions in dorsal root ganglia of Friedreich’s ataxia patients. Ann Neurol. 2007;61:55–60. doi: 10.1002/ana.21052. [DOI] [PubMed] [Google Scholar]
- Koutnikova H, Campuzano V, Koenig M. Maturation of wild-type and mutated frataxin by the mitochondrial processing peptidase. Hum Mol Genet. 1998;7:1485–1489. doi: 10.1093/hmg/7.9.1485. [DOI] [PubMed] [Google Scholar]
- Tsai CL, Bridwell-Rabb J, Barondeau DP. Friedreich’s ataxia variants I154F and W155R diminish frataxin-based activation of the iron-sulfur cluster assembly complex. Biochemistry. 2011;50:6478–6487. doi: 10.1021/bi200666h. [DOI] [PMC free article] [PubMed] [Google Scholar]
- Bridwell-Rabb J, Winn AM, Barondeau DP. Structure-function analysis of Friedreich’s ataxia mutants reveals determinants of frataxin binding and activation of the Fe-S assembly complex. Biochemistry. 2011;50:7265–7274. doi: 10.1021/bi200895k. [DOI] [PMC free article] [PubMed] [Google Scholar]
- Dhe-Paganon S, Shigeta R, Chi YI, et al. Crystal structure of human frataxin. J Biol Chem. 2000;275:30753–30756. doi: 10.1074/jbc.C000407200. [DOI] [PubMed] [Google Scholar]
- Abruzzo PM, Marini M, Bolotta A, et al. Frataxin mRNA isoforms in FRDA patients and normal subjects: effect of tocotrienol supplementation. Biomed Res Int. 2013;2013:276808. doi: 10.1155/2013/276808. [DOI] [PMC free article] [PubMed] [Google Scholar]
- Zhu D, Burke C, Leslie A, Nicholson GA. Friedreich’s ataxia with chorea and myoclonus caused by a compound heterozygosity for a novel deletion and the trinucleotide GAA expansion. Mov Disord. 2002;17:585–589. doi: 10.1002/mds.10175. [DOI] [PubMed] [Google Scholar]
- Rufini A, Fortuni S, Arcuri G, et al. Preventing the ubiquitin-proteasome-dependent degradation of frataxin, the protein defective in Friedreich’s ataxia. Hum Mol Genet. 2011;20:1253–1261. doi: 10.1093/hmg/ddq566. [DOI] [PubMed] [Google Scholar]