

Abstract
Objective
Cathodal transcranial direct current stimulation (tDCS) is a focal neuromodulation technique that suppresses cortical excitability by low-amplitude constant electrical current, and may have an antiepileptic effect. Yet, tDCS has not been tested in status epilepticus (SE). Furthermore, a combined tDCS and pharmacotherapy antiseizure approach is unexplored. We therefore examined in the rat pentylenetetrazol (PTZ) SE model whether cathodal tDCS (1) suppresses seizures, (2) augments lorazepam (LZP) efficacy, and (3) enhances GABAergic cortical inhibition.
Methods
Experiment 1 aimed to identify an effective cathodal tDCS intensity. Rats received intraperitoneal PTZ followed by tDCS (sham, cathodal 1 mA, or cathodal 0.1 mA; for 20 min), and then a second PTZ challenge. In Experiment 2, two additional animal groups received a subtherapeutic LZP dose after PTZ, and then verum or sham tDCS. Clinical and electroencephalography (EEG) epileptic activity were compared between all groups. In Experiment 3, we measured GABA-mediated paired-pulse inhibition of the motor evoked potential by paired-pulse transcranial magnetic stimulation (ppTMS) in rats that received PTZ or saline, and either verum or sham tDCS.
Results
Cathodal 1 mA tDCS (1) reduced EEG spike bursts, and suppressed clinical seizures after the second PTZ challenge, (2) in combination with LZP was more effective in seizure suppression and improved the clinical seizure outcomes compared to either tDCS or LZP alone, and (3) prevented the loss of ppTMS motor cortex inhibition that accompanied PTZ injection.
Interpretation
These results suggest that cathodal 1 mA tDCS alone and in combination with LZP can suppress seizures by augmenting GABAergic cortical inhibition.
Introduction
Epilepsy affects 60 million people worldwide and about a third of the patients have drug resistant seizures.1,2 The annual incidence of prolonged seizures, or status epilepticus (SE), is up to 60 per 100,000; its mean mortality rate is 20%, and many of the surviving patients are left with significant morbidity.3–6 Lorazepam (LZP) is the first-line treatment for prolonged seizures and SE, but it is incompletely effective, and its use is limited by respiratory depression.7,8 Rapid termination of SE and of frequent repetitive seizures, is essential, since the risk of neurologic injury with prolonged seizures is in large part dependent on their duration.9,10 However, since ∼30–40% of patients do not respond to initial pharmacologic SE treatments,6,7 there remains an unmet need for efficacious treatments that can augment LZP efficacy, preferably without the risk of respiratory compromise.
Transcranial direct current stimulation (tDCS) modulates neuronal activity via weak electrical currents that are conducted to the cerebral cortex via scalp electrodes, and has been studied in several animal models of neurological disease.11 While the tDCS mechanisms of action are incompletely understood, the effects of weak constant electrical current on cortical activity are predictable: under the anode tDCS enhances cortical excitability, while under the cathode tDCS reduces cortical excitability and, as shown in limited reports, may prophylax against seizures.12–16 However, while tDCS has been explored as a treatment for established epilepsy,12,16 it has not been tested as a means to abort ongoing seizures. We therefore conducted the following experiments to test the capacity of cathodal tDCS to suppress acute seizures in a rat pentylenetetrazol (PTZ) SE model. We also test whether cathodal tDCS can augment the antiepileptic efficacy of LZP. Last, to obtain insights into the antiepileptic mechanism of action of cathodal tDCS, we use paired-pulse transcranial magnetic stimulation (ppTMS) to test whether gamma-aminobutyric acid (GABA)-ergic cortical inhibition, the target mechanism of many first-line antiepileptic drugs, is enhanced by cathodal tDCS.
Materials and Methods
Animals
About 114 adult male Long Evans rats (weight: 318.8 ± 39.2 g; mean ± SD) were used in the study. All animals were housed in a temperature-controlled animal care facility with a 12 h light–dark cycle. All procedures were approved by the Animal Care and Use Committee at Boston Children’s Hospital (Boston, MA) and were conducted in accordance with the National Institutes of Health Guide for the Care and Use of Laboratory Animals. Efforts were made to minimize animal suffering and the number of animals used.
tDCS
We used a constant current DC-stimulator (Model no: ALX-1.0/0/.1; Soterix Medical, New York, NY) capable of outputting either 0.1 or 1 mA current. The tDCS montage consisted of an active electrode in form of a electroencephalography (EEG) disc electrode (10 mm gold, Grass Technologies, West Warwick, RI) placed on the dorsal scalp and a reference electrode in the form of saline-soaked (3% NaCl) sponge (3 × 3 cm) pressed underneath the ventral torso. Prior to placement of the active tDCS electrode, after shaving, the rat’s scalp was gently rubbed using NuPrep™ Skin Prep Gel (Cardinal Health, Dublin, OH) to lower skin impedance. The active electrode was filled with conductive EEG paste (Ten20; D.O. Weaver and Co., Aurora, CO) to ensure maximal electrical conductance between the scalp and the electrode, and was secured to the dorsal scalp at midline using adhesive collodion. During cathodal tDCS, the active electrode on the scalp served as the cathode and the sponge as anode. No current was delivered during sham tDCS. The rats experienced only minimal discomfort during electrode placement. Animals were mechanically restrained on a platform with two broad Velcro straps positioned over the torso behind the forelimbs and in front of the hindlimbs (Fig.1A), as per laboratory protocol.17,18 Once the straps were secured, the animal was confined to the platform but retained full range of motion of the head, limbs, and tail. An advantage of this mechanical restraint is that it enables a continuous view of the animal’s head and extremities allowing for clinical seizures to be observed, and that it allows easy access to the rat’s head for EEG and tDCS electrodes.
Figure 1.

Experimental setup and design. (A) Rat tDCS-EEG setup. In Experiments 1 and 2, with the rat restrained on a platform, disk (active), and sponge (reference) electrodes were secured to the rat’s scalp and torso, respectively. Constant cathodal DC (1 or 0.1 mA) or sham (0 mA) current was delivered via wires connecting a DC stimulator to the electrodes. One-channel EEG was recorded using SWE. The recording SWE was positioned on the scalp over the parietal region and the reference over the dorsal snout at midline. (B) Rat ppTMS-EMG-tDCS setup. In Experiment 3, a figure-of-eight TMS coil was fixed to a micromanipulator arm and positioned over the left hemisphere. Motor evoked potentials were recorded using monopolar stainless steel needle electrodes placed into the brachioradialis of the contralateral right forelimb and between the digits of the footpad. A ground electrode was inserted in the tail. Also tDCS electrodes were secured to the scalp and torso as described previously. (C) Experimental design. In Experiments 1 and 2, the rats were closely observed after baseline EEG acquisition and the injection of PTZ alone (Experiment 1) or together with LZP (Experiment 2), for occurrence of first myoclonic jerk. One minute after the myoclonus, 20 min tDCS treatment was started: sham, cathodal 1 mA or cathodal 0.1 mA in Experiment 1, and sham or cathodal 1 mA in Experiment 2. The rats were then monitored clinically and by EEG for 10 min before and 15 after administration of a second dose of PTZ (20 mg/kg, i.p.). The entire session lasted for about 60 min and was video-monitored. In Experiment 3, sham or cathodal 1 mA tDCS was administered for 20 min immediately after injection of saline or PTZ. MEP ppTMS inhibition was continuously recorded at baseline, during sham or cathodal tDCS and 25 min after the tDCS treatment. tDCS, transcranial direct current stimulation; EEG, electroencephalography; SWE, subdermal wire electrodes; ppTMS, paired-pulse transcranial magnetic stimulation; PTZ, pentylenetetrazol; LZP, lorazepam; MEP, motor evoked potential.
Video-EEG
EEG signals were acquired with two thin silver/silver-chloride Teflon-coated EEG subdermal wire electrodes (Ives EEG Solutions, Newburyport, MA),18 with a reference contact positioned over the dorsal snout at midline, and an active contact placed unilaterally over the parietal region. Rats tolerated the electrodes without signs of local pain or discomfort after initial subcutaneous placement. The one-channel EEG was recorded using a Cadwell EEG system (Cadwell Laboratories Inc., Kennweick, WA) at a sampling rate of 400 Hz. The signals were bandpass filtered 1–70 Hz and included a 60 Hz Notch filter. EEG traces were reviewed by Easy EEG v.2.1 (Cadwell Laboratories Inc, Wennewick, WA) and EDFbrowser v.1.22 (Teunis van Beelen, Netherland) analysis applications. High definition videos were acquired in all cases, and were time-registered with the EEG.
Seizure induction
Seizures were provoked by intraperitoneal (i.p.) PTZ (Sigma-Aldrich, Co., St. Louis, MO), a GABAA receptor antagonist. The PTZ-induced rat seizure model has been commonly used to test the effects of anticonvulsant drugs and stimulation techniques.19,20 In Experiment 1 and Experiment 2, PTZ was administered in two consecutive doses, 75 and 20 mg/kg (i.p.). This dose schedule was determined prior to the start of the experiment to reliably produce more clusters of generalized tonic-clonic seizures (GTCS), as is common in human SE. To avoid the confounds of convulsion on the motor evoked potential (MEP) readout in Experiment 3, we administered a 50 mg/kg (i.p.) PTZ dose while rats were under pentobarbital anesthesia.
ppTMS
Focal TMS was delivered using a Magstim Rapid magnetic stimulator (Whitland, Carmarthenshire, Wales, U.K.) and a figure-of-eight coil (outside diameter = 66 mm, inside diameter = 15 mm; double small coil; Magstim). MEPs were recorded with monopolar uninsulated needle electrodes inserted into each brachioradialis muscle of the rat forelimb (Fig.1B). The coil was held in the stereotaxic frame and its optimal position was defined as that with the lowest stimulation intensity required to elicit lateralized MEPs exclusively in the forelimb contralateral to the TMS coil location. These methods were adapted from the TMS methods previously described in our laboratory.21–23 After determining motor threshold (MT), pairs of stimuli at 100 msec interstimulus interval were delivered with a 7-sec interpair interval at 120% MT intensity. The magnitude of paired-pulse evoked Electromyography (EMG) inhibition was calculated as the ratio of the second (conditioning) evoked MEP to the first (test) evoked MEP.17,23
Data analysis
Rats were continuously monitored for clinical and electrographic epileptic activity following PTZ administration. Video and EEG recordings were also reviewed post hoc by investigators blinded to the treatment condition.
tDCS clinical outcomes
Most PTZ-injected rats progressed through expected clinical stages from myoclonic jerking to behavioral arrest to GTCS.24,25 Following first PTZ injection, each rat was closely observed for 15 min by one of two investigators (S. C. D. or D. E.) to determine the time of the first myoclonic jerk. The latency to each GTCS and the GTCS duration was determined clinically by observation and verified by blinded review of the video EEG. GTCS incidence after PTZ injection was used as a measure to determine the treatment effect. However, for statistical purposes, we assigned latency to 15 min and GTCS duration to 0 sec in animals that did not have a GTCS during the 15 min of monitoring. Rat mortality was confirmed by clinical exam when neither respiration nor heartbeat was palpable.
EEG outcomes
A 10-min EEG recording acquired in all surviving rats immediately between the cessation of tDCS and the point of second PTZ injection was used for evaluation of the effect of tDCS on interictal EEG activity. Burst (≥1 sec of continuous spikes) count was used as the outcome measure to quantify epileptic activity during this 10 min-long EEG window. A pattern of repetitive epileptic spikes, minimally for 1 sec, was categorized as a burst. EEG traces were visually compared to the baseline EEG obtained for each rat prior to the first PTZ injection. Concomitant video recordings were consulted to distinguish movement artifacts from epileptic activity. The epileptic spike bursts were counted by optimizing the automated seizure detection algorithm in Neuroscore (Data Sciences International, St. Paul, MN). The detected events were verified by visual inspection.
PSD analysis
Power spectral density (PSD) of the 10 min long posttreatment EEG period was calculated by transforming the time domain signal to the frequency domain using the Fast Fourier Transform technique. The grand averaged PSD estimates were then used to calculate power ratios, that is, relative power expressed as a ratio of the absolute power of a specific band to the total absolute power, to compensate for intersubject variability and artifacts. The power bands were defined per clinical definitions as delta (1–4 Hz), theta (4–8 Hz), alpha (8–13 Hz), beta (13–30 Hz) and total (1–30 Hz). Based on the absolute powers in these bands, power ratios were derived for the following estimates: delta/total, theta/total, alpha/total and beta/total.
ppTMS outcomes
For each evoked MEP, the largest peak-to-peak voltage (Vpp) was recorded and averaged for each rat. Paired-pulse inhibition was expressed as ratio of the test evoked MEP Vpp to conditioning evoked MEP Vpp, per rat. To evaluate the changes in cortical inhibition over time after sham or cathodal tDCS, ppTMS inhibition was averaged across rats within each treatment group for three timepoints: prestimulation (10 min), during stimulation (20 min), and poststimulation (15 min).
Statistical analysis
Data were analyzed using GraphPad Prism (v 5.01; GraphPad Software Inc., La Jolla, CA) with significance level defined at P < 0.05. Based on the normality of data (determined by Shapiro–Wilk test) either parametric or nonparametric tests were used. All results were presented as median and interquartile range (IQR) or mean (±SEM) as appropriate. Kruskal–Wallis test was employed to compare outcomes (duration and epileptic burst counts) among all three tDCS treatment conditions followed by Dunn’s post hoc tests to compare between groups when the main group effect was significant. The EEG power ratios were compared using one-way analysis of variance (ANOVA) followed by post hoc Bonferroni correction. A log-rank (Mantel–Cox) test was performed to compare the Kaplan–Meier analysis for GTCS incidence rate and latency. To determine the effect of tDCS on paired-pulse inhibition, repeated-measures ANOVA was used to compare the inhibition levels at different timepoints followed by a Bonferroni post hoc correction.
Experimental design
Experiment 1: Seizure suppression by tDCS
This experiment was designed to test the preferential antiepileptic effect of two tDCS regimens in comparison to sham stimulation. Rats (n = 65) were randomly assigned to one of three groups that differed by tDCS treatment condition: cathodal 1 mA (cath 1 mA; n = 22), cathodal 0.1 mA (cath 0.1 mA; n = 20), or sham stimulation (sham; n = 23) (refer to seizure induction and Fig.1C for protocol details). Following tDCS and EEG electrode placement, a baseline EEG of 5–10 min was recorded after which rats were injected with PTZ (75 mg/kg, i.p.). All rats were continuously monitored by one of the investigators (S. C. D. or D. E.) for any signs of observable clinical myoclonus, as an indication of the onset of epileptic activity. To approximate a realistic clinical scenario where some delay between seizure onset and administration of antiepileptic treatment is likely, we delayed tDCS until 1 min following the first myoclonic jerk, when active or sham tDCS was applied for 20 min (Fig.1C). Owing to stimulation artifact, EEG was turned off during tDCS application. The rats were closely observed during this period for occurrence of clinical seizures and video-recorded for post hoc visualization of the correct timing of onset and duration of seizures. EEG was then recorded for 10 min in the post-tDCS period. Subsequently a second PTZ dose (20 mg/kg, i.p.) was administered as the clinical observation and video-EEG recording continued for additional 15 min. The entire session lasted for about 60 min. Immediately after the session, the rats were euthanized with CO2.
Experiment 2: Seizure suppression by tDCS combined with LZP
This experiment was designed to test the antiepileptic effect of tDCS when administered in conjunction with LZP. A series of dose–response pilot experiments identified 0.25 mg/kg as subtherapeutic LZP dose that did not suppress myoclonic jerking and prevented GTCS in less than 50% of animals. One group of rats (LZP + sham; n = 10) received LZP (0.25 mg/kg, i.p.) immediately after the first PTZ injection followed by sham tDCS. Another group of animals (LZP + tDCS; n = 11) received LZP (immediately after PTZ) and followed by the most potent cathodal tDCS treatment (identified in Experiment 1), which started 1 min after the first myoclonus (Fig.1C). The rest of the experiment was identical to Experiment 1. To minimize animal use, we used data from the sham tDCS condition in experiment 1 for statistical comparisons.
Experiment 3: A measure of cortical inhibition using ppTMS
For insight into the mechanism of action of tDCS, we measured intracortical inhibition using ppTMS in a separate group of rats (n = 28) that were anesthetized with sodium pentobarbital (65 mg/kg, i.p.). Once anesthetized, rats were placed into a stereotaxic frame. TMS was applied to the left motor cortex and MEP paired-pulse inhibition was recorded from the right brachioradialis muscle in each rat.17,23 Rats were then equally divided into four groups to receive: (1) saline with sham tDCS (sal + sham), (2) PTZ (50 mg/kg, i.p.) with sham tDCS (PTZ + sham), (3) saline with most potent cathodal tDCS intensity, as identified in Experiment 1 (sal + tDCS), or (4) PTZ (50 mg/kg, i.p.) with the same cathodal tDCS intensity (PTZ + tDCS). Baseline MEPs were recorded using ppTMS for 10 min, following which PTZ or saline was administered to the rats. Sham or cathodal tDCS was delivered for 20 min and MEP inhibition was measured at the 25-min timepoint after stimulation (Fig.1C). Paired-pulse inhibition (ratio of test to conditioning MEP) was averaged per block. Note that ppTMS was performed with tDCS electrodes in place under the coil in both active and sham conditions.
Results
In Experiment 1, we compared the antiepileptic potential of two cathodal tDCS intensities. In Experiment 2, we used LZP with the most effective intensity of tDCS as judged from Experiment 1 to compare efficacies of tDCS and LZP alone and in combination. In Experiment 3, we applied ppTMS setup to test whether cathodal tDCS augments motor cortex paired-pulse, GABAergic, inhibition.
Experiment 1
Cathodal tDCS does not acutely suppress clinical PTZ seizures
The baseline characteristics of all rats with respect to their response to the initial injection of 75 mg/kg PTZ were similar. Predictably, the latency to the occurrence of the first clinical myoclonic jerk, prior to the initiation of tDCS did not differ between groups.
The latency to the beginning of a GTCS after the first myoclonus was also not significantly different between the three groups of rats. The median latencies until the first GTCS in all treatment conditions were: sham: 329 sec (IQR, 138.5–497.3 sec); 1 mA: 440 sec (IQR, 196–1251 sec); and 0.1 mA: 185.5 sec (IQR, 95.5–429 sec), as represented by the Kaplan–Meier analysis in Figure2A. This suggests that initiation of cathodal tDCS did not have an immediate effect on the propensity for seizures induced by PTZ (Mantel–Cox test, χ2 = 2.62; P = 0.27). The total duration of the first GTCS (Fig.2B) was also not significantly reduced by either cathodal tDCS treatment as confirmed by Kruskal–Wallis test (P = 0.26). In the sham stimulated group 39% of the rats had additional GTCS during the 30 min of observation after the first myoclonus, whereas in the tDCS treatment groups 32% and 20% of those that received cath 1 mA and cath 0.1 mA tDCS, respectively, experienced a second GTCS. These figures were not significantly different from each other (chi-square, P = 0.4). The mortality after the first PTZ injection was of 22% in the sham stimulated group of rats and 9% and 5% in the rats that were stimulated with cathodal 1 mA and cathodal 0.1 mA tDCS, respectively (chi-square, P = 0.21).
Figure 2.

Clinical and EEG outcomes of cathodal tDCS treatment. (A) GTCS incidence and latency after first PTZ injection. Kaplan–Meier survival curve is used to display percentage incidence of GTCS (y-axis) and its latency (x-axis), after first PTZ injection in all treatment conditions. The height of each step represents the percentage of rats experiencing a GTCS and the length of the curve represents the GTCS latency from the first myoclonus. The median latencies in the cath 1 mA and cath 0.1 mA groups, respectively, were not significantly longer than that of sham rats. Note the clustering of GTCS latencies <300 sec in most animals. (B) GTCS duration after first PTZ injection. The first PTZ injection induced one or multiple GTCS in most rats. There was no significant reduction in the median durations of seizures in cath 1 mA or cath 0.1 mA treatment groups relative to sham. (C) Representative EEG traces. Sample baseline EEG without epileptiform activity (1); Sample EEG after PTZ injection shows a characteristic automatically detected spike-train outlasting 1 sec (2). (D) Spike burst count after first PTZ injection. Graph depicts the number of EEG burst discharges per 10 min of recording after treatment with tDCS, as digitally counted using the seizure detection algorithm of Neuroscore (Data Sciences International, St. Paul, MN) and verified by visual inspection. The number of detected bursts was significantly lower in the rats that were stimulated by cathodal 1 mA treatment relative to sham controls or cathodal 0.1 mA. *P < 0.05. (E) GTCS incidence and latency after second PTZ injection. Kaplan–Meier survival curve is used to display percentage incidence of GTCS (y-axis) and its latency (x-axis), after second PTZ injection in all treatment conditions. Curve comparison shows that the GTCS incidence rate of 94% in sham group was significantly higher than the cath 1 mA (60%) and cath 0.1 mA (74%)-treated animals. Also the sham rats were the quickest to seize after second PTZ challenge as compared to the treatment groups. Note the clear separation in the Kaplan-Meier curve of cath 1 mA treatment group. (F) GTCS duration after second PTZ injection. The seizures caused by second PTZ injection were significantly of shorter duration in the cath 1 mA treatment group as compared to the sham-treated animals. Boxes indicate median and first and third quartile. Tukey’s error bars are indicated by top and bottom whiskers. An outlier value is indicated, beyond the Tukey’s error range by the solid circle. *P < 0.05. EEG, electroencephalography; tDCS, transcranial direct current stimulation; GTCS, generalized tonic-clonic seizures; PTZ, pentylenetetrazol.
Cathodal 1 mA tDCS suppresses bursts of epileptic spikes on EEG
For each rat, a 10-min period of EEG recording post-PTZ and tDCS was digitally scored for epileptic bursts. Electrographic seizure activity was observed in all rats. Figure2C plots representative traces of (1) baseline EEG without epileptiform discharges, and (2) EEG after PTZ injection showing characteristic automatically detected epileptic bursts outlasting 1 sec. With regard to the EEG epileptic activity, Kruskal–Wallis test revealed a significant group effect of burst counts (P = 0.03). By post hoc comparisons using Dunn’s test, as demonstrated in Figure2D, there was a statistical difference in count of spike bursts with a median of 6 (IQR, 1–14) for the cathodal 1 mA treatment group (P < 0.05) as compared to 14 (IQR, 8.75–26) in sham. The 12 median (IQR, 7.5–21.25) bursts after cathodal treatment with 0.1 mA stimulation intensity were not significantly lower than sham or higher than cathodal 1 mA treatment.
Cathodal 1 mA tDCS reduces power in the EEG theta-alpha-beta frequency bands
After treatment with tDCS, the PSD of the 10 min-long EEG period was analyzed in the low frequency bands. One-way ANOVA results show that cathodal tDCS treatment significantly changed the power in delta (P = 0.003), theta (P = 0.037), alpha (P = 0.011) and beta (P = 0.016) bands. Post hoc Bonferroni tests confirm that cath 1 mA tDCS increased the EEG power in the low delta band (P < 0.01) whereas it significantly reduced the power ratios in theta (P < 0.05), alpha (P < 0.01) and beta (P < 0.01) bands as compared to sham or cath 0.1 mA-treated groups (Table1). These findings corroborate with the reduction in spike bursts observed after cathodal 1 mA stimulation and thus reconfirm the effectiveness of cath 1 mA tDCS in suppressing epileptic EEG activity.
Table 1.
Relative power per EEG frequency band
| Treatment group | |||
|---|---|---|---|
| Frequencybands | Sham (n = 18) | Cath 0.1 mA (n = 21) | Cath 1 mA (n = 18) |
| Delta (1–4 Hz) | 0.457 ± 0.317 | 0.572 ± 0.040 | 0.624 ± 0.030** |
| Theta (4–8 Hz) | 0.361 ± 0.023 | 0.293 ± 0.029 | 0.272 ± 0.022* |
| Alpha (8–13 Hz) | 0.127 ± 0.011 | 0.105 ± 0.012 | 0.079 ± 0.010** |
| Beta (13–30 Hz) | 0.104 ± 0.012 | 0.075 ± 0.013 | 0.068 ± 0.008* |
Mean (±SEM) of the power in the theta, alpha, and beta frequency bands indicate a significant reduction after cath 1 mA stimulation in comparison with sham and cath 0.1 mA treatment. Treatment with cathodal 1 mA also caused a significant increase in the delta band power.
Relative power = ratio of the absolute power in a frequency band to the total absolute power (1–30 Hz).
P < 0.05
P < 0.01.
Cathodal 1 mA tDCS suppresses seizure reentry
The second PTZ injection (20 mg/kg, i.p.) induced a GTCS in 94% of surviving sham rats, 60% of the 1 mA and 74% 0.1 mA stimulated animals. Kaplan–Meier analysis (Fig.2E) displaying the incidence of GTCS after second PTZ injection in the three groups of rats revealed significant differences between the traces by Log-rank (Mantel–Cox) test (χ2 = 9.61; P = 0.008). Individual comparisons of the sham and cath 1 mA GTCS curves show a high statistical difference in the median GTCS incidence and latencies between the two as also noted in Figure2E (Mantel–Cox test, χ2 = 12.16, P = 0.0005). Comparison of median GTCS durations using Kruskal–Wallis reveals a significant group effect (P = 0.028). The median duration of 26 sec (IQR, 0–48 sec) was significantly shorter in rats stimulated with cath 1 mA relative to 56 sec (IQR, 31.25–97.25 sec) of sham (P < 0.05) as calculated by post hoc Dunn’s tests (Fig.2F). The overall mortality (of 35%, 18% and 15% for the sham, cath 1 mA and cath 0.1 mA groups, respectively) was not significantly different among all groups.
Thus cathodal 1 mA tDCS proved to be the more effective stimulation that suppressed clinical epileptic activity caused due to the second PTZ injection and mitigated electrographic epileptic discharges recorded after the first PTZ injection. However, the treatment was not sufficient to prevent or abort the ongoing seizures induced by the first PTZ injection. Hence, in Experiment 2, LZP was introduced into the treatment regime along with sham/cathodal 1 mA tDCS to further evaluate the anticonvulsive effect of the combination.
Experiment 2
LZP + tDCS acutely suppresses clinical PTZ seizures
Similar to the first experiment, the latency to the first clinical myoclonic jerk was not significantly different between the LZP + sham and LZP + tDCS treatment groups. The first PTZ injection induced a GTCS in 67% of rats treated with LZP alone and only 13% in the group treated with LZP + tDCS. Kaplan–Meier analysis (Fig.3A) shows the percent of animals with a GTCS after first PTZ injection revealing significant differences among all three conditions (sham tDCS from Experiment I, LZP + sham, LZP + tDCS) by Log-rank (Mantel–Cox) test (χ2 = 13; P = 0.0015). As expected, individual comparisons using Mantel–Cox test also demonstrated significant differences in the median GTCS incidence and latencies between groups. Comparison of median GTCS durations using Kruskal–Wallis reveals a significant group effect (P < 0.0001). The median duration of 43 sec (IQR, 24.5–140 sec) was significantly longer in sham-stimulated rats relative to 20 sec (IQR, 0–22.75 sec) of LZP + sham (P < 0.05) and 0 sec (IQR, 0–12.25 sec) of LZP + tDCS treatment (P < 0.001) as calculated by post hoc Dunn’s tests (Fig.3B). There were two deaths in the LZP + sham group and none in the LZP + tDCS. Thus the LZP + tDCS combination, in contrast to tDCS in isolation or LZP + sham treatment acutely aborted seizures induced by PTZ.
Figure 3.
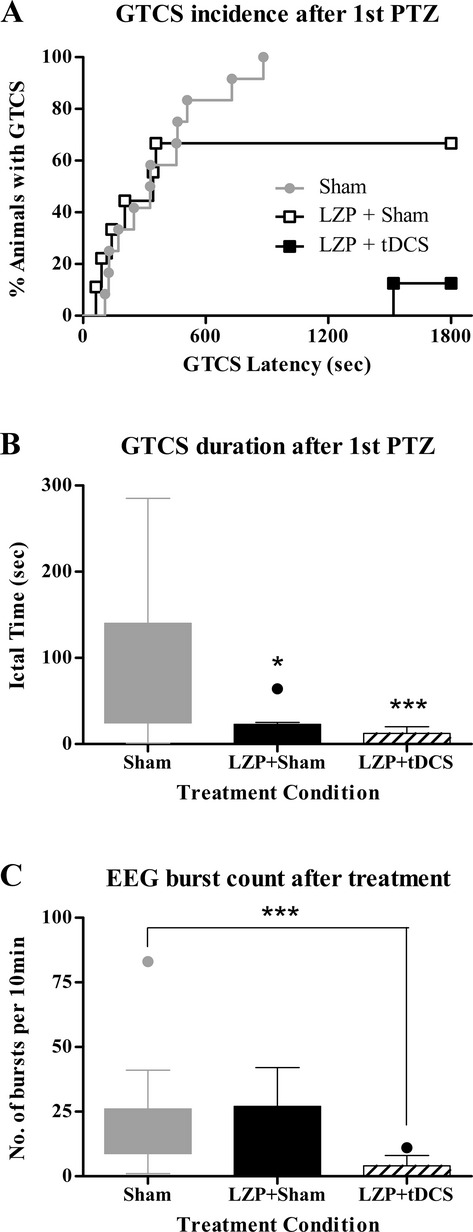
Clinical and EEG outcomes of Lorazepam + tDCS treatment. (A) GTCS incidence and latency after first PTZ injection. Kaplan–Meier survival curve is used to display percentage incidence of GTCS (y-axis) and its latency (x-axis), after first PTZ injection in all treatment conditions. All three groups, Sham, LZP + Sham and LZP + tDCS were significantly different from each other with respect to seizure incidence rate and its latency. Note the distinct separation in the group treated with both LZP and 1 mA cathodal tDCS (LZP + tDCS) to have a very low seizure incidence rate and longer latencies. (B) GTCS duration after first PTZ injection. The two groups treated with LZP had significantly shorter seizures after first PTZ injection relative to no treatment sham group. But LZP in combination with 1 mA cathodal tDCS was more effective than LZP alone in reducing the seizure durations. *P < 0.05, ***P < 0.0001. (C) Spike burst count after first PTZ injection. Graph depicts the number of digitally counted burst discharges per 10 min of recording in the three groups of rats after stimulation. Treatment with LZP + tDCS aborted EEG seizures relative to the LZP + sham or sham groups. Boxes indicate median and first and third quartile. Tukey’s error bars are indicated by top and bottom whiskers. An outlier value is indicated, beyond the Tukey’s error range by the solid circle. ***P < 0.001. EEG, electroencephalography; tDCS, transcranial direct current stimulation; GTCS, generalized tonic-clonic seizures; PTZ, pentylenetetrazol; LZP, lorazepam.
LZP + tDCS suppresses bursts of epileptic spikes on EEG
Similar to Experiment 1, the 10-min period of EEG recording post-PTZ and stimulation was digitally scored for epileptic bursts. The burst counts were statistically compared using Kruskal–Wallis test, which showed a significant group effect (P = 0.0004). By post hoc Dunn’s test, as seen in Figure3C, the median burst count of 0 (IQR, 0–4) in the LZP + tDCS treatment group was significantly lesser than the 14 median bursts (IQR, 8.75–26) of the sham-stimulated animals (P < 0.001). The 6.5 median (IQR, 0.5–27) bursts after treatment with only LZP in the LZP + sham group were not significantly lower than sham or higher than LZP + tDCS condition. Thus, LZP + tDCS suppressed electrographic epileptic activity induced by PTZ.
We note that with LZP on board, none of the animals in the LZP + sham or LZP + tDCS groups experienced a GTCS following a second PTZ injection (data not shown). Hence, analysis for this segment of the experiment is absent.
Experiment 3
Cathodal tDCS enhances cortical inhibition measured by ppTMS
Figure4A demonstrates the representative MEP traces during the ppTMS protocol in the four treatment conditions at the pre-, intra and poststimulation timepoints. ppTMS inhibition was unchanged relative to baseline in the saline + sham group (Fig.4B). Predictably, after PTZ injection (PTZ + sham group), ppTMS revealed impaired inhibition in all rats. The magnitude of the inhibition loss increased progressively from 20 to 45 min timepoints. However, in the rats receiving PTZ and cathodal tDCS, ppTMS inhibition was enhanced immediately following 20 min of tDCS, relative to sal + sham group, and returned to baseline in 25 min after stimulation. Also the saline + tDCS condition had increased inhibition after the stimulation that returned to baseline in 25 min. In the ppTMS groups, repeated-measures ANOVA with treatment group as a between-subjects factor and time as a within-subjects factor shows a significant main effect of treatment [F (3, 24) 5.31, P = 0.006] and time [F (2, 48) 6.19, P = 0.027] between the two factors (Fig.4B). Post hoc analysis at the 20 min timepoint showed that cortical inhibition was significantly increased in sal + tDCS relative to PTZ + sham group (P = 0.019). Most importantly, there was significant change in the inhibition between PTZ + sham and PTZ + tDCS groups (P = 0.001). Likewise, post hoc analysis at the 45 min timepoint revealed significant differences between the progressive loss of inhibition of PTZ + sham group and other groups (sal + sham, P = 0.004; sal + tDCS, P = 0.009; PTZ + tDCS, P = 0.0006).
Figure 4.

Changes in cortical inhibition using ppTMS. (A) Representative MEP traces. Examples of MEPs elicited by ppTMS exhibit inhibition between test and conditioning stimulus (at 100 msec ISI, 120% MT) following saline and PTZ injection (with and without tDCS). (B) ppTMS inhibition. Changes in ppTMS inhibition after saline or PTZ administration. Data were compared with the average level of inhibition in the PTZ + Sham group. Note clear separation between PTZ groups. PTZ caused reduced inhibition over time. tDCS caused increased inhibition 20 min after injection but returned to normal inhibition about 45 min after injection. β < 0.05, α < 0.01, δ < 0.001. ppTMS, paired-pulse transcranial magnetic stimulation; MEP, motor evoked potential; ISI, interstimulus interval; MT, motor threshold; PTZ, pentylenetetrazol; tDCS, transcranial direct current stimulation.
Discussion
We report the first demonstration of acute chemoconvulsant seizure suppression by cathodal tDCS in unanesthetized rats. Using the two-dose PTZ challenge, we show that 20 min of 1 mA cathodal stimulation significantly suppresses EEG epileptiform discharges after an initial PTZ injection, and shortens GTCS duration while increasing latency to GTCS after a second PTZ challenge, ∼30 min later. We also approximated a realistic clinical scenario, where a patient in SE would first receive a first-line antiepileptic drug, and present novel experimental evidence that cathodal tDCS may act synergistically with LZP, a first-line antiepileptic benzodiazepine that is used for clinical SE treatment. The combination of LZP with cathodal tDCS not only acutely reduced the total seizure duration, increased GTCS latency, and decreased the epileptic EEG burst count after an initial PTZ dose, but also completely prevented the reentry into seizure after a second PTZ injection. Finally, expanding on work in humans and preclinical work in our laboratory, we present insights into the neural substrate of tDCS antiepileptic effects as we find, by ppTMS measures, that cathodal tDCS augments GABAergic intracortical inhibition in rats.17,26
Cathodal tDCS has been previously studied as a method of seizure suppression in humans and in animals, but either as a pretreatment before an experimental seizure model, or as an antiepileptic treatment in a long-standing epilepsy. Cathodal tDCS has not been previously tested in the acute seizure setting that approximates SE where we are able to assess an immediate anticonvulsant cathodal tDCS effect. Published reports show that pretreatment with cathodal tDCS increases seizure threshold in a focal electroshock and amygdala seizure kindling models14,27 and 7 days of cathodal tDCS treatment 1 day after pilocarpine-induced SE has a delayed antiepileptic and neuroprotective effect in rat pups.28 In contrast to these experiments which tested a delayed antiepileptic effect, we administered cathodal tDCS during the acute convulsive stage of our SE model, and found electrographic and clinical seizure suppression within minutes of stimulation.
Our translational results also complement limited human antiepileptic tDCS research. In humans, as in animal models, tDCS has not been applied in SE, and, realistically, is unlikely to be tested systematically without preclinical data, given the inhomogeneity of patients who present with this syndrome. This is in large part the motivation for the present report. As with rodent models, cathodal tDCS does appear to have a favorable delayed antiepileptic effect if administered interictally (in contrast to the ictal tDCS timing in our experiments) to patients with established epilepsies, as supported by two controlled trials12,16 and limited case reports29,30 that identify suppression of EEG epileptiform discharges days to weeks after stimulation. However, the outcomes of human case reports and controlled trials are mixed with some showing absence of antiepileptic effect,31 which underscores the need for preclinical studies that may inform future clinical tDCS study design in well-defined epilepsy syndromes recently reviewed in San-Juan et al.32
Our results support acute cathodal tDCS application to stop ongoing clusters of seizures, and thus raise the possibility of its utility in the treatment of SE or repetitive seizures. We aimed specifically to model the clinical setting of SE or frequent repetitive seizures in humans where abortive treatment will not start until after the seizures have started, thus we administered tDCS only after an overt clinical seizure was detected, and tested also the impact of tDCS on recurrent seizures triggered by PTZ reinjection. Furthermore, we examined the possible synergistic effect of tDCS and LZP, currently the standard pharmacologic intervention in the acute setting of repeated seizures or SE in humans. Our findings are the first to indicate that tDCS can increase the LZP anticonvulsant efficacy, and might be a valuable adjunct to pharmacologic SE intervention. Given the favorable safety profile of cathodal tDCS in patients with epilepsy,12,32 the translation of our data into clinical practice in humans seems readily feasible.
Our results also provide insight into the cathodal tDCS mechanism of action. We demonstrate that tDCS not only suppressed seizures, but also influenced cortical activity, increasing the power of low EEG frequencies and decreasing the power of higher frequencies. By ppTMS measures, we also find that cathodal tDCS potentiated paired-pulse cortical inhibition, which, in previous work, we demonstrated reflects GABAA-mediated cortical inhibitory signaling.17 In complement to this measure of enhanced GABAA signaling, we also identified that cathodal tDCS prevented loss of GABAergic paired-pulse motor inhibition that is expected with PTZ-mediated GABAA anatagonism. These preclinical findings add to limited mechanistic data that describe the influences of tDCS on local neurotransmitter concentrations and receptor function in humans, as can be detected by magnetic resonance spectroscopy and pharmacologic studies,33–36 as discussed in a review by Medeiros et al.37 Our identification of enhanced paired-pulse cortical also inhibition underscores the logic of combining cathodal tDCS with GABAergic pharmacotherapy, such as benzodiazepines or barbiturates. While beyond the scope of this report, we anticipate future experiments aimed to identify DC influences on cortical GABA signaling at the synaptic level for purposes of identifying opportunities for rational coupling of pharmaceuticals and tDCS (or related technologies). This may be accomplished in vitro where magnitudes of excitatory and inhibitory field potentials and postsynaptic currents can be studies in a simplified, essentially two-dimensional, preparation that enables fine control of the electrical current vector relative to neuronal structures, as we have done in previously in isolated hippocampal slices.38
Our results should be interpreted with caution and further studies are certainly warranted given a few important limitations. First, we studied the rat PTZ seizure model, and it is unclear what impact model-specific factors might have on the clinical translation of our findings to humans. Testing the effects of tDCS on other acute seizure models is thus anticipated. We also recognize that the exact influence of tDCS may differ between healthy and diseased brain, and continued exploration in disease models and clinical disease states should enable more sophisticated and precisely targeted use of this technique in clinical practice.
Second, while we speak about “cathodal” tDCS, we are cognizant of the fact that there is in fact no such entity as a purely cathodal or anodal tDCS; there are always at least two electrodes and thus a current path between the two which affects more brain structures than just the cortical region under one electrode or another. In our case, we used a large extracephalic anode, and a cephalic cathode electrode. However, modeling of the current induced in the rat brain would certainly be valuable to gain further insights into the brain impact of the induced current, or measuring the DC effects in simplified, in vitro, brain preparation as our laboratory has done38 should guide methodological implications for the translation to humans. In our manuscript, the terminology used (cathodal tDCS) is simply to clarify that we focus on the effects under the cathode, but we cannot rule a critical contribution of anodal effects.
Third, the current density induced in the rat brain may well be higher than that achieved in humans. Indeed, we do not really know how to properly transfer intensity and extent of cortical impact (i.e., ultimately dose) from rats to humans. Dose findings studies in humans would thus be important. Furthermore, the ppTMS studies were done with the rats exposed to small amounts of anesthetic, and we cannot fully rule out an interaction between the anesthetics used and the tDCS effects. Similarly, in considering translation of our findings to humans, it will be important to consider the possible impact of different medications, notably antiepileptic medications on the effects of tDCS.
Last, we recognize that better seizure suppression after the second, smaller, PTZ dose may reflect tDCS antiepileptic potency which is insufficient to overcome seizures triggered by high-dose PTZ, but adequate to suppress seizures triggered by a lower PTZ dose. While beyond the scope of these early experiments, further studies with a range of convulsant doses and tDCS intensities and treatment durations may clarify this concern.
Despite these limitations, our study provides novel experimental evidence that cathodal tDCS alone and particularly in combination with LZP shows anticonvulsive potential in the PTZ rat seizure model. Cathodal tDCS appears to work by augmenting GABAA-mediated cortical inhibition and appears to be worth examining further as an adjunct in the acute treatment of repeated seizures and SE in humans.
Acknowledgments
Authors thank Tsung-Hsun Hsieh for his assistance in data acquisition over the course of the study.
Author Contributions
S. C. D., D. E., Z. Z., A. R. conceived and designed the experiments. S. C. D., D. E., Z. Z., R. G. performed the experiments. S. C. D., D. E., Z. Z., D. Z., A. R. analyzed the data. T. L., A. P. L., F. E. J., A. R. contributed materials/analysis tools. S. C. D., D. E., T. L., A. P. L., A. R. wrote the paper.
Conflict of Interest
This study was supported by the Translational Research Program at Boston Children’s Hospital. Authors S. C. D., D. E., R. G., Z. Z., and D. Z. report no financial interests or potential conflicts of interest. A. R. is a founder of Neuro’motion Inc., and serves on the scientific advisory board of NeuroRex Inc. A. P. L. serves on the scientific advisory boards for Nexstim, Neuronix, Starlab Neuroscience, Neuroelectrics, and Neosync. A. R., A. P. L., and F. E. J. are listed as inventors on several issued and pending patents on the real-time integration of TMS with EEG and magnetic resonance imaging. T. L. serves on the Laboratory Accreditation Board for Long Term (Epilepsy and Intensive Care Unit) Monitoring, on the Council of the American Clinical Neurophysiology Society, on the American Board of Clinical Neurophysiology, as an Associate Editor for Seizure.
References
- Thurman DJ, Beghi E, Begley CE, et al. Standards for epidemiologic studies and surveillance of epilepsy. Epilepsia. 2011;52(suppl 7):2–26. doi: 10.1111/j.1528-1167.2011.03121.x. [DOI] [PubMed] [Google Scholar]
- Ngugi AK, Bottomley C, Kleinschmidt I, et al. Estimation of the burden of active and life-time epilepsy: a meta-analytic approach. Epilepsia. 2010;51:883–890. doi: 10.1111/j.1528-1167.2009.02481.x. [DOI] [PMC free article] [PubMed] [Google Scholar]
- Li JM, Chen L, Zhou B, et al. Convulsive status epilepticus in adults and adolescents of southwest China: mortality, etiology, and predictors of death. Epilepsy Behav. 2009;14:146–149. doi: 10.1016/j.yebeh.2008.09.005. [DOI] [PubMed] [Google Scholar]
- Kim SJ, Lee DY, Kim JS. Neurologic outcomes of pediatric epileptic patients with pentobarbital coma. Pediatr Neurol. 2001;25:217–220. doi: 10.1016/s0887-8994(01)00311-3. [DOI] [PubMed] [Google Scholar]
- Neligan A, Shorvon SD. Frequency and prognosis of convulsive status epilepticus of different causes: a systematic review. Arch Neurol. 2010;67:931–940. doi: 10.1001/archneurol.2010.169. [DOI] [PubMed] [Google Scholar]
- Trinka E, Shorvon S. Status epilepticus – where are we in 2013? Epilepsia. 2013;54(suppl 6):1–2. doi: 10.1111/epi.12263. [DOI] [PubMed] [Google Scholar]
- Alldredge BK, Gelb AM, Isaacs SM, et al. A comparison of lorazepam, diazepam, and placebo for the treatment of out-of-hospital status epilepticus. N Engl J Med. 2001;345:631–637. doi: 10.1056/NEJMoa002141. [DOI] [PubMed] [Google Scholar]
- Spatola M, Alvarez V, Rossetti AO. Benzodiazepine overtreatment in status epilepticus is related to higher need of intubation and longer hospitalization. Epilepsia. 2013;54:e99–e102. doi: 10.1111/epi.12235. [DOI] [PubMed] [Google Scholar]
- Chin RF, Neville BG, Peckham C, et al. Treatment of community-onset, childhood convulsive status epilepticus: a prospective, population-based study. Lancet Neurol. 2008;7:696–703. doi: 10.1016/S1474-4422(08)70141-8. [DOI] [PMC free article] [PubMed] [Google Scholar]
- Hocker SE, Britton JW, Mandrekar JN, et al. Predictors of outcome in refractory status epilepticus. JAMA Neurol. 2013;70:72–77. doi: 10.1001/jamaneurol.2013.578. [DOI] [PubMed] [Google Scholar]
- Brunoni AR, Fregni F, Pagano RL. Translational research in transcranial direct current stimulation (tDCS): a systematic review of studies in animals. Rev Neurosci. 2011;22:471–481. doi: 10.1515/RNS.2011.042. [DOI] [PubMed] [Google Scholar]
- Fregni F, Thome-Souza S, Nitsche MA, et al. A controlled clinical trial of cathodal DC polarization in patients with refractory epilepsy. Epilepsia. 2006;47:335–342. doi: 10.1111/j.1528-1167.2006.00426.x. [DOI] [PubMed] [Google Scholar]
- Lang N, Siebner HR, Ward NS, et al. How does transcranial DC stimulation of the primary motor cortex alter regional neuronal activity in the human brain? Eur J Neuorsci. 2005;22:495–504. doi: 10.1111/j.1460-9568.2005.04233.x. [DOI] [PMC free article] [PubMed] [Google Scholar]
- Liebetanz D, Klinker F, Hering D, et al. Anticonvulsant effects of transcranial direct-current stimulation (tDCS) in the rat cortical ramp model of focal epilepsy. Epilepsia. 2006;47:1216–1224. doi: 10.1111/j.1528-1167.2006.00539.x. [DOI] [PubMed] [Google Scholar]
- Wachter D, Wrede A, Schulz-Schaeffer W, et al. Transcranial direct current stimulation induces polarity-specific changes of cortical blood perfusion in the rat. Exp Neurol. 2011;227:322–327. doi: 10.1016/j.expneurol.2010.12.005. [DOI] [PubMed] [Google Scholar]
- Auvichayapat N, Rotenberg A, Gersner R, et al. Transcranial direct current stimulation for treatment of refractory childhood focal epilepsy. Brain Stimul. 2013;6:696–700. doi: 10.1016/j.brs.2013.01.009. [DOI] [PubMed] [Google Scholar]
- Hsieh TH, Dhamne SC, Chen JJ, et al. A new measure of cortical inhibition by mechanomyography and paired-pulse transcranial magnetic stimulation in unanesthetized rats. J Neurophysiol. 2012;107:966–972. doi: 10.1152/jn.00690.2011. [DOI] [PMC free article] [PubMed] [Google Scholar]
- Rotenberg A, Muller P, Birnbaum D, et al. Seizure suppression by EEG-guided repetitive transcranial magnetic stimulation in the rat. Clin Neurophysiol. 2008;119:2697–2702. doi: 10.1016/j.clinph.2008.09.003. [DOI] [PMC free article] [PubMed] [Google Scholar]
- Sarkisian MR. Overview of the current animal models for human seizure and epileptic disorders. Epilepsy Behav. 2001;2:201–216. doi: 10.1006/ebeh.2001.0193. [DOI] [PubMed] [Google Scholar]
- Besio WG, Makeyev O, Medvedev A, Gale K. Effects of transcranial focal electrical stimulation via tripolar concentric ring electrodes on pentylenetetrazole-induced seizures in rats. Epilepsy Res. 2013;105:42–51. doi: 10.1016/j.eplepsyres.2012.12.002. [DOI] [PMC free article] [PubMed] [Google Scholar]
- Muller PA, Dhamne SC, Vahabzadeh-Hagh AM, et al. Suppression of motor cortical excitability in anesthetized rats by low frequency repetitive transcranial magnetic stimulation. PLoS One. 2014;9:e91065. doi: 10.1371/journal.pone.0091065. [DOI] [PMC free article] [PubMed] [Google Scholar]
- Rotenberg A, Muller PA, Vahabzadeh-Hagh AM, et al. Lateralization of forelimb motor evoked potentials by transcranial magnetic stimulation in rats. Clin Neurophysiol. 2010;121:104–108. doi: 10.1016/j.clinph.2009.09.008. [DOI] [PMC free article] [PubMed] [Google Scholar]
- Vahabzadeh-Hagh AM, Muller PA, Pascual-Leone A, et al. Measures of cortical inhibition by paired-pulse transcranial magnetic stimulation in anesthetized rats. J Neurophysiol. 2011;105:615–624. doi: 10.1152/jn.00660.2010. [DOI] [PMC free article] [PubMed] [Google Scholar]
- Ben-Ari Y. Limbic seizure and brain damage produced by kainic acid: mechanisms and relevance to human temporal lobe epilepsy. Neuroscience. 1985;14:375–403. doi: 10.1016/0306-4522(85)90299-4. [DOI] [PubMed] [Google Scholar]
- Hellier JL, Patrylo PR, Buckmaster PS, Dudek FE. Recurrent spontaneous motor seizures after repeated low-dose systemic treatment with kainate: assessment of a rat model of temporal lobe epilepsy. Epilepsy Res. 1998;31:73–84. doi: 10.1016/s0920-1211(98)00017-5. [DOI] [PubMed] [Google Scholar]
- Cengiz B, Murase N, Rothwell JC. Opposite effects of weak transcranial direct current stimulation on different phases of short interval intracortical inhibition (SICI) Exp Brain Res. 2013;225:321–331. doi: 10.1007/s00221-012-3369-0. [DOI] [PubMed] [Google Scholar]
- Kamida T, Kong S, Eshima N, Fujiki M. Cathodal transcranial direct current stimulation affects seizures and cognition in fully amygdala-kindled rats. Neurol Res. 2013;35:602–607. doi: 10.1179/1743132813Y.0000000170. [DOI] [PubMed] [Google Scholar]
- Kamida T, Kong S, Eshima N, et al. Transcranial direct current stimulation decreases convulsions and spatial memory deficits following pilocarpine-induced status epilepticus in immature rats. Behav Brain Res. 2011;217:99–103. doi: 10.1016/j.bbr.2010.08.050. [DOI] [PubMed] [Google Scholar]
- Assenza G, Campana C, Formica D, et al. Efficacy of cathodal transcranial direct current stimulation in drug-resistant epilepsy: a proof of principle. Conf Proc IEEE Eng Med Biol Soc. 2014;2014:530–533. doi: 10.1109/EMBC.2014.6943645. [DOI] [PubMed] [Google Scholar]
- Yook SW, Park SH, Seo JH, et al. Suppression of seizure by cathodal transcranial direct current stimulation in an epileptic patient – a case report. Ann Rehabil Med. 2011;35:579–582. doi: 10.5535/arm.2011.35.4.579. [DOI] [PMC free article] [PubMed] [Google Scholar]
- Varga ET, Terney D, Atkins MD, et al. Transcranial direct current stimulation in refractory continuous spikes and waves during slow sleep: a controlled study. Epilepsy Res. 2011;97:142–145. doi: 10.1016/j.eplepsyres.2011.07.016. [DOI] [PubMed] [Google Scholar]
- San-Juan D, Morales-Quezada L, Orozco Garduno AJ, et al. Transcranial direct current stimulation in epilepsy. Brain Stimul. 2015;8:455–464. doi: 10.1016/j.brs.2015.01.001. [DOI] [PubMed] [Google Scholar]
- Clark VP, Coffman BA, Trumbo MC, Gasparovic C. Transcranial direct current stimulation (tDCS) produces localized and specific alterations in neurochemistry: a (1)H magnetic resonance spectroscopy study. Neurosci Lett. 2011;500:67–71. doi: 10.1016/j.neulet.2011.05.244. [DOI] [PubMed] [Google Scholar]
- Krause B, Marquez-Ruiz J, Cohen Kadosh R. The effect of transcranial direct current stimulation: a role for cortical excitation/inhibition balance? Front Hum Neurosci. 2013;7:602. doi: 10.3389/fnhum.2013.00602. [DOI] [PMC free article] [PubMed] [Google Scholar]
- Stagg CJ, Best JG, Stephenson MC, et al. Polarity-sensitive modulation of cortical neurotransmitters by transcranial stimulation. J Neurosci. 2009;29:5202–5206. doi: 10.1523/JNEUROSCI.4432-08.2009. [DOI] [PMC free article] [PubMed] [Google Scholar]
- Liebetanz D, Nitsche MA, Tergau F, Paulus W. Pharmacological approach to the mechanisms of transcranial DC-stimulation-induced after-effects of human motor cortex excitability. Brain. 2002;125(Pt 10):2238–2247. doi: 10.1093/brain/awf238. [DOI] [PubMed] [Google Scholar]
- Medeiros LF, de Souza IC, Vidor LP, et al. Neurobiological effects of transcranial direct current stimulation: a review. Front Psychiatry. 2012;3:110. doi: 10.3389/fpsyt.2012.00110. [DOI] [PMC free article] [PubMed] [Google Scholar]
- Kabakov AY, Muller PA, Pascual-Leone A, et al. Contribution of axonal orientation to pathway-dependent modulation of excitatory transmission by direct current stimulation in isolated rat hippocampus. J Neurophysiol. 2012;107:1881–1889. doi: 10.1152/jn.00715.2011. [DOI] [PMC free article] [PubMed] [Google Scholar]