Abstract
‘Kalia’, a popular preparation of Rohu fish, packed in four-layered laminated retort pouch was processed in a steam/air mixture over-pressure retort at 121.1 °C to three different F0 values of 7, 8 and 9 min. Time-temperature data were collected during heat processing using an Ellab Sterilization Monitoring System. Texture profile such as hardness, springiness, gumminess and chewiness decreased as the F0 value increased. The L* values decreased whereas a* and b* values increased with increasing F0 value. Based on the commercial sterility, sensory evaluation, colour and texture profile analysis, F0 value of 8 min and cook value of 66 min, with a total process time of 41.7 min at 121.1 °C was found satisfactory for the preparation of Rohu fish curry (Kalia) in retort pouches.
Keywords: Rohu fish, Fish curry, Retort pouch, Thermal processing, Texture profile analysis, Sensory analysis
Introduction
Expansion of population followed by rapid urbanization has created additional sources of income which transformed the lifestyle of urban population in India. There is increasing demand of food products by the consumers those are high in quality in respect of taste, appearance and nutrition and preferably require minimal preparation time. One solution that offers promise is a new packaging technology, the retort pouch, a flexible, laminated package that can withstand thermal processing temperatures and combines the advantages of both metal cans and plastic packages. Retort pouches have several advantages over cans, some of these are, the retort pouch–packed product needs significantly less heat than cans to achieve commercial sterility, with cooking time and energy costs reduced by half, heat penetrates the food much more quickly when it only has to reach the inside of a half-inch thick mass rather than the much thicker mass in a round can. Unlike canned foods, the pouched foods will not be overcooked and softened into mush, ensuring better texture and taste. Most retort pouches are constructed with a 4-ply laminate consisting of polyester outside layer, a nylon second layer, an aluminium foil third layer, and a polypropylene inner layer. The melting point of polypropylene polymers is around 138 °C (280 °F), which is higher than the commercialized sterilization temperature of 121 °C (250 °F).
In India, retort pouch processing is gaining popularity over metal containers due to its unique advantages of cheaper in price, thinner profile than cans and jars, shorter processing time, lesser nutrient loss, easier opening, the product can be eaten directly from the pouch or served on dishes, takes smaller storage space and easier disposal (Mermelstein 1978). Thermal processing is one of the most effective means of preserving food (Karel et al. 1975) and has very good market demand. It generally involves heating of foods for a predetermined time at a preselected temperature to eliminate pathogenic microorganisms that endanger the public health as well as those microorganisms and enzymes that deteriorate the food during storage. Today, the consumer demands safe and shelf-stable foods and insists on high-quality foods. Various researchers (Hu et al. 1955; Goldfarb 1970; Ravishankar et al. 2002; Bindu et al. 2004) have proven the technical and commercial feasibilities of using retortable pouches for thermal processing.
Reduction of heating time using pouches has been reported by a number of workers (Lampi 1977; Chia et al. 1983; Durance and Collins 1991). Chia et al. (1983) reported 34, 32 and 37 % less processing time for pouched rainbow trout, pollock and shrimp respectively, compared to canned products. Durance and Collins (1991) reported a 48 % reduction of processing time for chum salmon in pouches compared with cans. Ali et al. (2005a) reported that the processing time reduced when the pouches were rotated within the retort while thermally processing tuna in oil. Chen and George (1981) showed that green beans processed in pouches had better flavour, texture and overall acceptability than when processed in a can, but, the colour of the canned beans was preferred. Durance and Collins (1991) reported significantly less off-flavour and greater acceptance of chum salmon in retort pouches than cans. Chia et al. (1983) reported that the pouched products were firmer in texture and lighter in colour. Gopal et al. (2001) reported that mackerel fish curry processed in retortable pouches had a shelf life of not less than 12 months at ambient temperature. Canning of Rohu (Labeo rohita) in curry medium using TFS can have been reported by Mallick et al. (2006) and a F0 value of 8.79 was found satisfactory.
One of the main features in appreciating seafood is the texture (Cheret et al. 2005). The appearance and odour are also very important for consumers. Heating of meat is accompanied by changes in appearance, smell, taste, texture and nutritive value. During the heating of meat, numerous volatile compounds are formed that contribute to the meaty flavour. Jarvis (1952) reported that excessive heating of little tuna produced a toughening of the texture. Measurement of sensory properties of different types of fishery products has been reviewed by different authors (Connell and Shewan 1980; York and Sereda 1994). The texture profile analysis (TPA), which measures the compression force of a probe and the related textural parameters of a test food during 2 cycles of deformation of various foodstuffs including fruits, vegetables, bakery, meat products, seafood and specifically retorted products, has been reported (Panifield and Campbell 1990; Durance and Collins 1991; Sanchez-Brambila et al. 2002; Caine et al. 2003). Ali et al. (2005b) showed an improved texture of canned sardine in oil in pouches compared to cans. Texture has been defined as “the sensory and functional manifestation of the structural, mechanical and surface properties of foods detected through the sense of vision, hearing, touch and kinaesthetic” (Szczesniak 2002). The first quality impact by which the consumers take the decision to acquire a product is its visual appearance. Colour is a very important quality factor in thermally processed seafood products, since it influences consumer acceptability.
Freshwater fish contributes considerably in the world food production, both in biomass and diversity. Freshwater fish contains, compared to meat, less lipid but more unsaturated fat and n-3 fatty acids, more moisture and highly digestible protein and is devoid of fishy flavour and odour due to little amount of volatile bases (Karmas and Lauber 1987; Aggelousis and Lazos 1991). Most of the Indian major carps and Chinese carps are larger sized fast growing aquaculture species and have been cultivating for centuries on the continents of Asia, Europe and Africa. Although various processing methods of some freshwater species have been developed during the last two decades (Lazos 1997), a few attempts have been taken to utilize these species as ready-to-serve fish curry with sufficient storage life in ambient temperature.
Rohu (Labeo rohita) belongs to Indian major carp, considered as one of the commercially important freshwater fish species, very popular in fish eating communities of India. Several works have been reported on retort pouch processing of seawater fish and shrimp, but similar works on fresh water fish are very less and there is, particularly no report on specialized preparation of freshwater fish curry, viz.,‘Kalia’, a sour-curd incorporated culinary preparation of Rohu fish, usually served in special occasion like marriage. The present study is aimed to optimize parameters for thermal processing of ready-to-eat specialized fish curry, ‘Kalia’ from Rohu fish.
Materials and methods
Fish
Medium sized Rohu fish (Labeo rohita), weighing about 1.5 kg, procured from the local village and transported to laboratory in chilled condition (ice to fish ratio1:1), were used for this study. They were washed with chilled potable water, de-scaled, gutted and dressed into steaks of thickness around 2 cm (average weight 65 ± 5 g). In order to remove slime and blood and to increase the firmness of fish muscle during thermal processing, Rohu fish steaks were cold (5 ± 2 °C) blanched by dipping in 10 % salt solution for 30 min. The blanched fish steaks were marinated with turmeric powder (50 % of the total requirement) for 30 min. The marinated fish steaks were deep fried for about 12–15 s in boiling refined sunflower oil (~180 °C).
Preparation of gravy
Ingredients used for the Rohu-Kalia preparation are presented in Table 1 and the curry was prepared by the following method. Two pastes, namely ‘green paste’ comprising of garlic, green chilli and ginger, and ‘red paste’ comprising of turmeric powder, coriander powder, cumin powder, chilli powder, salt and sugar were prepared. A small quantity of black cumin seed and fenugreek were fried for a while followed by addition of ‘green paste’ and frying continued till the colour turned reddish. The ‘red paste’ was added to fried ‘green paste’ and heating continued gently under low flame till the emergence of characteristic aroma. This step was followed by addition of curd and required quantity of water to the fried spices and heating at low flame continued till boiling of the gravy.
Table 1.
Recipe for Rohu fish curry (Rohu-Kalia)
| Ingredients | Percentage, % |
|---|---|
| Fish (steaks) | |
| Green chilli | 7.0 |
| Ginger | 5.0 |
| Garlic | 5.0 |
| Cumin powder | 3.0 |
| Coriander powder | 1.5 |
| Chilli powder | 0.75 |
| Turmeric powder | 0.75 |
| Salt | 2.0 |
| Sour curd | 50.0 |
| Oil | 15.0 |
| Water | 10.0 |
Retort pouch
Laminated flexible pouch (4-ply), consisting of 12 μm polyester (outer layer), 9 μm aluminium foil and 15 μm nylon (middle layer) and 70 μm polypropylene (inner cast) was used for packing the fish curry. Pouches (150 × 200 mm) with filling capacity of around 300 g used in the present study were purchased from M/s. Pradeep Laminators Pvt. Ltd. Pune, Maharashtra, India.
Overpressure retort
The pilot scale overpressure retorting unit (Sakara Equipments, Bangalore, India) consisting of retort, boiler, air compressor, centrifugal pump and the control system (PLC) was used for thermal processing. The unit used in the study is similar to the commercial scale equipment, which produces a high degree of process reproducibility and accuracy. After processing the pouches to a required F0 value, they were cooled rapidly to 50 ± 10 °C by spraying water under pressure and further cooled in chilled water immediately after taking out from the retort. Then the cooled pouches were dried, labelled and stored.
Filling and sealing of retort pouch
About 140 ± 10 g (two steaks) of flash fried Rohu steaks were packed in retort pouches. Each of the pouch was filled with hot gravy (80 ± 10 g) maintaining a pack weight of about 220 ± 10 g. Care was taken to avoid the contamination of seal area in the pouches. Adequate numbers of retort pouches were fixed with glands and thermocouples and the tip of the thermocouple was inserted into the fish pieces.
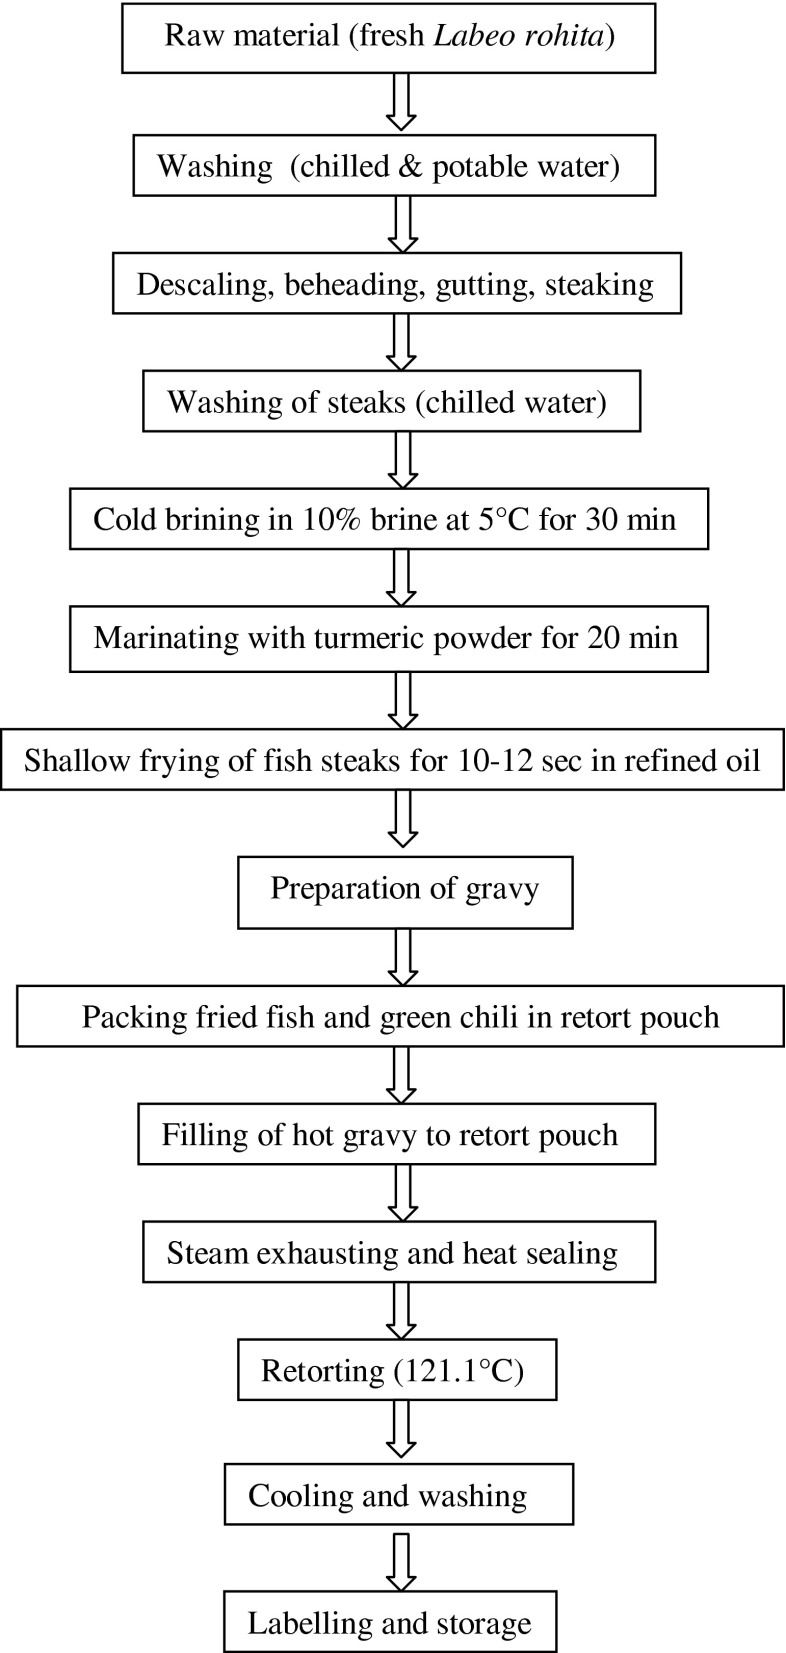
The pouches were immediately injected with steam (for about 10 s) to remove the air present in the pouches, followed by sealing with pneumatic retort pouch sealing machine (Sunray Industries, Mysore, India). The sealed pouches were subjected to thermal processing for optimizing F0 value at process temperature. The detailed steps for thermal processing of Rohu-Kalia in retort pouch are given in Fig. 1.
Fig. 1.
Thermal processing of Rohu in curry medium
Thermal process evaluation
Filled and sealed pouches were heat processed to required F0 values. Ellab Eval Flex Four Channel Thermal Validation and Sterilization Monitoring System, Cat. 21401004 (Ellab A/S, Trollesmindealle 25, DK-3400 Hilleroed, Denmark) with Ellab CTF 9004 Precision Thermometer and F0 value integrator was used to record core temperature, retort temperature, F0 value and cook value at a specific time interval of 60 s. The probes used for the experiments were copper/cupronickel thermocouples (Ellab SSA-12050-G700- TS) of stainless steel electrode with a length of 50 mm and dia of 1.2 mm. The packing glands (GKJ13009C052) made from 50 mm stainless steel tubes were used for thermal processing experiments. The F0 constants were programmed at T = 121.1 °C, Z = 10 °C and cook value constants at T = 100 °C and Z value for calculating C value was 33 °C.
Thermocouple outputs (time-temperature data) were analyzed using a computer. The heat penetration data were plotted on a semi-log paper with temperature deficit (retort temperature-cold spot temperature) on log scale against time. Lag factor for heating (Jh), slope of the heating curve (fh), time in minutes for sterilization at retort temperature (U) and lag factor for cooling (Jc) were determined. The process time was calculated by mathematical method (Stumbo 1973). Total process time was determined by adding Ball’s process time (B) and the 58 % of the come up time. Cook value (CV), a measure of heat treatment with respect to nutrient degradation and textural changes that occur during processing, was also determined by measuring the extent of cooking and nutritional loss during processing in a manner similar to the D-value, except that the reference temperature is 100 °C instead of 121 °C, and the Z value is 33 °C, which is required for the denaturation of thiamine (Ranganna 2002).
Instrumental analysis of texture
The TPA method of Bourne (1978) based on compression of samples with the muscle texture analyzer (TA-XT Plus, Stable Micro Systems, UK) was used to objectively evaluate texture. The texture profile analysis (TPA) was performed using a cylindrical probe of 75 mm dia (P/75) fitted with a load cell of 50 N. Cooked fish steaks were cut in to 2.5 cubic cm block for analysis of texture profile. Six samples from three pouches were used for the analysis. The texture measurement included 2 consecutive 40 % compressions of the sample at a crosshead speed of 12 mm/min (Bourne 1978; Durance and Collins 1991; Ali et al. 2005b). Force by time data from each test was used to calculate mean values for the TPA parameters as described by Bourne (1978). The values for hardness 1 and 2 are the resistance at maximum compression during the 1stand 2ndcompression. The cohesiveness, the extent to which the sample could be deformed before rupture is the ratio of the positive force area during the 2nd compression to that during the 1st compression (Area 2/Area 1). Springiness measures the ability of the sample to recover its original form after the deforming force is removed, is the ratio of the time duration of force input during the 2nd compression to that during the 1st compression (length 2/length 1). Chewiness indicates the work needed to chew a solid sample to a steady state of swallowing (hardness 1 × cohesiveness × springiness in kg), whereas, gumminess is the product of hardness and cohesiveness.
Instrumental analysis of colour
The colour measurement of the homogenized sample was measured using spectrocolorimeter (Colourflex EZ, Hunter Associates Laboratory, Inc, Reston, VA) with geometry of diffuse 8° and an illuminant of D65/10° (Shah1991). This instrument was calibrated with black and white reference tiles before analysis. A glass cell containing the ground sample of fish was placed above the light sources and post processing L*, a* and b* values were recorded. Six readings were taken for each steak and average values were calculated. The CIELAB (L*, a*, b*) colour scale was used for the study. In this coordinate system, L* is a measure of the lightness of a sample and ranges from 0 (black) to 100 (white). The chromaticity dimension (a and b) gives understandable designation of colour as follows; a* measures redness when positive, gray when zero and greenness when negative, b* measures yellowness when positive, gray when zero and blueness when negative. Higher values of a* and b* indicate more saturation in colour.
Proximate composition
The moisture content of raw and cooked meat of Rohu was determined by heating the sample initially at 100 °C and later at a temperature of 170 °C using automatic moisture analyzer (Sartorius, Model MA 35, Bohemia, N.Y., U.S.A.). Moisture content corresponds to the weight loss of the sample. The crude protein content (total nitrogen × 6.25) was determined by the micro-kjeldahl method (AOAC 2000). Fat was determined by the method described by the AOAC (2000) using the Soxhlet extraction system. Ash content was determined by ashing at 550 °C ± 10 °C for 6 h in a muffle furnace. Total volatile basic nitrogen (TVBN) was determined by distillation method (AOAC 2000).
pH
The pH was determined by blending 10 g of fish muscle with 90 mL distilled water in a homogenizer (Ultra-Turax, IKA, Germany) for 30 s using a digital pH meter (Sartorius, Bohemia, New York, USA) standardized at pH 4 and 7.
Thiobarbituric acid (TBA) value
TBA value was determined using the method of Tarladgis et al. (1960). The absorbance was determined by a spectrophotometer at 532 nm against a blank containing distilled water and TBA solution. The TBA value was expressed as mg malonaldehyde per kg meat.
Microbial analysis
The total plate count (TPC) was estimated by the spread plate technique (Hitching et al.1995). Ten grams of the sample were weighed aseptically into a sterile sample dish and transferred into a sterile polythene pouch containing 90 mL normal saline. The sample was blended in a Stomacher (Seward, West Sussex, UK) for 60 s at normal speed. Using a sterile pipette, 1 mL of the supernatant was aseptically transferred into a 9 mL saline tube and mixed well using vortex mixer. Similarly, further dilutions were prepared. A total of 0.1 mL each of the appropriate dilutions was pipetted out on to sterile agar petri dishes, taken in duplicates for each dilution. The plates were incubated at 37 °C for 48 h in an inverted position. After incubation, the individual bacterial colonies were counted. The average number of colonies was calculated and expressed as cfu/g of the sample.
Commercial sterility test
The samples processed at different F0 value and at different temperatures were incubated at 37 °C for 15 d and 55 °C for minimum of 5 d. The incubated pouches were aseptically opened and 1 to 2 g of the samples were taken by a sterilized forceps and inoculated into the sterilized fluid thioglycolate broth in test tubes. Sterilized liquid paraffin was put on to the top of the broth to create anaerobic condition and incubated at 37 °C for 48 h and at 55 °C for 4 d (IS: 2168 1971), respectively.
Sensory test
Thermally processed Rohu fish curry pouches were randomly selected (4 retort pouches for each treatment) and heated in boiling water for 5 min. The contents of the sample including curry were placed in coded white enamel plates and served warm to panellists in separate booths equipped with proper illumination. The panelists were allowed to drink water before and after evaluation of each sample, to restore taste sensitivity. The changes in the sensory characteristics of the Rohu fish curry samples were evaluated by a panel of 7 researchers from the Institute, who have previously participated in the evaluation of similar products, on a 10-point scale (IS: 6273 [II] 1971; Vijayan 1984). A sensory score of 4 was taken as the limit of acceptability.
The panelists were asked to assign a score of 1 to 10 (1 = dislike extremely, 2 = dislike very much, 3 = dislike moderately, 4 = dislike slightly, 5 = neither like nor dislike, 6 = light slightly, 7 = like moderately, 8 = like very much, 9 = like extremely, 10 = excellent) for appearance, colour, flavour, odour, taste, texture, and overall acceptability, as described by Vijayan (1984).
Statistical analysis
The data obtained were analyzed using analysis of variance (ANOVA) and when significant differences were found, comparisons among means were carried out by using Duncan’s Multiple Comparison Test by Statistical Package for Social Sciences (SPSS, version 11.0 for windows).
Results and discussion
Biochemical and microbiological quality of fresh Rohu meat
Proximate analysis of fresh Rohu fish revealed that the moisture, protein, fat and ash content was 78.75 ± 0.35 %, 16.30 ± 0.31 %, 3.12 ± 0.12 % and 1.12 ± 0.08 % respectively. Studies on the biochemical composition of the Rohu fish meat indicated medium fat content. Nowsad et al. (1999) reported moisture, protein, fat and ash content of Rohu meat as 80.4 ± 1.91 %, 17.1 ± 0.41 %, 1.9 ± 0.34 % and 0.87 ± 0.03 respectively. Higher fat content of Rohu used in this study may be due to harvesting time coincides its pre-spawning feeding season (April). The observed crude protein content in the fish muscle is comparable to other fresh water fishes. Fresh Rohu meat had a pH of 6.65 ± 0.02, TBA value of 0.049 ± 0.02 mg malonaldehyde/kg meat, total volatile base nitrogen (TVBN) content of 7.17 ± 0.15 mg% and TPC of 4.5× 10⁴ cfu/g. Nowsad et al. (1999) reported a pH of 6.9 in fresh Rohu meat. The TPC, TBA and TVBN level were below the approved food standards limit.
Standardization of thermal process for Rohu fish curry (Kalia) in retort pouch
Based on the different literatures and culinary style used for preparation of fish in curry medium, the product (Rohu-Kalia) developed was processed at sterilizing temperature of 121.1 °C. At this process temperature, the curry packed in retort pouch was subjected to three different F0 values (7, 8 and 9 min).
Although the Rohu curry processed at F0 7, 8 and 9 min were commercially sterile, based on the sensory evaluation, instrumental colour and texture profile analysis of the finished products F0 value of 8.14 min, cook value of 66.01 min, with a total process time of 41.70 min at 121.1 °C was satisfactory for specialized Rohu fish curry (Rohu-Kalia) (Fig. 1). According to Frott and Lewis (1994), the F0 value recommended for fish products is in the range of 5 to 20. Gopal et al. (1998, 2001) reported that F0 8.43 was satisfactory for fish curry products. According to Mallick et al. (2006), F0 8.79 min was said to be sufficient to get a commercially sterile fish product.
Thermal processing
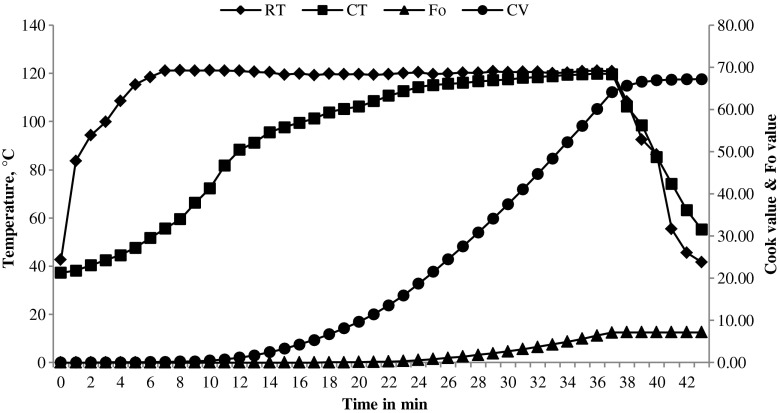
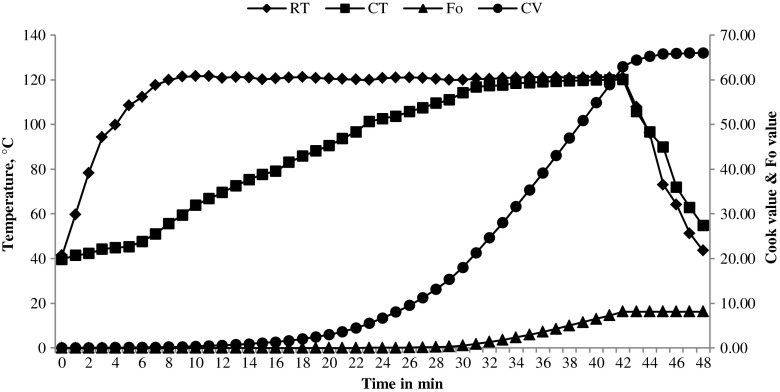
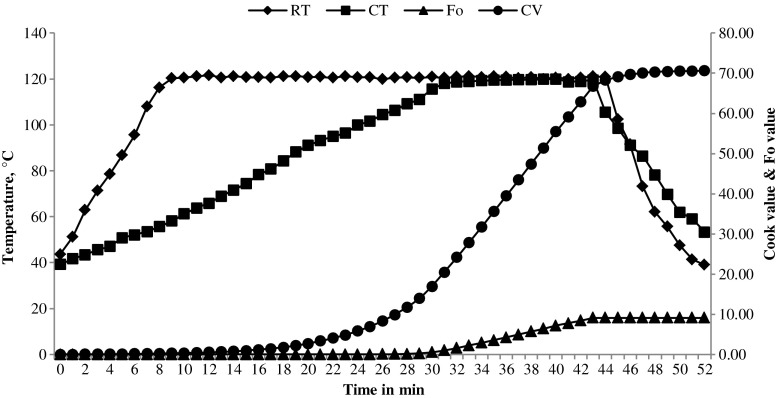
Total process times taken to reach F0 values of 7, 8 and 9 min for Rohu-Kalia were 37.50, 41.70 and 44.50 min, respectively (Table 2). These process times were sufficient to get commercially sterile products. It was observed from the results that as F0 value increased, total process time also increased proportionally. Cook value represents the extent of cooking of the product. The cook values (CV) for the Rohu-Kalia were 67.21, 66.01 and 70.59 min, when the samples were processed at F0 value of 7, 8 and 9 min, respectively (Table 2). A slight decrease of cook value in case of fish processed at F0 value of 8 than that of F0 value of 7 was observed and this may be due to less come-up-time in case of later since both are interrelated. Heating rate index (fh) depends on the rate of heat transfer into the product and also the extent of heat treatment. The fh value for F0 7, 8 and 9 min was 18.60, 21.50 and 24.50 min, respectively. The observed fh values also indicate that the heat penetration was by both convection and conduction heating. Since the U value is the number of minutes for sterilization at the retort temperature, fh/U decreased with increasing F0 value. Heat penetration pattern of thermally processed Rohu-Kalia preparation in retort pouch processed at F0 7, 8 and 9 min are shown in Figs. 2, 3 and 4.
Table 2.
Heat penetration characteristics of Rohu fish curry in retort pouch in three different F 0 values at process temperature of 121.1 °C
| Temperature parameter | F07 | F08 | F09 |
|---|---|---|---|
| F0 value | 7.18 | 8.14 | 9.13 |
| Jh | 1.45 | 1.33 | 1.39 |
| Jc | 1.12 | 1.18 | 1.02 |
| fh | 18.60 | 21.50 | 24.50 |
| U | 7.25 | 9.12 | 11.42 |
| fh/u | 2.56 | 2.36 | 2.14 |
| g | 1.12 | 0.96 | 1.27 |
| B | 33.44 | 36.48 | 39.28 |
| CUT | 7.00 | 9.00 | 9.00 |
| TPT | 37.50 | 41.70 | 44.5 |
| Cook value | 67.21 | 66.01 | 70.59 |
Where fh = slope of heating curve; Jh = lag factor of heating; Jc = lag factor of cooling; U = time in minutes for sterilization at retort temperature; g = final temperature deficit; B = Ball’s process time; CUT = retort come up time; TPT = total process time
Fig. 2.
Heat penetration pattern, cook value and F0 value of Rohu in curry medium processed to F0 7 min [RT = retort temp., CT = product core temp., CV = cook value]
Fig. 3.
Heat penetration pattern, cook value and F0 value of Rohu in curry medium processed to F0 8 min [RT = retort temp., CT = product core temp., CV = cook value]
Fig. 4.
Heat penetration pattern, cook value and F0 value of Rohu in curry medium processed to F0 9 min [RT = retort temp., CT = product core temp., CV = cook value]
Texture profile analysis (TPA)
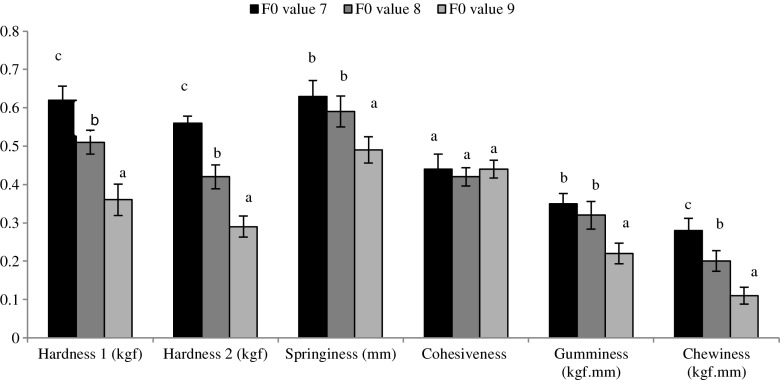
The results of TPA of Rohu fish in curry processed at F0 7, 8 and 9 min are shown in Fig. 5. The hardness 1 for F0 7, 8 and 9 min was 0.62 ± 0.04 kgf, 0.51 ± 0.03 kgf and 0.36 ± 0.04 kgf respectively. In case of hardness 2, it was 0.56 ± 0.02 kgf, 0.42 ± 0.03 kgf and 0.29 ± 0.03 kgf for F0 7, 8 and 9 min respectively. It is observed from the result that the hardness decreased as F0 values increased (p < 0.05). This may be due to the effect of prolonged heat treatment on breakdown of connective tissue protein leading to softness of the muscle. The springiness value for thermally processed Rohu at F0 7, 8 and 9 min was 0.63 ± 0.04 mm, 0.59 ± 0.04 mm and 0.49 ± 0.04 mm respectively. The springiness value which is the rate at which a deformed material recovers to its undeformed condition after the deforming force is removed also showed the same trend as hardness. The cohesiveness, which is the extent to which food can be deformed before it ruptures was estimated as 0.44 ± 0.04, 0.42 ± 0.03 and 0.44 ± 0.03 for thermally processed Rohu at F0 7 min, 8 min and 9 min respectively and showed no significant differences (p > 0.05) when F0 increased from 7 to 9 min. The gumminess value was found to be 0.35 ± 0.03, 0.32 ± 0.04 and 0.22 ± 0.03 respectively for thermally processed Rohu at F0 7, 8 and 9 min and showed a decreasing trend as F0 values increased. Although, gumminess is not an important textural attribute in this type of product, but it alongwith hardness and springiness determines the mouthfeelness of fish products. Similar trend was observed in case of chewiness value for Rohu curry thermally processed at F0 7, 8 and 9 min and was recorded (p < 0.05) as 0.28 ± 0.03 kgf.mm, 0.20 ± 0.03 kgf.mm and 0.11 ± 0.02 kgf.mm respectively. These decreasing trends of texture profiles were mainly due to the increase in the heat treatment. Gelatinization of connective tissue protein upon prolonged heat treatment may be responsible for this. This may be because of denaturation of protein and destruction of muscle cells during thermal processing (Kugino and Kugino 1994; Sreenath et al. 2006).
Fig. 5.
Texture profile (TPA) of Rohu in curry medium processed to three different F 0 values. Bars represent average ± standard deviation of at least three observations. Bars showing different superscripts (a-c) significantly different (p < 0.05) with respect to different Fo values
Analysis of colour
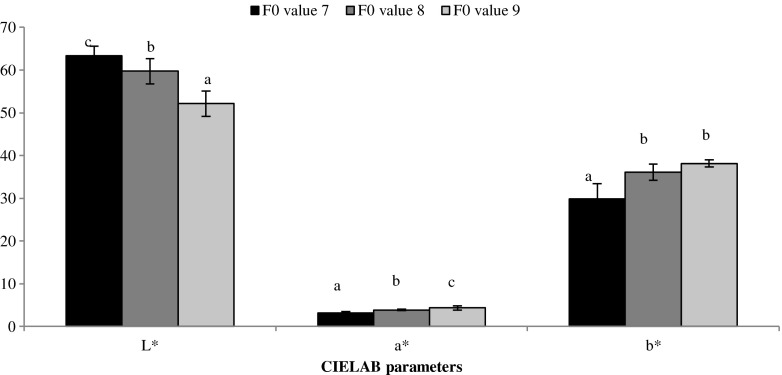
The changes in the colour parameters during the thermal processing of Rohu in curry medium to different F0 values are shown in Fig. 6. The L* value (lightness) was 61.81 ± 0.25, 58.99 ± 0.82 and 56.60 ± 0.96 for curry of Rohu fish thermally processed to F0 7, 8 and 9 min respectively. Whereas, in the case of a* value (green to red), it was 2.82 ± 0.17, 3.39 ± 0.28 and 4.09 ± 0.22 for curry of Rohu fish processed at F0 7, 8 and 9 min respectively. The b* value (blue to yellow) was recorded as 30.74 ± 1.5, 35.14 ± 0.56 and 37.61 ± 0.47 for F0 7, 8 and 9 min respectively. From the figure, it was observed that there was a decreasing trend for L* value (p < 0.05), whereas increasing trends for a* (p < 0.05) and b* values with increase in the F0 values. This may be due to the effect of prolonged heat treatment during retort processing, which changed the colour of the fish from lighter to darker.
Fig. 6.
Colour profile of Rohu in curry medium processed to three different F 0 values. Bars are represented as average ± standard deviation of at least three observations. Bars bearing different superscripts (a, b, c, etc.) significantly different (p < 0.05) with respect to different Fo values
Sensory analysis
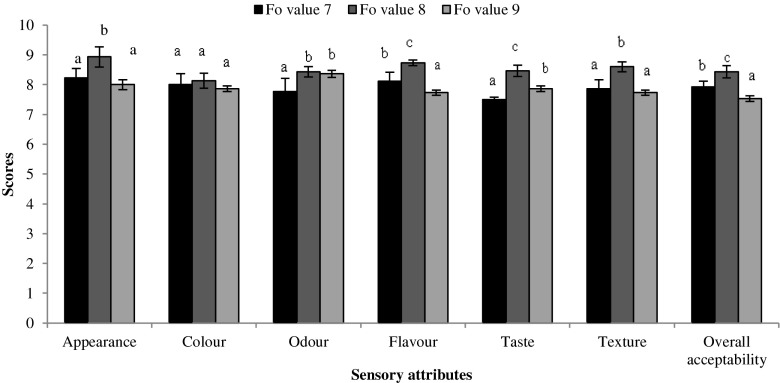
Curry of Rohu fish with potato and peas processed to three different F0 values were evaluated by 7 trained sensory panelists. The results of the sensory analysis are presented in Fig. 7. The sensory score given by the panel for appearance was 8.20 ± 0.63, 8.70 ± 0.48 and 8.50 ± 0.71 respectively for thermally processed Rohu fish at F0 7, 8 and 9 min. The colour parameter was 8.00 ± 0.47, 8.60 ± 0.56 and 8.30 ± 0.67 for F0 7, 8 and 9 min respectively. In case of flavour, panelists scored 8.10 ± 0.78, 8.50 ± 0.53 and 8.20 ± 0.67 for processed Rohu fish at F0 values 7, 8 and 9 min respectively. It was observed from the above result that there was a slight increase in colour and flavour (p < 0.05) parameters with increase in the F0 values from 7 to 8 min, and both the parameters decreased at F0 value 9 min. Similar trend in observation was given by the panellists in regards to odour. Taste, the combined sensation of flavour and texture was recorded as 8.00 ± 0.82, 8.70 ± 0.48 and 8.40 ± 0.52 for Rohu curry processed at F0 values 7, 8 and 9 min respectively. The cumulative effect of all sensory parameters, i.e., the overall acceptability was scored highest by the panellists for the Rohu curry processed at F0 value 8 min.
Fig. 7.
Sensory evaluation of Rohu in curry medium processed to three different F 0 values. Bars are represented as average ± standard deviation of at least three observations. Bars bearing different superscripts (a, b, c, etc.) significantly different (p < 0.05) with respect to different Fo values
The result indicated that prolonged heating affected both colour and flavour of the product and these increased upto certain extent of heating. Both the instrumental and sensory analysis also revealed that more the time the product was exposed to heating, there were more changes in native proteins like denaturation, coagulation, oxidation etc. and the combined effect of all of those determined the organoleptic quality of the product. On the basis of organoleptic evaluation, the texture of the Rohu-Kalia scored highest when processed at F0 value of 8 min. Cooking affects the muscle firmness and texture of the final products (Ma et al. 1983). Although not determined in this study, the expected shelf-life for such thermally processed product is usually more than one year.
Conclusion
The sensory score given by panelists for the Rohu curry processed at different F0 values indicated that the fish curry processed at F0 8 min was of prime quality. Since the Rohu fish curry (Rohu-Kalia) processed at different F0 values were proven commercially sterile (since passed commercial sterility test) which indicates that the thermal process given was sufficient to attain sterility. The result of this study optimized the F0 value 8 min for a specialized preparation of Rohu fish (Rohu-Kalia) using retortable pouches.
Acknowledgments
Authors are thankful to the Ministry of Food Processing Industries, Govt. of India, New Delhi for providing financial assistance for this research project. The technical assistance provided by all technical staff of the Dept. of Fish Processing Technology & Engineering, College of Fisheries (CAU), Lembucherra, Tripura (India) is gratefully acknowledged.
Footnotes
Practical application
Rohu is a commercially important Indian major carp with white flesh and medium fat content, which offers an ideal choice as raw material for the development of ready to serve fish products such as fish curry in retort pouches for both domestic and international markets. Thermal processing optimized for ready to eat popular East Indian style Rohu fish curry ‘Kalia’ at F0 value of 8 min was found satisfactory to the panellists. The process thus optimized could be used as a protocol for commercial production of this kind of product.
References
- Aggelousis G, Lazos ES. Fatty acid composition of the lipids from eight freshwater fish species from Greece. J Food Comput Anal. 1991;4:68–72. doi: 10.1016/0889-1575(91)90049-C. [DOI] [Google Scholar]
- Ali AA, Sudhir B, Gopal TKS. Effect of rotation on the heat penetration characteristics of thermally processed tuna in oil in retort pouches. Int J Food Sci Technol. 2005;40:1–5. doi: 10.1111/j.1365-2621.2004.00905.x. [DOI] [Google Scholar]
- Ali AA, Sudhir B, Gopal TKS. Effect of heat processing on the texture profile of canned and retort pouch packed oil sardine (Sardinella longiiceps) in oil medium. J Food Sci. 2005;70(5):350–354. doi: 10.1111/j.1365-2621.2005.tb09990.x. [DOI] [Google Scholar]
- AOAC . Official methods of analysis. 17. Virginia: Association of Official Analytical Chemists; 2000. [Google Scholar]
- Bindu J, Gopal TKS, Unnikrishnan NTS. Ready-to-eat mussel meat processed in retort pouches for the retail and export market. Packag Technol Sci. 2004;17:113–117. doi: 10.1002/pts.637. [DOI] [Google Scholar]
- Bourne MC. Texture profile analysis. Food Technol. 1978;22:62–66. [Google Scholar]
- Caine WR, Aalhus JL, Best DR, Dugan MER, Jeremiah LE. Relationship of texture profile analysis and Warner-Bratzler shear force with sensory characteristics of beef rib steaks. Meat Sci. 2003;64:333–339. doi: 10.1016/S0309-1740(02)00110-9. [DOI] [PubMed] [Google Scholar]
- Chen TS, George WZ. Ascorbic acid retention in retort pouched green beans. J Food Sci. 1981;46:6423. [Google Scholar]
- Cheret R, Chapleau N, Delbarre-Ladrat C, Verrez-Bagnis V, De Lamballerie M. Effect of high pressure on texture and microstructure of sea bass (Dicentrarchus labrax L) fillets. J Food Sci. 2005;70(8):E477–E483. doi: 10.1111/j.1365-2621.2005.tb11518.x. [DOI] [Google Scholar]
- Chia SS, Baker RC, Hotchkiss JH. Quality comparison of thermo-processed fishery products in cans and retortable pouches. J Food Sci. 1983;48:1521–1525. doi: 10.1111/j.1365-2621.1983.tb03529.x. [DOI] [Google Scholar]
- Connell JJ, Shewan JM. Sensory and non sensory assessment of fish. In: Connell JJ, editor. Advances in fish science and technology. England: Fishing New Books Ltd; 1980. pp. 56–65. [Google Scholar]
- Durance TD, Collins LS. Quality enhancement of sexually mature Chum Salmon (Onchorhynchus keta)in retort pouches. J Food Sci. 1991;56(5):1282–1286. doi: 10.1111/j.1365-2621.1991.tb04753.x. [DOI] [Google Scholar]
- Frott R, Lewis AS (1994) Canning of meat and fish products. In: Chapman and Hall (eds), London, pp 200–202
- Goldfarb PL. Pouch for low acid foods. Modern Packag Part 1. 1970;43(12):70–76. [Google Scholar]
- Gopal TKS, Vijayan PK, Balachandran KK, Madhavan P. Heat penetration of fish curry in retort pouch. In: Balachandran KK, Iyer TSG, Joseph J, Perigreen PA, Raghunath MR, Varghese MD, editors. Advances and priorities in fisheries technology. Cochin: Society of Fisheries Technologists (India); 1998. pp. 236–241. [Google Scholar]
- Gopal TKS, Vijayan PK, Balachandran KK, Madhavan P, Iyer TGS. Traditional Kerala style fish curry in indigenous retort pouch. Food Control. 2001;12:523–527. doi: 10.1016/S0956-7135(01)00058-5. [DOI] [Google Scholar]
- Hu KH, Nelson A, Legault RR, Steinberg MP. Feasibility of using plastic film packages for heat processed foods. Food Technol. 1955;19(9):236–240. [Google Scholar]
- IS: 6273 [II] (1971) Indian standard guide for sensory evaluation of foods (Part II, methods and evaluation cards). Indian Standard Institute: New Delhi, India
- Jarvis ND. Canning “little tuna” (Euthynnus alletteratus) Food Technol. 1952;6(3):113–117. [Google Scholar]
- Karel M, Fennema OR, Lund DB. Principles of food science. Vol. II. New York: Marcel Dekker; 1975. p. 485. [Google Scholar]
- Karmas E, Lauber E. Novel products from underutilized fish using combined processing technology. J Food Sci. 1987;52:7–9. doi: 10.1111/j.1365-2621.1987.tb13962.x. [DOI] [Google Scholar]
- Kugino M, Kugino K. Microstructural and rheological properties of cooked squid mantle. J Food Sci. 1994;59:792–796. doi: 10.1111/j.1365-2621.1994.tb08129.x. [DOI] [Google Scholar]
- Lampi RA. Flexible packaging for thermo-processed foods. Adv Food Res. 1977;23:306–426. [Google Scholar]
- Lazos ES. Freshwater nase (Chondrostoma nasus): thermally processed as a potential food source. J Aquat Food Prod Technol. 1997;6:45–63. doi: 10.1300/J030v06n02_05. [DOI] [Google Scholar]
- Ma LY, Deng JC, Ahed EM, Adams JP. Canned shrimp texture as function of its heat history. J Food Sci. 1983;48(2):360–363. doi: 10.1111/j.1365-2621.1983.tb10743.x. [DOI] [Google Scholar]
- Mallick AK, Gopal TKS, Ravishankar CN, Vijayan PK. Canning of rohu (Labeo rohita) in North Indian style curry medium using polyester coated tin free steel cans. Food Sci Technol Int. 2006;12(6):539–545. doi: 10.1177/1082013206073046. [DOI] [Google Scholar]
- Mermelstein NH. Retort pouch earns 1978 IFT food technology industrial achievement award. Food Technol. 1978;32(6):22–33. [Google Scholar]
- Nowsad A, Khan AH, Kamal M, Kanoh S, Niwa E. The effects of heating and washing on the gelling properties of tropical major carp muscle. J Aquat Food Prod Technol. 1999;8(2):5–23. doi: 10.1300/J030v08n02_02. [DOI] [Google Scholar]
- Panifield MA, Campbell AM 1990. Evaluating food by objective methods. In: Experimental food science, (3rdedn), Academic Press, New York, pp 23–50
- Ranganna S. Handbook of canning and aseptic packaging. New Delhi: Tata McGraw-Hill Publishing Co. Ltd; 2002. pp. 507–508. [Google Scholar]
- Ravishankar CN, Gopal TKS, Vijayan PK. Studies on heat processing and storage of seer fish curry in retort pouches. Packag Technol Sci. 2002;15:3–7. doi: 10.1002/pts.560. [DOI] [Google Scholar]
- Sanchez-Brambila GY, Lyon BG, Huang YW, Lyon CE, Gates KW. Sensory characteristics and instrumental texture attributes of abalones, Haliotis, Fulgensand Cracherodii. J Food Sci. 2002;67(3):1233–1239. doi: 10.1111/j.1365-2621.2002.tb09483.x. [DOI] [Google Scholar]
- Sreenath PG, Martin XKA, Ravishankar CN, Bindu J, Gopal TKS. Standardisation of process parameters for ready-to-eat squid masala in indigenous polymer-coated tin-free steel cans. Int J Food Sci Technol. 2006;42:1148–1155. [Google Scholar]
- Stumbo CR. Thermobacteriology in food processing. 2. New York: Academic Press Inc; 1973. [Google Scholar]
- Szczesniak AS. Texture is a sensory property. Food Qual Prefer. 2002;13:215–225. doi: 10.1016/S0950-3293(01)00039-8. [DOI] [Google Scholar]
- Tarladgis GB, Watts MB, Younathan TM. A distillation method for the quantitative determination of malonaldehyde in rancid foods. J Am Oil Chem Soc. 1960;37:44–50. doi: 10.1007/BF02630824. [DOI] [Google Scholar]
- Vijayan PK. Report on training program on retort pouch processing of fish and fish analysis at tropical development and research institute and METAL Box (R & D), UK. Cochin: Central Institute of Fisheries Technology; 1984. [Google Scholar]
- York RK, Sereda LM. Sensory assessment of quality in fish and seafoods. In: Shahidi F, Botta JR, editors. Seafoods: chemistry, processing technology and quality. London: Chapman & Hall; 1994. pp. 233–262. [Google Scholar]


