

Abstract
Finding optimal dosing strategies for treating bacterial infections is extremely difficult, and improving therapy requires costly and time-intensive experiments. To date, an incomplete mechanistic understanding of drug effects has limited our ability to make accurate quantitative predictions of drug-mediated bacterial killing and impeded the rational design of antibiotic treatment strategies. Three poorly understood phenomena complicate predictions of antibiotic activity: post-antibiotic growth suppression, density-dependent antibiotic effects, and persister cell formation. Here, we show that chemical binding kinetics alone are sufficient to explain these three phenomena, using single cell data and time-kill curves of Escherichia coli and Vibrio cholerae exposed to a variety of antibiotics in combination with a theoretical model that links chemical reaction kinetics to bacterial population biology. Our model reproduces existing observations, has a high predictive power across different experimental setups (R2= 0.86), and makes several testable predictions, which we verified in new experiments and by analysing published data from a clinical trial on tuberculosis therapy. While a variety of biological mechanisms have previously been invoked to explain post-antibiotic growth suppression, density-dependent antibiotic effects, and especially persister cell formation, our findings reveal that a simple model which considers only binding kinetics provides a parsimonious and unifying explanation for these three complex, phenotypically distinct behaviours. Current antibiotic and other chemotherapeutic regimens are often based on trial-and-error or expert opinion. Our ‘chemical reaction kinetics’-based approach may inform new strategies, that are based on rational design.
Introduction
Although antibiotics have been used in medicine for more than 70 years, a clear mechanistic understanding of how these agents influence microbial populations in the host and how their concentration affects their activity (i.e. antibiotic pharmacodynamics) has not yet been achieved. The pharmacodynamics of antibiotics have been difficult to predict even in simple settings such as the growth of Escherichia coli in vitro. In addition, the large number of possible regimens makes it nearly impossible to test optimal dosing intervals, dose levels and treatment duration in clinical settings (1, 2).
While less frequent dosing may promote patient adherence to treatment (3), antibiotics must be provided with sufficient frequency to clear pathogens. Identifying the optimal dosing frequency is challenging; for example, in the maintenance phase of tuberculosis therapy, it is currently unclear if intermittent therapy is inferior to daily therapy (4–6). Predictions of optimal dosing intervals are complicated by the fact that for some bacteria/antibiotic combinations, bacterial growth remains suppressed after removal of the antibiotic. This ‘post-antibiotic effect’ is not easily predicted, and has generally been attributed to bacterial stress responses induced by exposure to antibiotics (7, 8).
A second challenge for optimizing antibiotic therapy is the need to identify dose levels that reliably clear the infection. Several recent clinical studies have been designed to address the impact of different antibiotic concentrations on patient outcome (9, 10). Predictions of optimal dose levels are complicated by the fact that, for some bacteria/antibiotic combinations, the dose necessary for bacterial killing can depend on initial bacterial density (11). This ‘inoculum effect’ is again not easily predicted and has been attributed to various mechanisms including density-dependent bacterial communication (12), drug degrading enzymes (13) and/or differences in bacterial metabolic states at different densities (14). Commonly used measures of bacterial susceptibility such as minimum inhibitory concentration (MIC) can vary with bacterial density (11), so translating a MIC established at a specific bacterial density (15, 16) into a recommended dosing level may not produce optimal treatment outcomes.
In many bacterial infections, the treatment duration necessary to prevent relapse is unclear (17–21). Excessively long treatment risks increased toxicity, incurs unnecessary costs, and may accelerate the emergence of resistance (22). Predictions of optimal treatment duration are complicated by the fact that some bacteria exhibit persistence under antibiotic pressure; this phenomenon is defined as a slowing of antibiotic-mediated bacterial killing over time, and occurs in the absence of mutation-mediated resistance. A large number of mechanisms to explain the generation of “persister” cells have been proposed, but the biological basis of persistence remains an ongoing controversy in microbiology (23–35). Given the relationship of persistence to treatment duration, the inability to reliably predict persistence has challenged efforts to identify optimal lengths of antibiotic therapy.
Here we provide a simple mathematical model that links chemical reaction kinetics to bacterial population biology and provides a coherent explanation for the post-antibiotic effect, inoculum effect and persistence. This model describes the reaction between antibiotic and target molecules and the resulting effects on bacterial growth and death. The central principle informing this multi-scale model is that bacterial growth slows and/or death increases as a function of the fraction of free target.
Results
Post-antibiotic effect
In earlier work (36), we observed a pronounced post-antibiotic effect in single E. coli cells at sub-MIC concentrations of tetracycline. We therefore investigated post-antibiotic growth suppression by observing elongation and replication of single E. coli cells in microfluidic chambers. E. coli cells were grown in complex media without antibiotics for at least four hours to measure baseline rates of replication. This was followed by drug exposure for 16 hours. The media was then switched back to drug-free broth for at least four more hours. For bacteria challenged with sub-inhibitory concentrations of the bacteriostatic drug tetracycline (Fig. S1, Movie S1), we observed slower growth, but no bacterial death (as defined by either lysis or failure to resume both elongation and replication in the post-antibiotic phase). The suppression of replication in living cells lasted several hours longer than antibiotic exposure (Fig. 1).
Fig. 1. Post-antibiotic effect observed with single-cell microscopy and model fit.

Time-lapse microscopy of single-E. coli cells observed (imaging rate: 1/5 minutes) during and after a 16 h exposure to two concentrations: 22 cells at 6.25 mg/L (0.4 MIC) (A) and 27 cells at 12.5 mg/L (0.8 MIC) (B) of tetracycline, corresponding to 0.4 and 0.8 MIC, respectively. The solid black line indicates the mean growth rate of the observed bacterial population, the dotted blue lines indicate the minimal and maximal observed growth rate. The model used to fit the data is described in equation (2) in supplementary materials and methods. Kinetic parameters are derived from literature cited in table S2.
We used the previous finding that after exposure to sub-inhibitory concentrations of translation inhibitors such as tetracycline, bacterial growth rate depends linearly on the fraction of free ribosomes (37) to link bacterial replication to intracellular reaction kinetics in our bacteriostatic model (equation (2) & Methods). We then used this model parameterized with in vitro binding data for tetracycline to ribosomes to fit nonspecific binding rates, the critical replication threshold and diffusion into the cytosol. From our fit, we estimated the following free parameters: net diffusion through inner and outer cell membrane p= 2×10-11 m/s, critical fraction of free ribosomes fc= 2.6%, and nonspecific association rate ku,f= 50 and nonspecific dissociation rate ku,r= 0.99. Note that each of these parameters aggregates several different processes, and does not directly translate into a single chemical process. The model reproduced observed patterns of post-antibiotic growth suppression at each tetracycline concentration, suggesting that the kinetics of antibiotic-target binding are sufficient to explain this effect (Fig. 1). Two mechanisms likely underlie this phenomenon: i) antibiotic-target complexes do not dissociate immediately and intracellular antibiotic molecules only slowly diffuse across the cell membrane and ii) antibiotic molecules bound non-specifically with low affinity are released when the intracellular antibiotic concentration drops and can then bind preferentially to specific binding sites. Together, these processes extend the time before bacteria resume growth after antibiotic removal. Here, we assume that each daughter cell inherits on average one half of the bound molecules of the mother cell. Thus, as soon as the fraction of bound antibiotics drops sufficiently to allow slow replication, new free target molecules are produced and the total fraction of bound targets decreases exponentially. This leads to a rapid increase of the replication rate after post-antibiotic growth suppression.
Our model reproduces the concentration-dependence of the post-antibiotic effect observed in (38, 39), compare figure 1A and 1B. This is because more antibiotic is bound both specifically and nonspecifically at higher concentrations. Additionally, our model offers an explanation for why most antibiotics, with the notable exception of beta-lactams, exhibit a post-antibiotic effect that is more pronounced in vivo than in vitro (40). Usually, bacteria replicate more slowly in vivo than in vitro. As described above, reproduction of target molecules by replication accelerates the restoration of baseline growth rates. Thus, our model predicts that slower replication is associated with a more pronounced post-antibiotic effect (Fig. S2).
Inoculum effect
We next used parameters obtained from our model fit to these single-cell data to predict bacterial growth in batch cultures starting from different initial bacterial densities and exposed to different tetracycline concentrations. The model achieved an excellent fit (adj. R2= 0.86, Fig. 2A-C) for growth suppression at 12 initial bacterial densities and seven antibiotic concentrations (each measured in triplicate). Thus, our model predicts that the efficacy of tetracycline for suppressing growth depends on the initial bacterial density. We repeated the same experiment for four additional antibiotics with E. coli and six antibiotics with V. cholerae (methods; Table S1). In each case, antibiotic action declined with increasing bacterial density. Our model predicts this effect because the antibiotic is not an unlimited resource, and the pool of free antibiotic is depleted as more target molecules are bound.
Fig. 2. Influence of bacterial density on antibiotic efficacy.
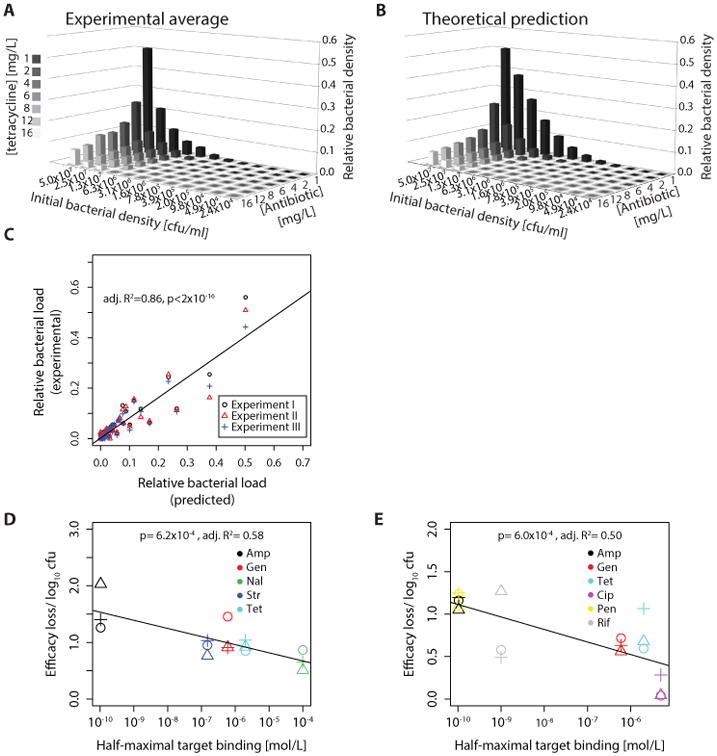
These graphs show the relative bacterial population size over 12h with different tetracycline concentrations as compared to growth in absence of antibiotics. (A) E. coli were grown in microtiter plates with different initial densities and exposed to different tetracycline concentrations (the MIC is 2 mg/L); the graph shows relative population size in presence vs absence of antibiotic. The average of three independent experiments is shown. (B) Model prediction using parameters from single cells; (C) Predictive power of model. The y-axis shows the average bacterial density over 12 h as observed by turbidity measurements in microtiter plates. Bacterial cultures with different initial densities were exposed to varying concentrations of tetracycline (Fig. 2A). The x-axis shows the theoretical prediction derived from our model parameterized with known binding data and the parameter estimates from fitting the model to single-cell data (Fig. 1A&B). (D) Correlation between strength of inoculum effect (efficacy loss/ log10 bacteria) and drug-target affinity (half-maximal target binding) in E. coli. For details see supplementary materials and methods, “Quantification of inoculum effect”. The experimental setup was the same as in (A). (E) Same as in (D) for Vibrio cholerae. (Amp: Ampicillin; Gen: Gentamicin; Nal: Nalidixic Acid; Str: Streptomycin; Tet: Tetracycline; Cip: Ciprofloxacin; Pen: Penicillin; Rif: Rifampicin).
While we observed an inoculum effect for all tested antibiotics with both V. cholerae and E. coli, the magnitude of this effect differed. We hypothesized that the size of this effect is a function of differences in drug-target affinity. The tighter a drug binds its target, the lower the antibiotic concentrations needed to achieve sufficient binding. The fractional change in drug availability upon binding of target molecules should therefore increase with drug-target affinity. Accordingly, the model predicts that the size of the inoculum effect will depend on affinity. We tested this prediction by correlating the drug concentration needed to bind 50% of the target molecules to the strength of the inoculum effect (defined in Methods). Consistent with this prediction, for each bacterial species, we observed a significant correlation (linear regression, E. coli: p= 6.2×10⁻⁴, adj. R2= 0.58; V. cholerae: p= 6.0×10⁻⁴, adj. R2= 0.50) between affinity and the magnitude of the inoculum effect (Fig. 2D&E). An additional factor influencing the strength of the inoculum effect may be the strength of off-target binding, but this remains to be investigated.
Persistence
For many antibiotic/bacteria pairs, the rate of bacterial killing declines over time. The decreased susceptibility of the persistent subpopulation cannot be explained by inherited differences, since the same pattern is observed when the persisting cells are isolated, re-grown and again exposed to antibiotics. Rather, persistence has usually been interpreted as evidence of two phenotypically distinct bacterial subpopulations: a majority population that is killed quickly and a persistent subpopulation that declines more slowly (24). Implicit in this explanation of persistence is that the kill rate for each subpopulation, although different from each other, remains constant over time such that each subpopulation is expected to decline exponentially during treatment.
Balaban et al. (23) developed a model to describe persistence in ampicillin treated E. coli in which they assume a distinct subpopulation of tolerant bacteria that switch randomly between susceptibility and persistence. This model predicts that the level of persistence will be independent of the drug concentration (Fig. 3) because the rate of switching limits the rate of bacterial killing such that higher antibiotic doses do not produce additional killing. Analysis of experimental data derived from Regoes et al. (41) (Fig. S3) confirms concentration-independent persistence for some antibiotics, including ampicillin, which was investigated with the original model from Balaban et al. (23). However, in contrast to these examples, we found that out of the five antibiotics we tested, there was a strong correlation between persistence and antibiotic concentration for both streptomycin (p= 0.012, adj; R2= 0.78) and ciprofloxacin (p= 0.011, adj; R2= 0.70), a phenomenon that is not consistent with the model of Balaban et al.
Fig. 3. Model of persistence as tolerant subpopulations with phenotypic switch compared to alternative model.

| (10) |
We investigated whether our model, which considers the reaction kinetics of antibiotics with their targets could explain lag-phases and concentration dependent persistence. When E. coli is exposed to inhibitory concentrations of streptomycin, a bactericidal antibiotic that targets ribosomes and one of the antibiotics with concentration-dependent persistence, replication ceases rapidly (Fig. S4, Movie S2). This fast killing allows us to ignore growth during this phase and approximates a kill curve by only following the time to death for individual cells. By simplifying the problem, we can create a model that facilitates conceptual understanding of the involved mechanisms and how its predictions are influenced by parameter changes. We use the MIC determined for figure S4 and data on intracellular ribosomal concentration measured in E. coli (42), which follow a normal distribution with 15.8% variance (Fig. 4A, Shapiro-Test for a departure from the normal distribution was not significant). Streptomycin leads to the production of aberrant proteins, which accumulate and ultimately kill the cell, potentially by damage of membrane integrity (43, 44). Therefore, we assume here a toxic mechanism of bacterial killing where the cells die when a threshold of bound target is exceeded (see methods). To define the threshold of how many ribosomes have to be bound by the antibiotic to cause cell death (tc), we determined the number of bound targets in equilibrium at the MIC for the cell with the lowest ribosomal content. This cell is least susceptible because the intracellular concentration of target is lowest and therefore the required threshold will be reached latest (equation (5), supplementary materials and methods). In the simplest case, this system is described by following only the reaction of antibiotic molecules with targets. With this model, the kill curves predicted from the measured distribution in ribosomal content do not exhibit a log-linear decay, but instead exhibit a concentration dependent convex curve (apparent multi-phasic kill curve) and a lag-phase (Fig. 4B). From a chemical kinetic perspective, a log-linear decay would only be expected if binding of a single target molecule were sufficient for bacterial killing, which is not realistic. If the binding of more than one target molecule is needed for bacterial killing, the onset of killing is delayed because bacterial killing can only start after sufficient target molecules are bound (Fig. S5). Experimental data suggest that many targets must be occupied for activity; for example, with some beta-lactams, >90 % of penicillin binding proteins are occupied at MIC (45–47). A delay in the onset of antibiotic action has been frequently observed for beta-lactam antibiotics (12, 48).
Fig. 4. A normal distribution of target molecules can lead to multiphasic bacterial killing.

(A) Histogram of intracellular ribosomal concentration as experimentally determined in E. coli. Raw data were obtained from (42). Normal distribution was not rejected by Shapiro-Test, the red line shows a normal distribution with mean and standard deviation obtained from the data. (B) Predicted killing over time for bacterial population measured in (A). Kinetic rates of streptomycin binding to ribosomes were taken from the literature (Table S3). Time of killing was calculated using equation (4). The colors indicate antibiotic concentrations relative to the MIC of E. coli MG1655. (C) Theoretical explanation of multiphasic kill curves. The dotted lines show the calculated equilibrium number of bound ribosomes for three different streptomycin concentrations. The solid lines show the time until a specific fraction of the target molecules is bound (equation (4), methods). Black: assumed killing threshold with a mean of 60% and variance of 10%. (D) and (E) These graphs show time-kill curves (E) resulting from a bimodal distribution of susceptibility ((D), compare to Fig S6). The MIC was calculated as the drug concentration that achieves binding of 99% of the cells at equilibrium (equation 5). The vertical lines in (D) indicate the equilibria at given multiples of the MIC (green= 1×MIC, yellow= 4× MIC, orange= 8×MIC, red= 32×MIC). The same colors are used in the resulting calculated time-kill curves of a simulated population of 105 bacteria in (E). Kinetic rates are the same as in (A)- (C). The main “peak” of the bimodal distribution in (D) corresponds to the normal distribution in Fig S6 A.
In our model, each cell is characterized by a threshold tc representing a critical amount of bound targets or toxic metabolites that elicit death (Fig. 4C). If the target molecule concentration (or, more general, susceptibility as characterized by the fraction of occupied target eliciting bacterial death) varies slightly, very large variations in the time to death can result. This is because the time until the critical fraction of bound targets is reached is not proportional to tc as the reaction slows down when the equilibrium fraction is approached (Fig. 4C). As tc nears this equilibrium fraction, the skew of the distribution of time to death for each cell increases. Accordingly, bacteria that die at slightly different thresholds of bound target will be killed much later than others, and these cells might be identified as ‘persisters’. In other words, even a narrow normal distribution in bacterial susceptibility attributable to stochastic variation in intracellular target concentration is expected to produce a highly skewed distribution of the expected time to kill in a bacterial population. In contrast to previous mathematical models, our model, which does not include a distinct tolerant subpopulation, predicts that persistence will be less pronounced at high antibiotic concentrations because the expected equilibrium of bound target molecules rises with the antibiotic concentration.
As described above, the prevalent explanation for persistence assumes two distinct subpopulations. We therefore employed our model to explore whether concentration-dependent persistence is conceptually incompatible with subpopulations or whether they are merely not needed to explain the phenomenon. Here, we interpret the term “subpopulation” as a bimodal distribution (i.e. two “peaks”) of a trait, in our case antibiotic susceptibility. In the majority population (larger peak), susceptible bacteria die even when only a low fraction of target molecules are bound, whereas in the persistent subpopulation (smaller peak), bacteria only die when a high percentage of their target molecules are bound. In contrast, we interpret a narrow normal distribution of the intracellular concentration of molecules (e.g. ribosomes) as stochastic variance around the mean. There are two possible scenarios: i) achieving a sufficient amount of bound target to kill the persistent subpopulation may be impossible. This situation may arise when toxicity or solubility limit the antibiotic concentration; in the case of figure 4D, the chemical equilibrium of bound target would then be between the two peaks. Because the antibiotic concentration can never be high enough to kill the less susceptible subpopulation, this results in concentration-independent persistence and corresponds to the classical model as proposed by (23). ii) If the maximal achievable concentration of the antibiotic is high enough that the fraction of bound target necessary to kill the less susceptible subpopulation can be reached, we observe concentration-dependent persistence. However, with a bimodal distribution of susceptibility, the kill curves exhibit a pronounced shoulder as first the more susceptible and then, after a delay, the less susceptible subpopulations are killed. Such a “bumpy” pattern of bacterial time-kill curves is not usually observed, thus a bimodal distribution of susceptibility seems a less feasible explanation than either the standard model or our alternative model (Fig. 4E, compare to figure S6).
We further illustrate concentration-dependent persistence with ciprofloxacin (Fig. 5A). To show the effects of bacterial growth during antibiotic exposure, we compare these results to a model that captures both bacterial growth and death (Fig. 5B). Again, we find concentration-dependent persistence as a result of slight variance in the number of target molecules. Cell-to-cell variation in the number of targets or down-stream effectors is almost certainly present (42, 49, 50). Since all bacteria must have the same number of targets for bacterial killing to be constant, a log-linear decay is not expected. Thus, we assert that a multiphasic kill-curve can be explained by chemical reaction kinetics alone when the intracellular concentration of target varies (even by as little as 2% standard deviation, Fig. S7).
Fig. 5. Modeling reproduces concentration-dependent persistence.

(A) Experimental time-kill curves of E. coli with different ciprofloxacin concentrations. The MIC is 8mg/L (Table S1). The experiment was performed in biologically independent triplicates (B) Numerical simulations of a model combining bacteriostatic and bacteriocidal effects (equations (7-10)) parameterized with in vitro kinetic parameters for ciprofloxacin binding. In the absence of known distributions of functional gyrase tetramers, we assume that the mean of this distribution is the average of the numbers given in the literature as cited in table S3. We assume a normal distribution in absence of more detailed information (60, 61) and that the standard deviation is the same as published for ribosomes.
Our model predicts that after an initial decline, the bacterial population may subsequently increase, even in the absence of resistance. This occurs because some cells are still able to replicate, increasing the total number of target molecules. Consistent with this prediction, we observed consistent outgrowth in experimental replicates (Fig. 5A). This re-growth was not due to resistance as the MIC of cells at the beginning of the experiment and of the cells remaining after 18h (Table S1) was unchanged.
To investigate whether our findings regarding concentration-dependent persistence can be translated to in vivo settings, we analyzed clinical trial data from tuberculosis patients treated with increasing doses of rifampicin (51) (Fig. 6A-C). Patients received rifampicin monotherapy for the first 14 days of treatment and then were switched to standard combination therapy. Again, we observe concentration-dependent persistence. In addition to variance in the intracellular molecule content of bacteria, antibiotic therapy in patients may lead to varying drug concentrations. There may be spatial variation of concentration in different target tissues as well as temporal variation of drug uptake. We modeled these differences using experimentally determined concentrations of rifampicin in the epithelial lining fluid of TB patients (52). We also assume that this concentration follows a normal distribution with a standard deviation as reported in patients receiving rifampicin (53). Again, we find concentration-dependent persistence (Fig. 6D). Conceptually, variances in drug concentration and the concentration of target molecules are very similar. Both shift the chemical equilibrium, and depending on the proximity of the threshold for killing tc to the chemical equilibrium, the reaction rate slows down.
Fig. 6. Concentration-dependent persistence in tuberculosis patients receiving increasing rifampicin dosages.

(A)-(C): Colony-forming unit counts of M. tuberculosis in sputum during treatment as reported in (51). Patients with previously untreated, smear-positive pulmonary tuberculosis due to drug-sensitive strains received 14 days initial monotherapy and then a standard multi-drug regimen. Sputum was collected overnight on two consecutive nights before treatment was started and then after 2, 4, 6, 8, 10, 12, and 14 days of the allocated regimen. Patients received (A) 5mg rifampicin/kg bodyweight, (B) 10mg rifampicin/kg bodyweight (rifampicin dosage in standard regimen), (C) 20mg rifampicin/kg bodyweight. (D) Calculated time-kill curves within patients (simulated population of 104 bacteria, equation (4) and (5)). The effective drug concentration in extracellular lining fluid was obtained from (52). The MIC for rifampicin in drug-susceptible strains was assumed to be 0.1 mg/L (62). The available drug concentration was assumed to follow a normal distribution with a 22.5% standard deviation (53).
We would therefore expect that not only higher antibiotic doses, but also other mechanisms that shift the chemical equilibrium to higher proportions of bound targets lead to decreased persistence - one such mechanism could be drugs with higher target affinity. While our findings do not disprove that distinct subpopulations can generate persistence (33, 54), our model demonstrates that chemical kinetics alone may account for multiphasic kill curves as well as concentration-dependent persistence.
Many biological mechanisms have been shown to underlie bacterial persistence (29), and we therefore investigated whether our model can reproduce persistence resulting from known molecular mechanisms. Interestingly, our model also offers an explanation for persistence caused by mechanisms not directly involved in target binding. Generally, any mechanism that increases the variance of antibiotic susceptibility (even if up- or downstream of target binding) in a bacterial population can lead to an increase of persister-like behavior at specific drug concentrations. A similar argument has been made for M. tuberculosis exposed to isoniazid (31).
We use isoniazid as an example to illustrate how variation in antibiotic pro-drug activation can lead to persistence. Mycobacterium tuberculosis persistence during therapy with isoniazid has been shown to decrease with increasing partial pressure of O2 (28), as well as increasing levels of the pro-drug activating enzyme KatG (31). Our model reproduces these findings (Fig. 7) and offers the following explanation: the catalase KatG requires O2 (Fig. 7A), such that the net reaction of INH activation depends linearly on the intracellular concentration of KatG and O2. This suggests that both increased levels of KatG and O2 can shift the chemical equilibrium, thereby reducing persistence (Fig. 7B). Note that a twofold increase of KatG has the same effect on the rate of pro-drug activation as a twofold increase of O2, and therefore increasing levels of KatG will reduce persistence as much as increasing oxygen supply. This prediction is in accordance with experimental results linking high KatG levels to reduced persistence (31).
Fig. 7. Model of isoniazid (INH) action and resulting kill curves.

(A) INH forms an NAD-adduct (red spheres) with a rate which depends on the enzyme KatG and O2 saturation. INH-NAD then reacts with its target InhA (blue crescents). (B) Time-kill curves resulting from calculating the expected time until 60% (with 10% standard deviation) of the target molecules are bound (simulated population of 106 bacteria, equation (6), methods). Black indicates the same intracellular oxygen content as in the cell-free experimental setup in (63), red 50% and green 25% O2 saturation. (C) Time-kill curves for variance in intracellularly available KatG by 30%, simulated population of 104 bacteria. All other parameters from (63). Black indicates the MIC for M. tuberculosis (28), red 2× MIC and green 3× MIC.
Concentration-independent persistence is in concordance with previous explanations and theoretical models. However, our model also offers a potential explanation for concentration-independent persistence. Here, we assume some cell-to-cell variation in the activation of isoniazid and confirm that variance in KatG levels can lead to persistence (31) (Fig. 7C). When the main sources of variance in the bacterial population are up- or downstream of drug-target binding such as in the case of prodrug-activation or autolysin activation (55), increasing the antibiotic dose has little effect on the least susceptible cells. In this case, our model predicts concentration-independent persistence. According to our model, we would expect this type of persistence to become less apparent when the concentration of reaction partners in the metabolic step with the greatest variance is increased (such as O2 in isoniazid activation, Fig. 7). Interestingly, our model reproduces the slow decline of mycobacterial populations over several days based on chemical kinetics of drug activation and binding alone. Thus, we can also explain persistence for very long timeframes up to several weeks.
Discussion
Currently, we do not have sufficient understanding of antibiotic action and pharmacodynamics to reliably predict antibacterial action and design rational treatment strategies. Our incomplete understanding of the post-antibiotic effect has hampered efforts to identify optimal dosing intervals, such as in the maintenance phase of tuberculosis therapy (4–6). Finding optimal dose levels is difficult without knowing how the inoculum effect might change bacterial susceptibility with increasing density (9–11). In nearly all bacterial infections, persister cells have challenged efforts to predict which treatment durations are sufficient to clear infections (20, 55).
Here, we have developed a highly intuitive theoretical framework, based on and fit to experimental data. Our model, which provides a multi-scale linkage between antibiotic chemical kinetics and bacterial population biology within hosts, makes only two, easily defendable assumptions: i) Replication decreases and/or killing increases when the fraction of bound target molecules rises, and ii) the intracellular concentration of molecules varies slightly (>1% standard deviation in a normal distribution) between bacteria in the same clonal population. Our model exhibits high predictive power and reproduces a series of phenomena that have typically been explained through unrelated biological mechanisms. Accordingly, this model may facilitate a more unified understanding of the relationship between drug-target binding kinetics and drug effects (Table 1). We note that our work does not disprove previous biological explanations of postantibiotic effect, inoculum effect, and persistence, but does challenge the implicit notion that biological mechanisms must underlie these complex phenomena.
Table 1.
Overview of phenomena with previous explanations and explanations suggested here.
| Phenomenon | Current explanations | Alternative explanation |
|---|---|---|
| Postantibiotic effect | Bacterial stress | Extended target occupancy due to transmembrane diffusion and unspecifically bound reservoir |
| Inoculum effect | Density-dependent growth stages, quorum-sensing | Reduced ratio of antibiotics/target at higher bacterial densities |
| Concentration-dependent persistence | Exposure to antibiotics at sub-MIC concentrations stimulates generation of persisters | Small variance in drug-target binding |
| Concentration-independent persistence | Phenotypic switch between persistent and “normal” populations | Small variance in processes up-or downstream of drug-target binding |
A better grasp of the mechanisms underlying post-antibiotic growth suppression would enable us to make better predictions regarding treatment frequency. In contrast to previous studies attributing the post-antibiotic effect to biological mechanisms (7, 8), we show here that it may be explained by chemical processes alone. Our modeling framework makes testable predictions regarding the strength of the post-antibiotic effect that may be used to design antibiotics that can be given less frequently. Based on our results, we would expect that i) tight drug-target binding, ii) difficulty in crossing the bacterial cell envelope and iii) possessing a large reservoir of nonspecifically bound drugs could prolong post-antibiotic growth suppression. However, the final two properties may have other repercussions: difficulties in crossing the bacterial cell envelope also would imply that the drug may not penetrate the bacteria in the first place, and a large amount of nonspecific binding sites make higher drug concentrations necessary.
Our model attributes the inoculum effect to the depletion of antibiotic molecules that occurs as they are bound to a large number of target molecules. We predict that the degree to which antibiotics lose their efficacy with changing bacterial concentrations depends on the strength of drug-target binding, and we were able to verify this theoretical prediction experimentally. Moreover, our model makes highly accurate predictions regarding antibiotic efficacy (R2= 0.86) even when calibrated and tested in very different experimental systems. Based on this model, we would predict that for antibiotics that bind their target very tightly, dose levels should be adjusted to the expected bacterial load in the target tissue.
A very large number of biological mechanisms underlying persistence have been described, but the nature and causes of persistence remain controversial (23–35). Commonly observed non-linear patterns of bacterial killing have been cited as evidence of a distinct subpopulation of persister cells in bacterial populations. However, our model leads us to conclude that a decline of bacterial killing over time is expected even in absence of special subpopulations, at least within a certain range of drug concentrations. This only requires small cell-to-cell variation in target molecules, drug concentration or molecules involved up-or downstream of drug-target binding, which is almost certain to be present.
Here, we distinguish between two types of non-linear bacterial killing: i) concentration-dependent persistence, where higher doses reduce the numbers of bacteria that are killed more slowly, and ii) concentration-independent persistence, where the time-kill curves converge at the end of the experiment and the bacterial population declines at the same slow rate independent of antibiotic dosage. When the main source of variance comes from reaction partners directly involved in drug-target binding, our model predicts concentration-dependent persistence. This would arise if the number of target molecules varies, as we show with published data for ribosomes (42). The same pattern would also result from variation in the local concentration of drugs, which we would expect in patients on treatment or when there is heterogeneity in drug-uptake or permeability in the bacterial population. Models for persistence that rely on distinct subpopulations of cells cannot easily explain concentration-dependent persistence, which we have observed in both in vitro and in clinical data.
While concentration-independent persistence is compatible with previous explanations and theoretical models of persistence, our model also offers an alternative explanation for this phenomenon. If there is strong variance in molecules up-or downstream of drug-target binding, we expect concentration-independent persistence.
Our aim here is not to disprove well-established mechanisms of persister-formation (23–35, 56, 57), but to caution against the assumption that multi-phasic kill curves provide evidence of distinct subpopulations of bacterial cells. It has recently been suggested that many different mechanisms rather than a single common one can lead to bacterial persistence and that therefore the generation of persisters is a generic feature of bacteria challenged with antibiotics (29). Our work supports this view in that it subsumes a large variety of mechanisms under the single concept of variance in cellular susceptibility, for example by variance in intracellular molecule content. If any of the previously reported mechanisms increases the variance in the intracellular concentration of any molecule involved in antibiotic-mediated killing, more persistence would result. If for example the down-stream mechanisms of antibiotic action are cell-cycle dependent and therefore susceptibility is dependent on active replication, our model would predict that a greater variance in replication rates would lead to increased persistence. Thus, our results are in concordance with the seminal paper by Balaban et al. (23).
Here, we have shown that even small variance in the number of targets, downstream effectors, and/or cellular susceptibility is sufficient to explain a multiphasic kill curve from a conceptual point of view and should thus be the expected response of bacterial populations upon exposure to finite quantities of antibiotic molecules. This prediction is testable experimentally by quantifying the distribution of intracellular molecular content in a bacterial population, as has been done before (31). We have analyzed published data from clinical trials in tuberculosis patients and find concentration-dependent persistence when following bacterial load in patients' sputum, which is consistent with our theoretical framework. Our work has direct implications for antibiotic therapy, as we predict that higher antibiotic doses, increasing drug-target affinity or the concentration of metabolites involved in drug action might aid in reducing persistence and thereby allowing for shortened antibiotic treatment courses. Recent work has shown that variance in intracellular molecule content contributes to persistence for cancer cells challenged with chemotherapeutic agents (58), a finding that is consistent with the results we report here.
Taken together, our reaction-kinetic model replicates complex patterns of antibiotic action that have typically been attributed to disparate biological mechanisms. This simple model successfully predicted antibiotic efficacy across different systems and made testable qualitative predictions that we subsequently verified experimentally. Our model may therefore offer a useful platform to generate new insights into the formulation of rational strategies not only for antibiotic use, but also for cancer chemotherapy.
Materials and Methods
A full description of the experimental methods and the mathematical modeling framework can be found in the supplementary materials and methods; a brief summary is given in the following.
Experimental Methods
The specific details of the microfluidic system used in this study have been described previously (36). E. coli MG1655 cells were grown in a flow of medium. After a brief baseline growth period without antibiotics, an antibiotic was added to the medium, followed by an antibiotic-free incubation time. Phase-contrast micrographs were acquired from different fields of view and cell size as well as division rates were analyzed with the MMJ plugin for ImageJ. Time-kill curves based on colony forming units (CFU) of E. coli MG1655 were performed in biologically independent triplicates as described previously (11, 59). For assessing the inoculum effect, bacterial growth was followed by turbidity measurements at 600 nm in microtiter plates. Antibiotic concentrations were chosen such that the highest concentration did not clear all bacterial densities and the lowest suppressed at least the lowest density.
Mathematical Model
Our mathematical model describes both the reaction between antibiotic and target molecules and the effects of this reaction on bacterial growth and death (Fig. 8, S8, methods and supplementary materials and methods). The central principle underlying this model is that bacterial growth (r) decreases and/or bacterial death (d) increases as a function the fraction of free target molecules; [A] represents the concentration of intracellular antibiotics, [T] the target, [AT] the drug-target complex, B the number of living bacteria and K the carrying capacity (Fig. 8B). We assume that bacteria have a set number of target molecules that may vary between individual bacterial cells. We investigated several mechanisms that underlie bacterial killing and growth suppression (Fig. 8C). In the simplest case, we ignore downstream processes and only describe antibiotic and target molecules: with kf and kr (0 in the case of irreversible reactions) the association and dissociation rates, respectively. If the target is intracellular, the antibiotic must first reach the target location, which we simplify in a single diffusion rate, p (Fig. 8A).
Fig. 8. Schematic of the model.

(A), (B) Model overview. A bacterial cell with target molecules, T (in this case ribosomes, blue crescents) and antibiotic molecules A (red circles) are shown. Antibiotics must diffuse through the bacterial cell envelope with a diffusion constant, p, in order to bind their targets with an association rate kf to form a complex AT, which may dissociate with a rate kr (0 for irreversible reactions). (C) Different mechanisms can lead to bacterial killing. Bacterial cells are shown as black oval, target molecules, are shown as blue crescents, and antibiotic molecules as red circles. (D) Chemical reactions of bacterial cells. For an explanation of the parameters see main text. The color of the reaction arrow is used to highlight the corresponding equations in equation (7) in the supplementary materials and methods.
Supplementary Material
Supplementary materials and methods.
Fig. S1. Analysis of single cell time-lapse microscopy data E. coli MG1655 cells exposed to tetracycline.
Fig. S2. Baseline growth rate affects length of post-antibiotic growth suppression.
Fig. S3. Time-kill curves of E. coli CAB1 exposed to five different classes of antibiotics in various concentrations.
Fig. S4. Analysis of single cell time-lapse microscopy data for E. coli MG1655 cells exposed to streptomycin.
Fig. S5. Simulated time-kill curves under different assumptions.
Fig. S6. Distribution of drug susceptibility and expected time-kill curve.
Fig. S7. Effect of variance in target molecule content.
Fig. S8. Overview of kill mechanisms, chemical reactions, and compartmental models used in this study.
Table S1. Ciprofloxacin persisting E. coli have not acquired higher resistance to the antibiotic.
Table S2. Antibiotic concentrations used for experiments.
Table S3. Kinetic parameters for different antibiotics.
Table S4. Explanation of variables and parameters.
Movie S1. Single cell microscopy data for E. coli MG1655 cells exposed to 12.5 mg/L tetracycline (0.8× MIC).
Movie S2. Single cell microscopy data for E. coli MG1655 cells exposed to 25 mg/L streptomycin (2× MIC).
Acknowledgments
We would like to acknowledge Amina Jindani, Roland Regoes and Somenath Bakshi for providing previously published raw data. We are grateful to Marc Lipsitch, Stavroula Hatzios and Tobias Dörr for critical reading and helpful comments.
Funding: This work was supported by Swiss National Science Foundation (www.snf.ch) grant PBEZP3_140163 and German Academic Exchange Service (www.daad.org) grant D/11/45747 (PzW), NIH U54GM088558 from the National Institute of General Medical Sciences and NIH DP2OD006663 from the Office of the Director (TC), Bill & Melinda Gates foundation grant OPP1111658 (TC and PAzW), Swiss Foundation for Grants in Biology and Medicine (www.samw.ch) grant PASMP3_142724 /1 (SA), NIH R37 AI-042347 from the National Institute of Allergy and Infectious Diseases (NIAID) and HHMI (MKW), Deutsche Forschungsgemeinschaft (DFG) grant MA 5320/ 1-1 (CM) and Swedish Research Council (VR) junior investigator grant #621-2012-3564 (KU). The content is solely the responsibility of the authors and does not necessarily represent the official views of the National Institute of General Medical Sciences or the Office of the Director of the National Institutes of Health. The funders had no role in study design, data collection and analysis, decision to publish, or preparation of the manuscript.
Footnotes
Author contributions: PzW conceived the idea and developed the mathematical modeling framework; PzW, SA and KU designed experiments; SA, SG and PO performed the experiments; JE and TH extended the modeling framework; CM and PzW derived analytical solutions; PzW, SA, KU and TC interpreted the results; PzW, SA, MKW and TC wrote the manuscript; TC, MKW and KU contributed material.
Competing Interests: The authors declare no competing interests.
References
- 1.Dooley KE, Mitnick CD, DeGroote MA, Obuku E, Belitsky V, Hamilton CD, Makhene M, Shah S, Brust JCM, Durakovic N, Nuermberger E. Old drugs, new purpose: retooling existing drugs for optimized treatment of resistant tuberculosis. Clin Infect Dis. 2012;55:572–581. doi: 10.1093/cid/cis487. [DOI] [PMC free article] [PubMed] [Google Scholar]
- 2.Drusano GL. Antimicrobial pharmacodynamics: critical interactions of “bug and drug”. Nat Rev Microbiol. 2004;2:289–300. doi: 10.1038/nrmicro862. [DOI] [PubMed] [Google Scholar]
- 3.Ingersoll KS, Cohen J. The impact of medication regimen factors on adherence to chronic treatment: a review of literature. J Behav Med. 2008;31:213–224. doi: 10.1007/s10865-007-9147-y. [DOI] [PMC free article] [PubMed] [Google Scholar]
- 4.Menzies D, Benedetti A, Paydar A, Martin I, Royce S, Pai M, Vernon A, Lienhardt C, Burman W. Effect of duration and intermittency of rifampin on tuberculosis treatment outcomes: a systematic review and meta-analysis. PLoS Med. 2009;6:e1000146. doi: 10.1371/journal.pmed.1000146. [DOI] [PMC free article] [PubMed] [Google Scholar]
- 5.Chang KC, Leung CC, Grosset J, Yew WW. Treatment of tuberculosis and optimal dosing schedules. Thorax. 2011;66:997–1007. doi: 10.1136/thx.2010.148585. [DOI] [PubMed] [Google Scholar]
- 6.Bose A, Kalita S, Rose W, Tharyan P. Intermittent versus daily therapy for treating tuberculosis in children. Cochrane Database Syst Rev. 2014;1:CD007953. doi: 10.1002/14651858.CD007953.pub2. [DOI] [PMC free article] [PubMed] [Google Scholar]
- 7.Gelman E, McKinney JD, Dhar N. Malachite green interferes with postantibiotic recovery of mycobacteria. Antimicrob Agents Chemother. 2012;56:3610–3614. doi: 10.1128/AAC.00406-12. [DOI] [PMC free article] [PubMed] [Google Scholar]
- 8.Odenholt-Tornqvist I. Studies on the postantibiotic effect and the postantibiotic sub-MIC effect of meropenem. J Antimicrob Chemother. 1993;31:881–892. doi: 10.1093/jac/31.6.881. [DOI] [PubMed] [Google Scholar]
- 9.Zumla A, Nahid P, Cole ST. Advances in the development of new tuberculosis drugs and treatment regimens. Nat Rev Drug Discov. 2013;12:388–404. doi: 10.1038/nrd4001. [DOI] [PubMed] [Google Scholar]
- 10.Roberts JA, Paul SK, Akova M, Bassetti M, De Waele JJ, Dimopoulos G, Kaukonen KM, Koulenti D, Martin C, Montravers P. DALI: defining antibiotic levels in intensive care unit patients: are current β-lactam antibiotic doses sufficient for critically ill patients? Clin Infect Dis. 2014;58:1072–1083. doi: 10.1093/cid/ciu027. [DOI] [PubMed] [Google Scholar]
- 11.Udekwu KI, Parrish N, Ankomah P, Baquero F, Levin BR. Functional relationship between bacterial cell density and the efficacy of antibiotics. J Antimicrob Chemother. 2009;63:745–757. doi: 10.1093/jac/dkn554. [DOI] [PMC free article] [PubMed] [Google Scholar]
- 12.Yarwood JM, Bartels DJ, Volper EM, Greenberg EP. Quorum sensing in Staphylococcus aureus biofilms. J Bacteriol. 2004;186:1838–1850. doi: 10.1128/JB.186.6.1838-1850.2004. [DOI] [PMC free article] [PubMed] [Google Scholar]
- 13.Sabath LD, Garner C, Wilcox C, Finland M. Effect of inoculum and of beta-lactamase on the anti-staphylococcal activity of thirteen penicillins and cephalosporins. Antimicrob Agents Chemother. 1975;8:344–349. doi: 10.1128/aac.8.3.344. [DOI] [PMC free article] [PubMed] [Google Scholar]
- 14.Stevens DL, Yan S, Bryant AE. Penicillin-binding protein expression at different growth stages determines penicillin efficacy in vitro and in vivo: an explanation for the inoculum effect. J Infect Dis. 1993;167:1401–1405. doi: 10.1093/infdis/167.6.1401. [DOI] [PubMed] [Google Scholar]
- 15.zur Wiesch PA, Kouyos R, Engelstädter J, Regoes RR, Bonhoeffer S. Population biological principles of drug-resistance evolution in infectious diseases. Lancet Infect Dis. 2011;11:236–247. doi: 10.1016/S1473-3099(10)70264-4. [DOI] [PubMed] [Google Scholar]
- 16.Performance standards for antimicrobial susceptibility testing. Clinical and Laboratory Standards Institute; Wayne, PA: 2005. [Google Scholar]
- 17.Lee YH, Liu G, Thiboutot DM, Leslie DL, Kirby JS. A retrospective analysis of the duration of oral antibiotic therapy for the treatment of acne among adolescents: investigating practice gaps and potential cost-savings. J Am Acad Dermatol. 2014;71:70–76. doi: 10.1016/j.jaad.2014.02.031. [DOI] [PubMed] [Google Scholar]
- 18.Cranendonk DR, Opmeer BC, Prins JM, Wiersinga WJ. Comparing short to standard duration of antibiotic therapy for patients hospitalized with cellulitis (DANCE): study protocol for a randomized controlled trial. BMC Infect Dis. 2014;14:235. doi: 10.1186/1471-2334-14-235. [DOI] [PMC free article] [PubMed] [Google Scholar]
- 19.Hohn A, Schroeder S, Gehrt A, Bernhardt K, Bein B, Wegscheider K, Hochreiter M. Procalcitonin-guided algorithm to reduce length of antibiotic therapy in patients with severe sepsis and septic shock. BMC Infect Dis. 2013;13:158. doi: 10.1186/1471-2334-13-158. [DOI] [PMC free article] [PubMed] [Google Scholar]
- 20.Zumla AI, Gillespie SH, Hoelscher M, Philips PPJ, Cole ST, Abubakar I, McHugh TD, Schito M, Maeurer M, Nunn AJ. New antituberculosis drugs, regimens, and adjunct therapies: needs, advances, and future prospects. Lancet Infect Dis. 2014;14:327–340. doi: 10.1016/S1473-3099(13)70328-1. [DOI] [PubMed] [Google Scholar]
- 21.Dimopoulos G, Poulakou G, Pneumatikos IA, Armaganidis A, Kollef MH, Matthaiou DK. Short- vs long-duration antibiotic regimens for ventilator-associated pneumonia: a systematic review and meta-analysis. Chest. 2013;144:1759–1767. doi: 10.1378/chest.13-0076. [DOI] [PubMed] [Google Scholar]
- 22.Guillemot D, Carbon C, Balkau B, Geslin P, Lecoeur H, Vauzelle-Kervroëdan F, Bouvenot G, Eschwége E. Low dosage and long treatment duration of beta-lactam: risk factors for carriage of penicillin-resistant Streptococcus pneumoniae. JAMA. 1998;279:365–370. doi: 10.1001/jama.279.5.365. [DOI] [PubMed] [Google Scholar]
- 23.Balaban NQ, Merrin J, Chait R, Kowalik L, Leibler S. Bacterial persistence as a phenotypic switch. Science. 2004;305:1622–1625. doi: 10.1126/science.1099390. [DOI] [PubMed] [Google Scholar]
- 24.Balaban NQ, Gerdes K, Lewis K, McKinney JD. A problem of persistence: still more questions than answers? Nat Rev Microbiol. 2013;11:587–591. doi: 10.1038/nrmicro3076. [DOI] [PubMed] [Google Scholar]
- 25.Cohen NR, Lobritz MA, Collins JJ. Microbial persistence and the road to drug resistance. Cell Host Microbe. 2013;13:632–642. doi: 10.1016/j.chom.2013.05.009. [DOI] [PMC free article] [PubMed] [Google Scholar]
- 26.Dörr T, Lewis K, Vulić M. SOS response induces persistence to fluoroquinolones in Escherichia coli. PLoS Genet. 2009;5:e1000760. doi: 10.1371/journal.pgen.1000760. [DOI] [PMC free article] [PubMed] [Google Scholar]
- 27.Feng J, Kessler DA, Ben-Jacob E, Levine H. Growth feedback as a basis for persister bistability. Proc Natl Acad Sci U S A. 2014;111:544–549. doi: 10.1073/pnas.1320396110. [DOI] [PMC free article] [PubMed] [Google Scholar]
- 28.Grant SS, Kaufmann BB, Chand NS, Haseley N, Hung DT. Eradication of bacterial persisters with antibiotic-generated hydroxyl radicals. Proc Natl Acad Sci U S A. 2012;109:12147–12152. doi: 10.1073/pnas.1203735109. [DOI] [PMC free article] [PubMed] [Google Scholar]
- 29.Johnson PJT, Levin BR. Pharmacodynamics, population dynamics, and the evolution of persistence in Staphylococcus aureus. PLoS Genet. 2013;9:e1003123. doi: 10.1371/journal.pgen.1003123. [DOI] [PMC free article] [PubMed] [Google Scholar]
- 30.Stewart GR, Robertson BD, Young DB. Tuberculosis: a problem with persistence. Nat Rev Microbiol. 2003;1:97–105. doi: 10.1038/nrmicro749. [DOI] [PubMed] [Google Scholar]
- 31.Wakamoto Y, Dhar N, Chait R, Schneider K, Signorino-Gelo F, Leibler S, McKinney JD. Dynamic persistence of antibiotic-stressed mycobacteria. Science. 2013;339:91–95. doi: 10.1126/science.1229858. [DOI] [PubMed] [Google Scholar]
- 32.Dörr T, Vulić M, Lewis K. Ciprofloxacin causes persister formation by inducing the TisB toxin in Escherichia coli. PLoS Biol. 2010;8:e1000317. doi: 10.1371/journal.pbio.1000317. [DOI] [PMC free article] [PubMed] [Google Scholar]
- 33.Lewis K. Persister cells, dormancy and infectious disease. Nat Rev Microbiol. 2007;5:48–56. doi: 10.1038/nrmicro1557. [DOI] [PubMed] [Google Scholar]
- 34.Fridman O, Goldberg A, Ronin I, Shoresh N, Balaban NQ. Optimization of lag time underlies antibiotic tolerance in evolved bacterial populations. Nature. 2014;513:418–421. doi: 10.1038/nature13469. [DOI] [PubMed] [Google Scholar]
- 35.Martínez JL, Baquero F, Andersson DI. Predicting antibiotic resistance. Nat Rev Microbiol. 2007;5:958–965. doi: 10.1038/nrmicro1796. [DOI] [PubMed] [Google Scholar]
- 36.Ocampo PS, Lázár V, Papp B, Arnoldini M, Abel zur Wiesch P, Busa-Fekete R, Fekete G, Pál C, Ackermann M, Bonhoeffer S. Antagonism between Bacteriostatic and Bactericidal Antibiotics Is Prevalent. Antimicrob Agents Chemother. 2014;58:4573–4582. doi: 10.1128/AAC.02463-14. [DOI] [PMC free article] [PubMed] [Google Scholar]
- 37.Scott M, Gunderson CW, Mateescu EM, Zhang Z, Hwa T. Interdependence of cell growth and gene expression: origins and consequences. Science. 2010;330:1099–1102. doi: 10.1126/science.1192588. [DOI] [PubMed] [Google Scholar]
- 38.Gudmundsson S, Einarsson S, Erlendsdottir H, Moffat J, Bayer W, Craig WA. The post-antibiotic effect of antimicrobial combinations in a neutropenic murine thigh infection model. J Antimicrob Chemother. 1993;31 Suppl D191:177. doi: 10.1093/jac/31.suppl_d.177. [DOI] [PubMed] [Google Scholar]
- 39.Täuber MG, Zak O, Scheld WM, Hengstler B, Sande MA. The postantibiotic effect in the treatment of experimental meningitis caused by Streptococcus pneumoniae in rabbits. J Infect Dis. 1984;149:575–583. doi: 10.1093/infdis/149.4.575. [DOI] [PubMed] [Google Scholar]
- 40.Craig WA. Post-antibiotic effects in experimental infection models: relationship to in-vitro phenomena and to treatment of infections in man. J Antimicrob Chemother. 1993;31 Suppl D:149–158. doi: 10.1093/jac/31.suppl_d.149. [DOI] [PubMed] [Google Scholar]
- 41.Regoes RR, Wiuff C, Zappala RM, Garner KN, Baquero F, Levin BR. Pharmacodynamic functions: a multiparameter approach to the design of antibiotic treatment regimens. Antimicrob Agents Chemother. 2004;48:3670–3676. doi: 10.1128/AAC.48.10.3670-3676.2004. [DOI] [PMC free article] [PubMed] [Google Scholar]
- 42.Bakshi S, Siryaporn A, Goulian M, Weisshaar JC. Superresolution imaging of ribosomes and RNA polymerase in live Escherichia coli cells. Mol Microbiol. 2012;85:21–38. doi: 10.1111/j.1365-2958.2012.08081.x. [DOI] [PMC free article] [PubMed] [Google Scholar]
- 43.Molinengo L. The curve doses vs survival time in the evaluation of acute toxicity. J Pharm Pharmacol. 1979;31:343–344. doi: 10.1111/j.2042-7158.1979.tb13517.x. [DOI] [PubMed] [Google Scholar]
- 44.Magnet S, Blanchard JS. Molecular Insights into Aminoglycoside Action and Resistance. Chem Rev. 2005;105:477–498. doi: 10.1021/cr0301088. [DOI] [PubMed] [Google Scholar]
- 45.Williamson R, Hakenbeck R, Tomasz A. In vivo interaction of beta-lactam antibiotics with the penicillin-binding proteins of Streptococcus pneumoniae. Antimicrob Agents Chemother. 1980;18:629–637. doi: 10.1128/aac.18.4.629. [DOI] [PMC free article] [PubMed] [Google Scholar]
- 46.Chambers HF, Sachdeva MJ, Hackbarth CJ. Kinetics of penicillin binding to penicillin-binding proteins of Staphylococcus aureus. Biochem J. 1994;301(Pt 1):139–144. doi: 10.1042/bj3010139. [DOI] [PMC free article] [PubMed] [Google Scholar]
- 47.Dougherty TJ, Kennedy K, Kessler RE, Pucci MJ. Direct quantitation of the number of individual penicillin-binding proteins per cell in Escherichia coli. J Bacteriol. 1996;178:6110–6115. doi: 10.1128/jb.178.21.6110-6115.1996. [DOI] [PMC free article] [PubMed] [Google Scholar]
- 48.Li RC. Simultaneous pharmacodynamic analysis of the lag and bactericidal phases exhibited by beta-lactams against Escherichia coli. Antimicrob Agents Chemother. 1996;40:2306–2310. doi: 10.1128/aac.40.10.2306. [DOI] [PMC free article] [PubMed] [Google Scholar]
- 49.Freed NE, Silander OK, Stecher B, Böhm A, Hardt WD, Ackermann M. A simple screen to identify promoters conferring high levels of phenotypic noise. PLoS Genet. 2008;4:e1000307. doi: 10.1371/journal.pgen.1000307. [DOI] [PMC free article] [PubMed] [Google Scholar]
- 50.Silander OK, Nikolic N, Zaslaver A, Bren A, Kikoin I, Alon U, Ackermann M. A genome-wide analysis of promoter-mediated phenotypic noise in Escherichia coli. PLoS Genet. 2012;8:e1002443. doi: 10.1371/journal.pgen.1002443. [DOI] [PMC free article] [PubMed] [Google Scholar]
- 51.Jindani A, Doré CJ, Mitchison DA. Bactericidal and Sterilizing Activities of Antituberculosis Drugs during the First 14 Days. Am J Respir Crit Care Med. 2003;167:1348–1354. doi: 10.1164/rccm.200210-1125OC. [DOI] [PubMed] [Google Scholar]
- 52.Ziglam HM. Rifampicin concentrations in bronchial mucosa, epithelial lining fluid, alveolar macrophages and serum following a single 600 mg oral dose in patients undergoing fibre-optic bronchoscopy. J Antimicrob Chemother. 2002;50:1011–1015. doi: 10.1093/jac/dkf214. [DOI] [PubMed] [Google Scholar]
- 53.Wilkins JJ, Savic RM, Karlsson MO, Langdon G, McIlleron H, Pillai G, Smith PJ, Simonsson US. Population pharmacokinetics of rifampin in pulmonary tuberculosis patients, including a semimechanistic model to describe variable absorption. Antimicrob Agents Chemother. 2008;52:2138–2148. doi: 10.1128/AAC.00461-07. [DOI] [PMC free article] [PubMed] [Google Scholar]
- 54.Shah D, Zhang Z, Khodursky A, Kaldalu N, Kurg K, Lewis K. Persisters: a distinct physiological state of E. coli. BMC Microbiol. 2006;6:53. doi: 10.1186/1471-2180-6-53. [DOI] [PMC free article] [PubMed] [Google Scholar]
- 55.Maisonneuve E, Gerdes K. Molecular mechanisms underlying bacterial persisters. Cell. 2014;157:539–548. doi: 10.1016/j.cell.2014.02.050. [DOI] [PubMed] [Google Scholar]
- 56.Javid B, Sorrentino F, Toosky M, Zheng W, Pinkham JT, Jain N, Pan M, Deighan F, Rubin EJ. Mycobacterial mistranslation is necessary and sufficient for rifampicin phenotypic resistance. Proc Natl Acad Sci. 2014;111:1132–1137. doi: 10.1073/pnas.1317580111. [DOI] [PMC free article] [PubMed] [Google Scholar]
- 57.Manina G, Dhar N, McKinney JD. Stress and Host Immunity Amplify Mycobacterium tuberculosis Phenotypic Heterogeneity and Induce Nongrowing Metabolically Active Forms. Cell Host Microbe. 2015;17:32–46. doi: 10.1016/j.chom.2014.11.016. [DOI] [PubMed] [Google Scholar]
- 58.Spencer SL, Gaudet S, Albeck JG, Burke JM, Sorger PK. Non-genetic origins of cell-to-cell variability in TRAIL-induced apoptosis. Nature. 2009;459:428–432. doi: 10.1038/nature08012. [DOI] [PMC free article] [PubMed] [Google Scholar]
- 59.Levin BR, Rozen DE. Non-inherited antibiotic resistance. Nat Rev Microbiol. 2006;4:556–562. doi: 10.1038/nrmicro1445. [DOI] [PubMed] [Google Scholar]
- 60.Patel JK, Read CB. Handbook of the Normal Distribution. 2. Taylor & Francis; London: 1996. [Google Scholar]
- 61.MacKay DJC. Information Theory, Inference and Learning Algorithms. Cambridge University Press; Cambridge: 2003. [Google Scholar]
- 62.Chanwong S, Maneekarn N, Makonkawkeyoon L, Makonkawkeyoon S. Intracellular growth and drug susceptibility of Mycobacterium tuberculosis in macrophages. Tuberculosis. 2007;87:130–133. doi: 10.1016/j.tube.2006.06.001. [DOI] [PubMed] [Google Scholar]
- 63.Wiseman B, Carpena X, Feliz M, Donald LJ, Pons M, Fita I, Loewen PC. Isonicotinic acid hydrazide conversion to Isonicotinyl-NAD by catalase-peroxidases. J Biol Chem. 2010;285:26662–26673. doi: 10.1074/jbc.M110.139428. [DOI] [PMC free article] [PubMed] [Google Scholar]
- 64.Nilsson M, Bülow L, Wahlund KG. Use of flow field-flow fractionation for the rapid quantitation of ribosome and ribosomal subunits in Escherichia coli at different protein production conditions. Biotechnol Bioeng. 1997;54:461–467. doi: 10.1002/(SICI)1097-0290(19970605)54:5<461::AID-BIT6>3.0.CO;2-C. [DOI] [PubMed] [Google Scholar]
- 65.Bremer H, Dennis PP. In: In Escherichia coli and Salmonella typhimurium: cellular and molecular biology. Neidhardt FC, editor. American Society for Microbiology; Washington, DC: 1987. pp. 1553–1569. [Google Scholar]
- 66.Epe B, Woolley P. The binding of 6-demethylchlortetracycline to 70S, 50S and 30S ribosomal particles: a quantitative study by fluorescence anisotropy. EMBO J. 1984;3:121–126. doi: 10.1002/j.1460-2075.1984.tb01771.x. [DOI] [PMC free article] [PubMed] [Google Scholar]
- 67.Zakeri B, Wright GD. Chemical biology of tetracycline antibiotics. Biochim Biol Cell. 2008;86:124–136. doi: 10.1139/O08-002. [DOI] [PubMed] [Google Scholar]
- 68.Pioletti M, Schlünzen F, Harms J, Zarivach R, Glühmann M, Avila H, Bashan A, Bartels H, Auerbach T, Jacobi C, Hartsch T, Yonath A, Franceschi F. Crystal structures of complexes of the small ribosomal subunit with tetracycline, edeine and IF3. EMBO J. 2001;20:1829–1839. doi: 10.1093/emboj/20.8.1829. [DOI] [PMC free article] [PubMed] [Google Scholar]
- 69.Tritton TR. Ribosome-tetracycline interactions. Biochemistry (Mosc) 1977;16:4133–4138. doi: 10.1021/bi00637a029. [DOI] [PubMed] [Google Scholar]
- 70.Tangy F, Moukkadem M, Vindimian E, Capmau ML, Le Goffic F. Mechanism of action of gentamicin components. Characteristics of their binding to Escherichia coli ribosomes. Eur J Biochem. 1985;147:381–386. doi: 10.1111/j.1432-1033.1985.tb08761.x. [DOI] [PubMed] [Google Scholar]
- 71.Llano-Sotelo B, Hickerson RP, Lancaster L, Noller HF, Mankin AS. Fluorescently labeled ribosomes as a tool for analyzing antibiotic binding. RNA. 2009;15:1597–1604. doi: 10.1261/rna.1681609. [DOI] [PMC free article] [PubMed] [Google Scholar]
- 72.Chang FN, Flaks JG. Binding of dihydrostreptomycin to Escherichia coli ribosomes: kinetics of the reaction. Antimicrob Agents Chemother. 1972;2:308–319. doi: 10.1128/aac.2.4.308. [DOI] [PMC free article] [PubMed] [Google Scholar]
- 73.Lando D, Cousin MA, Ojasoo T, Raymond JP. Paromomycin and dihydrostreptomycin binding to Escherichia coli ribosomes. Eur J Biochem. 1976;66:597–606. doi: 10.1111/j.1432-1033.1976.tb10587.x. [DOI] [PubMed] [Google Scholar]
- 74.Spratt BG. Distinct penicillin binding proteins involved in the division, elongation, and shape of Escherichia coli K12. Proc Natl Acad Sci U S A. 1975;72:2999–3003. doi: 10.1073/pnas.72.8.2999. [DOI] [PMC free article] [PubMed] [Google Scholar]
- 75.Terrak M, Ghosh TK, van Heijenoort J, Van Beeumen J, Lampilas M, Aszodi J, Ayala JA, Ghuysen JM, Nguyen-Distèche M. The catalytic, glycosyl transferase and acyl transferase modules of the cell wall peptidoglycan-polymerizing penicillin-binding protein 1b of Escherichia coli. Mol Microbiol. 1999;34:350–364. doi: 10.1046/j.1365-2958.1999.01612.x. [DOI] [PubMed] [Google Scholar]
- 76.Maier T, Schmidt A, Güell M, Kühner S, Gavin AC, Aebersold R, Serrano L. Quantification of mRNA and protein and integration with protein turnover in a bacterium. Mol Syst Biol. 2011;7:511. doi: 10.1038/msb.2011.38. [DOI] [PMC free article] [PubMed] [Google Scholar]
- 77.Malmström J, Beck M, Schmidt A, Lange V, Deutsch EW, Aebersold R. Proteome-wide cellular protein concentrations of the human pathogen Leptospira interrogans. Nature. 2009;460:762–765. doi: 10.1038/nature08184. [DOI] [PMC free article] [PubMed] [Google Scholar]
- 78.Wehrli W. Kinetic studies of the interaction between rifampicin and DNA-dependent RNA polymerase of Escherichia coli. Eur J Biochem. 1977;80:325–330. doi: 10.1111/j.1432-1033.1977.tb11886.x. [DOI] [PubMed] [Google Scholar]
- 79.Bennett BD, Kimball EH, Gao M, Osterhout R, Van Dien SJ, Rabinowitz JD. Absolute metabolite concentrations and implied enzyme active site occupancy in Escherichia coli. Nat Chem Biol. 2009;5:593–599. doi: 10.1038/nchembio.186. [DOI] [PMC free article] [PubMed] [Google Scholar]
- 80.Taniguchi Y, Choi PJ, Li GW, Chen H, Babu M, Hearn J, Emili A, Xie XS. Quantifying E. coli proteome and transcriptome with single-molecule sensitivity in single cells. Science. 2010;329:533–538. doi: 10.1126/science.1188308. [DOI] [PMC free article] [PubMed] [Google Scholar]
- 81.Wilming M, Johnsson K. Spontaneous Formation of the Bioactive Form of the Tuberculosis Drug Isoniazid. Angew Chem Int Ed Engl. 1999;38:2588–2590. doi: 10.1002/(sici)1521-3773(19990903)38:17<2588::aid-anie2588>3.0.co;2-8. [DOI] [PubMed] [Google Scholar]
- 82.Rawat R, Whitty A, Tonge PJ. The isoniazid-NAD adduct is a slow, tight-binding inhibitor of InhA, the Mycobacterium tuberculosis enoyl reductase: adduct affinity and drug resistance. Proc Natl Acad Sci U S A. 2003;100:13881–13886. doi: 10.1073/pnas.2235848100. [DOI] [PMC free article] [PubMed] [Google Scholar]
Associated Data
This section collects any data citations, data availability statements, or supplementary materials included in this article.
Supplementary Materials
Supplementary materials and methods.
Fig. S1. Analysis of single cell time-lapse microscopy data E. coli MG1655 cells exposed to tetracycline.
Fig. S2. Baseline growth rate affects length of post-antibiotic growth suppression.
Fig. S3. Time-kill curves of E. coli CAB1 exposed to five different classes of antibiotics in various concentrations.
Fig. S4. Analysis of single cell time-lapse microscopy data for E. coli MG1655 cells exposed to streptomycin.
Fig. S5. Simulated time-kill curves under different assumptions.
Fig. S6. Distribution of drug susceptibility and expected time-kill curve.
Fig. S7. Effect of variance in target molecule content.
Fig. S8. Overview of kill mechanisms, chemical reactions, and compartmental models used in this study.
Table S1. Ciprofloxacin persisting E. coli have not acquired higher resistance to the antibiotic.
Table S2. Antibiotic concentrations used for experiments.
Table S3. Kinetic parameters for different antibiotics.
Table S4. Explanation of variables and parameters.
Movie S1. Single cell microscopy data for E. coli MG1655 cells exposed to 12.5 mg/L tetracycline (0.8× MIC).
Movie S2. Single cell microscopy data for E. coli MG1655 cells exposed to 25 mg/L streptomycin (2× MIC).