SUMMARY
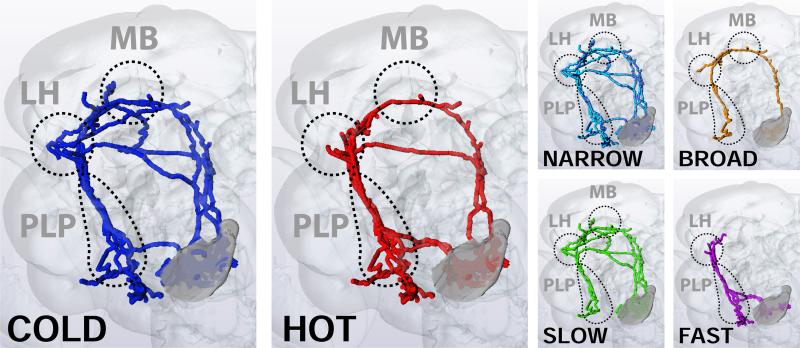
In Drosophila, rapid temperature changes are detected at the periphery by dedicated receptors forming a simple sensory map for hot and cold in the brain1. However, flies show a host of complex innate and learned responses to temperature, indicating that they are able to extract a range of information from this simple input. Here, we define the anatomical and physiological repertoire for temperature representation in the Drosophila brain. First, we use a photolabeling strategy2 to trace the connections that relay peripheral thermosensory information to higher brain centers, and show that they largely converge onto three target regions: the Mushroom Body, Lateral Horn (well-known centers for sensory processing) and the Posterior Lateral Protocerebrum, a region we now define as a major site of thermosensory representation. Then, using in vivo calcium imaging3, we describe the thermosensory projection neurons selectively activated by hot or cold stimuli. Fast-adapting neurons display transient “ON” and “OFF” responses and track rapid temperature shifts remarkably well, while slow-adapting cell responses better reflect the magnitude of simple thermal changes. Unexpectedly, we also find a population of ‘broadly-tuned’ cells that respond to both heating and cooling, and show that they are required for normal behavioral avoidance of both hot and cold in a simple 2-choice temperature preference assay. Taken together, our results uncover a coordinated ensemble of neural responses to temperature in the fly brain, demonstrate that a broadly tuned thermal-line contributes to rapid avoidance behavior, and illustrate how stimulus quality, temporal structure, and intensity can be extracted from a simple glomerular map at a single synaptic station.
Thermosensation provides animals with critical information about their environment. We have previously shown that, in Drosophila, rapid temperature changes are detected by dedicated hot and cold temperature receptors (TRs) in the last antennal segment, the arista, with 3 cells responding to warming and 3 to cooling1. The projections of these sensory neurons target the base of the antennal lobe, a region previously referred to as the Proximal Antennal Protocerebrum (according to new standard fly brain nomenclature4 this region is now referred to as the Posterior Antennal Lobe, PAL –see methods). There, hot and cold TRs form two distinct, adjacent glomeruli defining a simple map for temperature coding1. We now focus on identifying the second-order thermosensory neurons (referred to as Thermosensory Projection Neurons) as a first step towards understanding how this spatially segregated pattern of activity is processed to mediate appropriate responses to temperature stimuli.
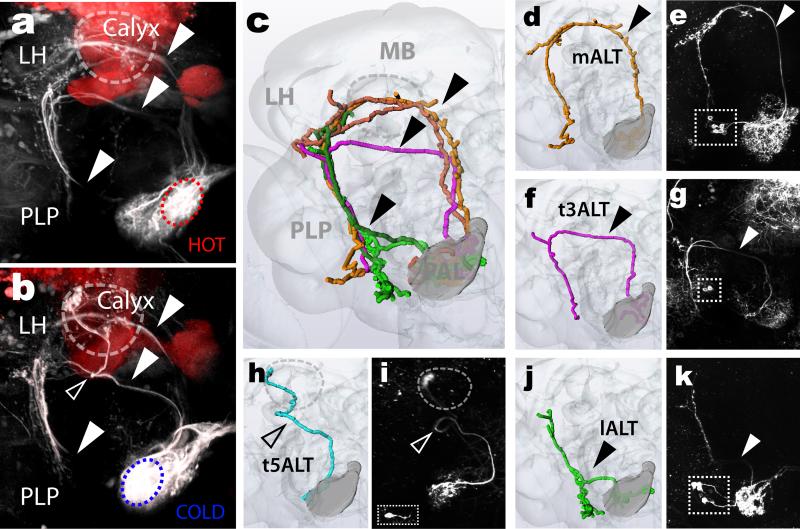
Thermosensory Projection Neurons (tPNs) should display prominent dendritic PAL innervation. Therefore, we reasoned that 2-photon guided conversion of photo-activatable GFP (PA-GFP2,5) could provide a suitable approach to identify their projections. We engineered flies where PA-GFP was constitutively expressed in all brain neurons, and the hot and/or cold TR terminals were selectively labeled by a red fluorescent protein6 (ED Figure 1). Using the red fluorescence as a guide, we then photo-converted PA-GFP in either the hot (Figure 1a) or cold (Figure 1b) glomeruli, resulting in labeling of ascending axons. PNs originating in the PAL follow several widely different trajectories to reach their targets (Figure 1). Amongst these, one prominent pathway targeted the Calyx (the input region of the Mushroom Body, MB) and the edge of the lateral horn (LH), from where a subset of axons further extended ventrally to terminate in the Posterior Lateral Protocerebrum (PLP, Figure 1a, b top arrowhead). Another group of tPNs initially followed the same ascending tract, but bypassed the Calyx, instead veering off laterally to innervate the same domains of the LH and PLP (Figure 1a, b center arrowhead). A third class of tPNs directly extended axons laterally, following either an anterior or posterior path that still terminated in the same domains of the LH and PLP (Figure 1a,b bottom arrowhead). Thus, despite following different routes, these pathways largely converged onto just three regions: the MB Calyx, the LH (well-known centers for sensory processing in the fly brain) and the PLP, a poorly characterized region that now emerges as a major site of thermosensory signal processing. Our data also demonstrated significant overlap between projections innervating the hot and cold glomeruli. Indeed, we only observed a single modality-specific fiber that connected the cold sensory terminals to a ‘microglomerulus’ at the edge of the Calyx (Figure 1b, empty arrowhead; this unusual fiber has been noted previously in anatomical studies7).
Figure 1. Projection neuron pathways in the fly thermosensory system.
(a,b) PA-GFP photoconversion directed to the pre-synaptic termini of hot (a, red circle) or cold (b, blue circle) TRs labels post-synaptic pathways, revealing common projections (full arrowheads in a and b) and a single, cold-specific fiber (empty arrowhead in b) –as well as a high degree of convergence on three target regions: the Mushroom Body (MB), Lateral Horn (LH) and Posterior Lateral Protocerebrum (PLP). MBs were labeled with dsRed as a landmark. (c,d,f,h,j) 3D reconstruction of specific pathways, and (e,g,i,k) 2-photon stacks of brains expressing GFP under the control of drivers selectively expressed in corresponding tPNs (see methods for genotypes). Drivers: (e) R22C06, (g) R84E08, (i) R60H12, (k) R95C02 (cell bodies are boxed). (m- : medial, t-: transverse, l- : lateral; ALT: Antennal Lobe Tract).
Why is thermosensory information split into different pathways, which largely converge onto the same target regions? To begin answering this question, we searched the large collections of Gal4 driver lines made available by the Janelia Farm FlyLight initiative7, as well as the ViennaTile project (http://stockcenter.vdrc.at/), and selected lines to target specific tPN populations for functional studies. Visual inspection of nearly 12000 confocal stacks (representing more than 10000 lines) confirmed that our PA-GFP experiments had identified the major projections originating from the PAL and provided an initial list of ~200 drivers targeting tPNs. For this work, we used 10 representative drivers fulfilling three important criteria: 1) selective Gal4 expression, as this would help to unambiguously identify the neurons of interest. 2) Confirmed synaptic connectivity with the sensory neurons, as detected by GFP reconstitution across synaptic partners (GRASP8,9, including a new synaptic variant we developed -ED Figure 2). 3) Rapid functional responses to naturalistic temperature stimuli, recorded in vivo by gently exposing brain tissue through a hole in the head cuticle and imaging the activity of tPNs by 2-photon microscopy1. Finally, we used acute resection of the antennal nerve as a means to confirm that the cell's responses were in fact driven by the antennal TRs.
The drivers listed in Extended data Table 1 fulfill all these criteria and provide a comprehensive repertoire of thermosensory PNs, while the anatomy of a representative set of tPN cell types (reconstructed by transgenic labeling with GFP) is shown in figure 1c-k. Finally, we confirmed that all identified tPNs displayed the expected polarity of a projection neuron (i.e. dendrites in the PAL and axon terminals in higher brain centers) by targeting expression of a dendritic marker (DenMark10, ED Table 1) and of a pre-synaptic GFP fusion (syt:GFP11, ED Figure 3). In all, our screen identified 7 tPN cell types with distinct innervation patterns and functional properties (see below).
Extended data Table 1.
Driver lines used in this study and summary of the properties of the tPNs in which they are active.
| Figure 1 | Figure 2 | Figure 3 | |
|---|---|---|---|
| Panel a | AOP.tdTomato; GR28bd.LexA/UAS.C3PAGFP,mb.dsRed;Syb.Gal4 | n/a | n/a |
| Panel b | AOP.tdTomato; IR94a.LexA/UAS.C3PAGFP,mb.dsRed;Syb.Gal4 | w;UAS.GCaMP6m;R60H12.Gal4 | w;UAS.GCaMP6m;R95C02.Gal4 |
| Panel c | n/a | w;UAS.GCaMP6m;R60H12.Gal4 | w;UAS.GCaMP6m;R95C02.Gal4 |
| Panel d | n/a | w;UAS.GCaMP6m;R60H12.Gal4 | w;UAS.GCaMP6m;R95C02.Gal4 |
| Panel e | w;UAS.CD8-GFP;R22C06.Gal4 | w;UAS.GCaMP6m;R60H12.Gal4 | w;UAS.GCaMP6m;R95C02.Gal4 |
| Panel f | n/a | w;UAS.GCaMP6m;R95C02.Gal4 | |
| Panel g | w;UAS.CD8-GFP;R84E08.Gal4 | w;UAS.GCaMP6m;R95C02.Gal4 | |
| Panel h | n/a | w;UAS.GCaMP6m;R95C02.Gal4 | |
| Panel i | w;UAS.CD8-GFP;R60H12.Gal4 | w;UAS.GCaMP6m;R95C02.Gal4 | |
| Panel j | n/a | ||
| Panel k | w;UAS.CD8-GFP;R95C02.Gal4 |
| Figure 4 | Figure 5 | |
|---|---|---|
| Panel a | n/a | w;UAS.CD8-GFP;VT40053.Gal4 |
| Panel b | w;UAS.GCaMP6m;VT40053.gal4 | w;UAS.CD8-GFP;R22C06.Gal4 |
| Panel c | w;UAS.GCaMP6m;VT40053.gal4 | w;+;VT40053.Gal4, w;UAS.Kir2.1;VT40053.Gal4 |
| Panel d | w;UAS.GCaMP6m;VT40053.gal4 | w;+;R22C06.Gal4, w;UAS.Kir2.1;R22C06.Gal4 |
| Panel e | w;UAS.GCaMP6m;VT40053.gal4 | w;UAS.Kir2.1;+ |
| Panel f | w;UAS.GCaMP6m;VT40053.gal4 | w;+;VT26020.Gal4, w;UAS.Kir2.1;VT26020.Gal4 |
| Panel g | w;UAS.GCaMP6m;VT40053.gal4 | n/a |
| ED Figure 1 | ED Figure 2 | ED Figure 3 | |
|---|---|---|---|
| Panel a | n/a | w;UAS.CD4-spGFP11, AOP.CD4-spGFP1-10/IR94a.LexA;VT46265.Gal4 | n/a |
| Panel b | n/a | w;UAS.Syb-spGFP11, AOP.Syb-spGFP1-10/IR94a.LexA;VT46265.Gal4 | n/a |
| Panel c | AOP.tdTomato;GR28bd.LexA;+ | n/a | w;+;UAS.Syt-GFP/R22C06.Gal4 |
| Panel d | AOP.tdTomato; GR28bd.LexA/UAS.C3PAGFP;Syb.Gal4 | w;UAS.CD4-spGFP11, AOP.CD4-spGFP1-10/IR94a.LexA;VT40053.Gal4 | n/a |
| Panel e | AOP.tdTomato; GR28bd.LexA/UAS.C3PAGFP;Syb.Gal4 | w;UAS.CD4-spGFP11, AOP.CD4-spGFP1-10/GR28bd.LexA;VT40053.Gal4 | w;+;UAS.Syt-GFP/VT26020.Gal4 |
| Panel f | w;UAS.CD4-spGFP11, AOP.CD4-spGFP1-10/IR94a.LexA;R60H12.Gal4 | n/a | |
| Panel g | w;UAS.CD4-spGFP11, AOP.CD4-spGFP1-10/GR28bd.LexA;R60H12.Gal4 | w;+;UAS.Syt-GFP/R84E08.Gal4 | |
| Panel h | w;UAS.CD4-spGFP11, AOP.CD4-spGFP1-10/IR94a.LexA;VT46265.Gal4 | n/a | |
| Panel i | w;UAS.CD4-spGFP11, AOP.CD4-spGFP1-10/GR28bd.LexA;VT46265.Gal4 | w;+;UAS.Syt-GFP/R60H12.Gal4 | |
| Panel j | n/a | ||
| Panel k | w;+;UAS.Syt-GFP/R95C02.Gal4 | ||
| Panel l | n/a | ||
| Panel m | w;+;UAS.Syt-GFP/VT46265.Gal4 |
| ED Figure 4 | ED Figure 5 | ED Figure 6 | ED Figure 7 | |
|---|---|---|---|---|
| Panel a | w;UAS.GCaMP6m;R60H12.Gal4(left), w;UAS.GCaMP6m;R95C02.Gal4(right) | w;UAS.GCaMP6m;R95C02.Gal4 | w;UAS.GCaMP6m;R95C02.Gal4 | n/a |
| Panel b | w;UAS.GCaMP6m;R60H12.Gal4(top), w;UAS.GCaMP6m;R95C02.Gal4(bottom) | w;UAS.GCaMP6m;R95C02.Gal4 | w;UAS.CD8-GFP;VT26020.Gal4 | |
| Panel c | w;UAS.GCaMP6m;R60H12.Gal4(left), w;UAS.GCaMP6m;R95C02.Gal4(right) | w;UAS.GCaMP6m;R95C02.Gal4 | w;UAS.GCaMP6m;VT26020.Gal4 | |
| Panel d | w;UAS.GCaMP6m;R95C02.Gal4 | w;UAS.GCaMP6m;VT26020.Gal4 | ||
| Panel e | w;UAS.GCaMP6m;R95C02.Gal4 | |||
| Panel f | w;UAS.GCaMP6m;R95C02.Gal4 | |||
| Panel g | w;UAS.GCaMP6m;R95C02.Gal4 | |||
| Panel h | w;UAS.GCaMP6m;R95C02.Gal4 |
Driver lines expressed in specific tPNs cell types organized by pathway. Their nomenclature reflects their origin from either the Janelia Farm FlyLight initiative (R lines), or the ViennaTile project (VT lines). The identifier of each line contains a hyperlink to a high-resolution confocal stack at the FlyLight/ViennaTile databases. The localization of dendritic arborizations in the PAL was defined by transgenic expression of the dendritic marker DenMark, while putative pre-synaptic terminals in target regions were visualized by synaptotagmin:GFP expression (Abbreviations: MB, mushroom bodies; LH, lateral horn; PLP, Posterior lateral protocerebrum). The GRASP column summarizes the result of experiments performed with hot- or hot-and-cold LexA drivers (see Extended data figure 2 for details). ‘Hot’ or ‘Cold’ signifies that GRASP reconstitution was limited to the hot or cold glomerulus. ‘Hot and Cold’ denotes broad GFP reconstitution in the PAL. Colored spots denote the number of tPNs labeled by each driver and their tuning, such that a blue spot represents a single cell responding to cooling while a red spot represents a cell responding to heating. Purple spots are broadly tuned PNs. For tuning, cells are defined as hot- or cold-activated if they reliably respond to heating or cooling with average calcium increases of at least 50% DF/F at the onset of a rapid ~2-4°C ΔT stimulus (min. N>3 animals/5 cells) and with no significant calcium increases above noise in response to the opposite stimulus (min N>3 animals/5 cells). In all cases, we confirmed that the effect of temperature was significant (see methods). ‘Speed’ refers to the decay kinetics of their responses, and is shown as τ (see text and methods for details). Notice that a number of drivers are active in tPNs with different tuning properties but in no cases in both ‘fast-adapting’ and ‘slow-adapting’ cells – for this reason a single τ is shown for each driver, corresponding to responses from a variety of stimuli (N>10). (*) The R84E08 driver supports very low expression of G-CaMP6m. Responses from these cells were recorded at the PAL and appear to be slow (τ~4 seconds) but a better driver will be needed to describe in detail the response properties and dynamics of these tPNs.
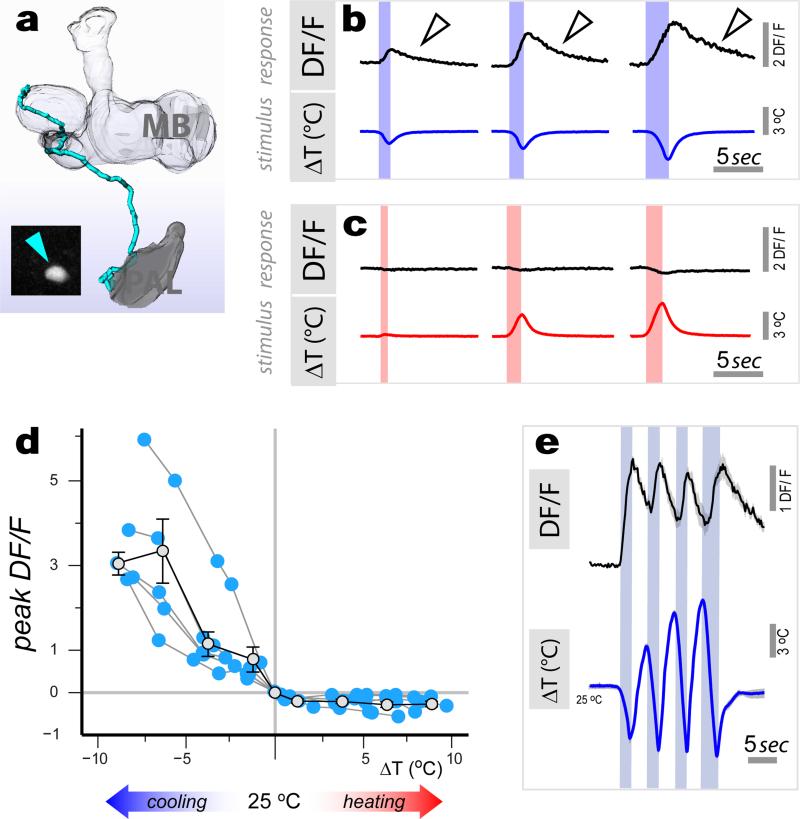
Thermoreceptor neurons in the antenna respond either to cooling or heating and define ‘labeled lines’ for temperature coding at the periphery1. Functional imaging studies revealed second-order neurons that were also selectively activated by either cooling or heating (i.e., ‘narrowly tuned’), and specifically connected to either the cold or hot TRs (as demonstrated by GRASP, ED Figure 2 and ED Table 1). For example, robust, sensitive responses to cooling were reliably observed from neurons innervating the cold-specific t5ALT pathway (Figure 2) and displaying selective GRASP with cold TRs (ED Figure 2, R60H12), while we recorded robust heating responses from cells innervating the lALT pathway and selectively GRASPing with hot TRs (VT46265; a full description of the properties of the various cell types is provided in ED Table 1).
Figure 2. Properties of slow-adapting, cold activated projection neurons.
(a) 3D reconstruction of a tPN that innervates the t5AL tract (expressing R60H12; cell body in inset). (b,c) Representative calcium-imaging traces from this tPN. Robust transients are seen in response to cooling stimuli of increasing magnitude (b), but not in response to heating (c). Notably, [Ca2+]i remains above baseline well after the end of cooling (arrowheads in b). (d) Stimulus-response plot (blue dots = peak response of a single cell to a defined stimulus, connected dots belong to the same cell, n=5 cells/5 animals. Grey dots = binned averages ±SEM ; bin width=2.5°C, bin at zero=0°C ΔT). Responses are proportional to cold- (R2=0.5, p<0.001; slope= −0.43, 95% CI= [−0.61 −0.25]), but not to hot stimuli (R2 p=n.s.) (e) [Ca2+]i does not return to baseline when cooling stimuli are rapidly interleaved with heating ones (black trace = average of 3 responses , 3 cells/3 animals ±SEM, in grey. Blue trace = average of the 3 stimuli ±SEM, grey).
Narrowly-tuned PNs could be categorized based on the decay profile of their calcium responses as either ‘slow-‘ or ‘fast-adapting’. ‘Slow-adapting’ tPNs -such as the cold-specific t5ALT tPN, responded to temperature stimuli with calcium transients that persisted during the stimulus and even after the temperature had returned to baseline (Figure 2b, arrowheads). As illustrated in Figure 2d, the peak responses of this cell type scaled with the magnitude of cooling stimuli over a wide range of intensities. Yet, as a consequence of slow decay, intracellular calcium did not return to baseline when cooling stimuli were rapidly interleaved (Figure 2e).
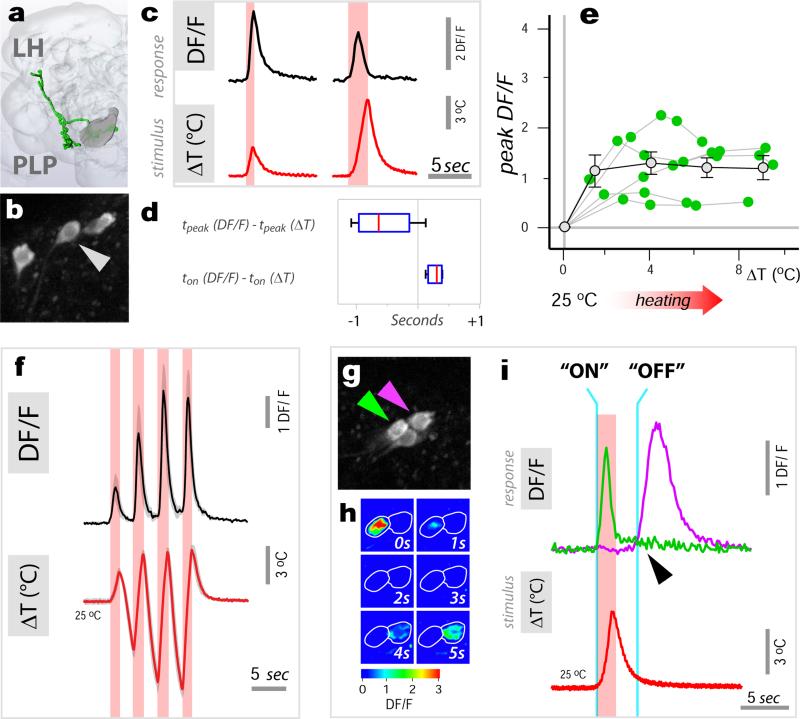
In contrast, ‘fast-adapting’ cells responded to temperature changes with a calcium transient which did not faithfully scale with stimulus intensity and which was followed by fast decay -as illustrated in Figure 3 for a hot tPN innervating the lateral pathway (Figure 3a-d; and see ED Figure 4 for a comparison of ‘fast-’ and ‘slow-adapting’ cold cells). As a result of fast kinetics, the peak response of this cell type generally preceded the stimulus peak (Figure 3d). In fact, for larger stimuli, intracellular calcium had nearly returned to the pre-stimulus baseline when the temperature was still rapidly changing (Figure 3c). Because of this, these ‘fast-adapting’ cells are unlikely to code information regarding the peak temperature of the stimulus (Figure 3e), yet they were able to track remarkably well a rapidly evolving temperature transient (Figure 3f).
Figure 3. Fast-adapting projection neurons display ON and OFF responses to temperature stimuli.
(a) ‘Fast adapting’ tPNs responding to either hot or cold innervate a lateral pathway (3D reconstruction in green). (b, c) A single cell in this cluster (expressing R95C02) displays rapid but transient responses to hot stimuli of different amplitude. Note that, for the larger stimulus, the response has already nearly returned to baseline while the temperature is still changing. (d) Box-plot showing the temporal difference between response and stimulus peak (‘tpeak’) and onset (‘ton’), respectively. Due to its transient nature, the responses often peaks before the stimulus (red line=median, blue box=25th and 75th percentiles, whiskers=data range; n=15 stimuli, ΔT =3.4±0.9, mean ±SD; 5 cells/5 animals). (e) Stimulus-response plot for defined heating stimuli (green dots = peak response of a single cell to a stimulus, connected dots belong to the same cell, n=5 cells/5 animals. Grey dots = binned averages ±SEM; bin width=2.5°C, bin at zero=0°C ΔT). Responses of this cell type do not correlate with stimulus intensity (R2 p=n.s.). (f) Yet this cell type tracks well a dynamic temperature stimulus (black trace = average of 3 responses , 3 cells/3 animals ±SEM, in grey. Red trace = average of the 3 stimuli ±SEM, grey). (g-i) The driver R95C02 is expressed in both hot- (green arrow in g and traces in i) and cold-activated tPNs (purple arrow in g and traces in i). (h) is a sequence of DF/F images of two cell bodies responding to a hot stimulus (ΔT~5°C, peaking at 0 sec., same cells as in g) while (i) shows single stimulus and response traces from the 2 cell bodies in g, recorded simultaneously. (i) The hot activated tPN responds to a heating stimulus with a rapid ‘ON’ transient, while the cold cell displays a delayed ‘OFF’ response.
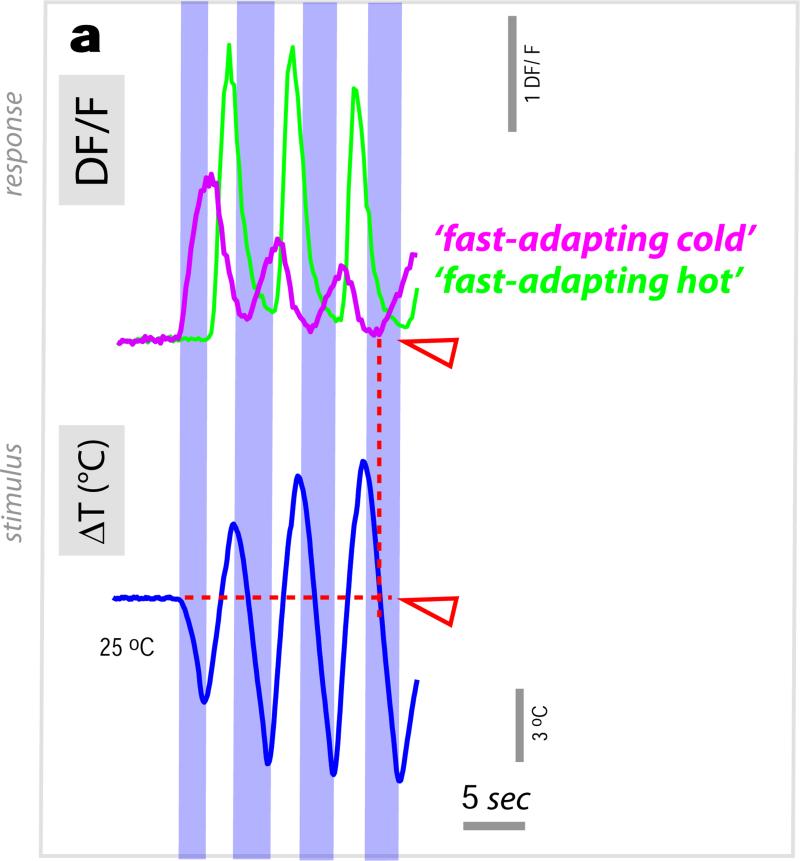
One of the drivers we identified is active in a group of 6 such ‘fast-adapting’ neurons, 4 of which are activated by cooling and 2 by heating, allowing one to simultaneously record the responses of both cell types under 2-photon microscopy. Our ‘hot’ stimuli consist of a heating pulse followed by cooling, which quickly brings the temperature back to baseline. As expected, we observed a transient calcium response in the hot-activated cell type at the beginning of the heating step (Figure 3g-i, “ON” response). Interestingly, the cold-activated cell type did not immediately respond at the onset of the following cooling phase (as would be expected for a simple cooling response), but rather with a significant delay, i.e. at the very end of the temperature transient when the temperature was again approaching baseline (“OFF” response, Figure 3i). Even in the midst of a rapidly varying temperature transient, “ON” and “OFF” cell responses alternated, with hot cells tracking the onset of heating, and cold cells becoming active when the temperature approached the 25°C baseline (ED Figure 5).
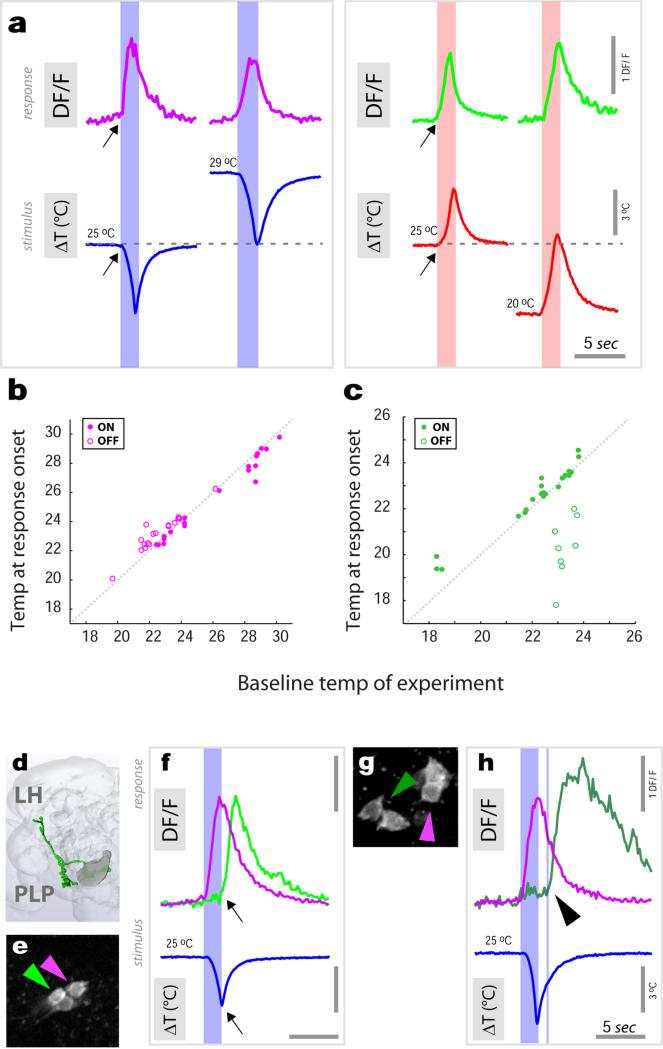
We note that the specific delay of “OFF” responses was observed only when cooling was preceded by heating, perhaps reflecting inhibitory interactions between hot and cold processing circuits. Furthermore, “OFF” responses coincided with the return to baseline even when this was systematically varied between ~20° and ~30°C (ED Figure 6). Hence, “OFF” responses appear to demarcate return to baseline after a rapid change, and might for example help the animal maintain course on a defined thermocline. Hot-activated PNs also displayed “OFF” responses during the heating phase that followed a cooling stimulus, but the amount of delay varied between cells (ED Figure 6).
Taken together, our results suggest that the distinct kinetics of slow and fast-adapting tPNs may tune each class to relay significantly different aspects of thermal stimuli to their targets: slow adapting neurons appear better suited to convey the magnitude of a temperature change, while fast adapting cells may better track its temporal structure (onset and offset).
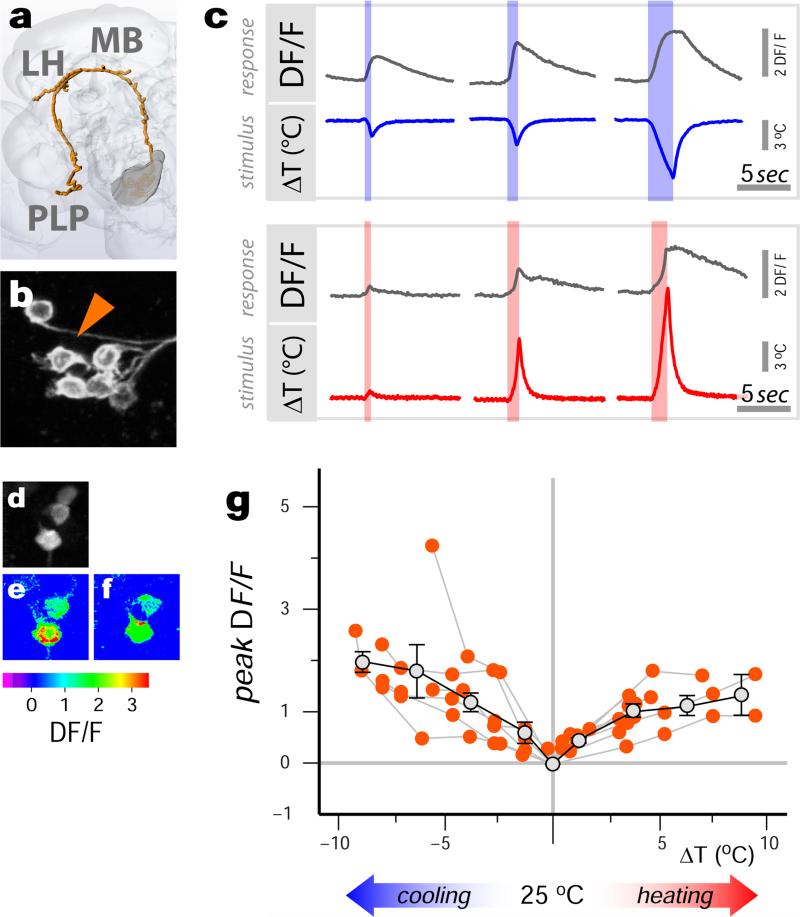
In addition to ‘narrowly tuned’ cells (i.e. responding to either hot or cold), we also discovered a significant class of ‘broadly tuned’ tPNs (Figure 4). Each neuron in this group displayed calcium transients in response to both heating and cooling, the peak of which correlated well with the stimulus intensity in either direction (Figure 4c, g). Unexpectedly, broadly tuned tPNs represented the largest group of cells we found (~10 cells, a significant number when compared to other PNs, see ED Table 1) and innervated all major targets we described (MB, LH and PLP). Therefore, these cells are likely to provide significant drive to higher order thermosensory regions during any temperature transient.
Figure 4. Broadly tuned thermosensory PNs respond to both heating and cooling stimuli.
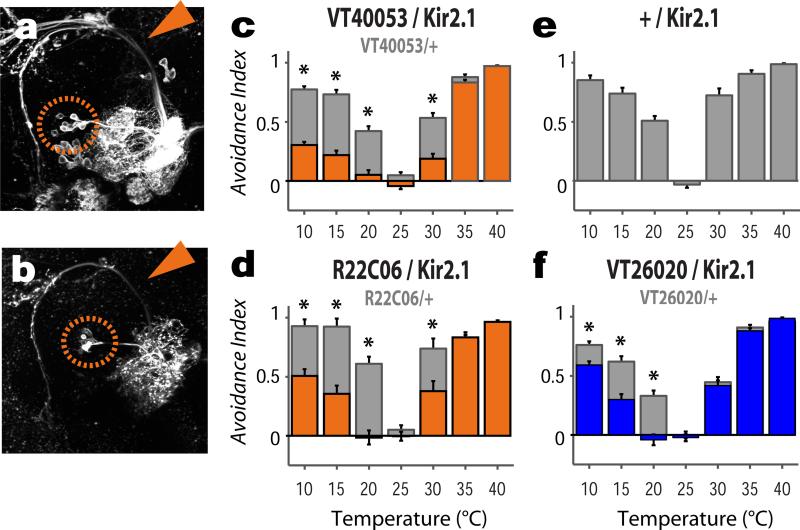
(a) 3D reconstruction of a broadly tuned tPN pathway (VT40053; cell bodies in b). (c) This cell type responds with transients of increasing magnitude to both cooling (upper panel) and heating stimuli (lower panel) of increasing intensity (shown are representative traces). (d-f) A maximum-response image clearly shows that the same neurons are capable of both cooling (e) and heating (f) responses (ΔT~±5°C). (g) Stimulus-response plot for defined heating and cooling stimuli (orange dots = peak response of a single cell to a stimulus, connected dots belong to the same cell, n=5 cells/5 animals. Grey dots = binned averages ±SEM ; bin width=2.5°C, bin at zero=0°C ΔT); the responses are proportional to the stimuli in both the cold and hot range (cold: R2=0.34, p<0.001; slope= -0.20, 95% CI= [−0.31 −0.09]; hot: R2=0.5, p<0.001; slope= 0.12, 95% CI= [0.07 0.17]).
What could be the function of this unusual cell type? We have previously shown that rapid temperature preference is mediated by the opposing pushes of heat- and cold-aversion1. One attractive hypothesis is that these neurons could represent a common “aversive” behavioral line. If this is the case, silencing their activity should dampen aversive responses to both hot and cold stimuli. To test this, we selected two drivers prominently expressed in these cells for functional studies: VT40053 is active in all the broadly tuned tPNs, but its expression also includes additional sensory circuits (Figure 5a). R22C06 is only expressed in about ½ of the broadly tuned cells, but in very few other cells in the brain or ventral nerve cord (Figure 5b, and see methods for a detailed description of these lines). Importantly, with the exception of tPNs, these two drivers show no overlap in expression.
Figure 5. Both broadly and narrowly tuned tPNs are required for rapid temperature avoidance in a 2-choice behavioral assay.
(a,b) The VT40053 (a) and R22C06 (b) drivers are prominently expressed in broadly tuned tPNs, as shown by GFP expression (cell bodies are circled; arrows=mALT). (c-d) Silencing this cell type produces flies with significant defects in both hot and cold avoidance in a 2-choice assay. (e) Shows the avoidance indices of control flies bearing the Kir2.1 construct but no driver. (f) Silencing 3 distinct cold-activated tPNs (expressing VT26020) results in a selective defect in cold avoidance (scores of the drivers alone are shown in c,d and f as grey bars; AI values were compared by 2-way ANOVA, asterisks denote a significant interaction between the Gal4 and UAS transgenes, p<0.01; bars=mean ±SEM; The number of biological replicates is in parentheses next to each genotype).
Driving Kir2.112 (i.e. silencing neural activity by hyperpolarization) under the control of either line resulted in a significant decrease in the avoidance of both cold and hot regimes in a rapid 2-choice test1 (Figure 5c,d), demonstrating that this pathway is indeed required for rapid temperature preference. In contrast, expression of Kir2.1 under the control of a driver active in 3 distinct cold-activated tPNs also innervating the mALT pathway (VT26020, see ED Figure 7 and methods for details), produced an avoidance defect that was highly selective for cold temperatures (Figure 5f), suggesting that both narrowly- and broadly-tuned tPNs participate in temperature preference. We note that flies in which broadly tuned tPNs were inactivated still avoided hot temperatures at the upper limit of their tolerance range (>35°C, Figure 5), indicating that their locomotor/navigational programs are intact, and that the avoidance of high temperatures likely involves additional circuit components.
We define here a circuit diagram for the representation of temperature in the Drosophila brain (ED Figure 8). ‘Hubs’ of this circuit are the PAL, where the activity of hot and cold glomeruli initially signals a temperature change, and the triad of MB, LH and PLP, where thermosensory stimuli are richly represented by an array of differently tuned projection neurons. Taken together, our results demonstrate that substantial processing of thermosensory input at a single synaptic step can extract information about the sign, onset, magnitude and duration of a temperature change, and establish a framework to understand how complex temperature responses, often happening on different time scales, can be orchestrated starting from a simple sensory map.
METHODS AND ADDITIONAL METHODS REFERENCES
Experimental animals and transgenes
The following transgenic flies were constructed for this study: GR28b.d-LexA, expressing LexA under a promoter element active in hot receptor neurons13,14. IR94a-LexA, from a promoter expressed in both hot and cold cells (additionally expressed in a small number of olfactory sensory neurons15). Aop-syb:spGFP 1-10, a split-GFP 1-10 fragment targeted to pre-synaptic sites by fusion to the cytoplasmic domain of synaptobrevin, for GRASP8 (Macpherson and Gallio, manuscript under review, and see16). Additional transgenic lines: Aop-CD4:spGFP 1-10, UAS-CD4:spGFP 119 (a gift from K. Scott); UAS-SPA2, UAS-C3PA2, MB-DsRed, syb-Gal4 (all a gift from Barbara Noro and Vanessa Ruta); UAS-Kir2.112, UAS-CD8:GFP, Aop-Tdtomato6, Aop-CD2:GFP, UAS-GCaMP6m17, UAS-DenMark10, UAS-syt:GFP11. Gal4 driver lines were obtained from the Bloomington Stock center or VDRC.
2-photon guided conversion of photo-activatable GFP in PAL Glomeruli
To visualize axonal projections arising from the PAL, we used 2-photon guided conversion of PA-GFP following the protocol of Ruta et al.2 All imaging was conducted on a Prairie Ultima 2-photon microscopy system equipped with a Coherent Chameleon Ti:Sapphire laser, GaAsP PMT, and an Olympus 40× 0.9NA or 60× 1.1NA water immersion objective. In brief, we labeled hot TR terminals alone or both hot and cold ones by expression of fluorescent proteins (tdTomato6 or GFP; under LexA, see above). We dissected 2-4 days old adult flies, and defined 3D ROIs around selected glomeruli while imaging at 945nm (a wavelength that does not activate PA-GFP). Finally, the laser was tuned to 720nm and the volume scanned at low power (10-30 mW, measured at the back aperture of the objective) 30 times interleaved by 30s wait periods. A ~15 minutes rest allowed diffusion of photo-converted PA-GFP.
Nomenclature of brain regions and 3D reconstruction of axonal pathways
All efforts were taken to adhere to the standardized insect brain nomenclature described in Ito et al., 2014. The area defined by the glomeruli formed by hot and cold sensory neurons (previously referred to as the PAP1), is here referred to as the Posterior Antennal Lobe (PAL), as the two regions have been now merged. Indeed, the projections of arista neurons were first described by Stocker et al. 1990 as targeting the posterior AL18 (glomeruli VP2 and VP3). Interestingly, our analysis revealed an additional glomerulus close to the PAL (likely VP1) that is innervated by cold-responding sacculus neurons (data not shown). However it was also activated by non-thermal stimuli and therefore excluded from further analysis. The mAL, mlAL, lAL fiber tracts were described in Ito et al. 20144. The transverse 3AL and 5AL tracts have been described in Tanaka et al. 201219 and Jenett et al. 20127, respectively. 3D reconstructions of axonal tracts (Figure 1) were carried out on 3D brain volumes pre-aligned to a standard brain, available through BrainBase20. Semi-automated neurite reconstruction was carried out by AMIRA on representative ViennaTile driver lines, and information from PA-GFP experiments and additional driver lines used to refine neurite models by hand. Automated annotation of the projections of driver lines in FlyLight and/or BrainBase directly suggested innervation of target regions (MB, LH and PLP) based on volume reconstructions. We adopted this nomenclature (even when, for example in the case of the LH, tPNs innervation appears confined to the LH margin), and confirmed the presence of putative pre-synaptic terminals by expression of syt:GFP (Extended data figure 3). 3D reconstructions of the MB and LH shown in extended data Figure 3 were carried out in AMIRA based on the nc82/bruchpilot staining of the standard brain; because the boundaries of the PLP could not be easily defined in nc82/bruchpilot staining, the PLP was not reconstructed but is shown as an outline.
GRASP, Denmark and syt:GFP visualization and staining
Native GRASP fluorescence was visualized at the synapses between hot, and hot and cold receptor neurons and their potential projection neurons in the PAL using 2-photon microscopy of 2-4 day old adult dissected fly brains. Immunofluorescence of GRASP was performed on 4% PFA-fixed brains using antibodies which specifically either bind to reconstituted GRASP9: mouse-anti-GFP (1:100; Sigma, cat# G6539), or that preferentially recognizes spGFP10: chicken anti-GFP (1:1000, abcam#13970). To determine the polarity of tPNs, and identify putative pre-synaptic termini, we expressed under the control of tPN Gal4 lines either the red fluorescent dendritic marker DenMark10 or a synaptotagmin:GFP11 fusion, respectively and visualized native fluorescence by confocal (DenMark) or 2-photon (syt:GFP) microscopy.
Functional calcium imaging of tPN responses to temperature stimuli
Our calcium imaging and temperature stimulation setup has been previously described in detail1. In brief, UAS.GCaMP6m flies or intact fly heads were submerged in AHL3 and sufficient cuticle surrounding the brain was delicately removed to provide optical access to the PNs. The preparation was then placed in a custom-built microfluidics chamber, covered with a plastic coverslip, and placed on the 2-photon microscope stage. Rapid temperature changes were achieved by controlling the temperature of the medium via a custom-built system consisting of a series of 3-way valves (Lee Instruments, response time 2ms) and Peltier elements independently controlling baseline, ‘hot’, and ‘cold’ flow – respectively. ‘Complex’ stimuli (Figures 2, 3, and extended data figure 5) were obtained by actuating the control valves using a sequence of TTL pulses to alternate between ‘hot’ flow and ‘cold’ flow. The delay between valve trigger and onset of ΔT was a function of tubing length, 1-2 seconds. Baseline experiments (extended data figure 6) were done by adjusting the temperature of baseline flow and allowing the preparation to adapt to it for ~1 minute before recordings. We used rapid heating and cooling pulses1 (~2°C/second), as this regime closely approximates what the fly might encounter during a navigational saccade. Temperature was recorded using a BAT-12 electronic thermometer (time constant 0.004 s, accuracy 0.01 °C, Physitemp). Images were acquired at 256×256 pixel resolution at a rate of 4Hz on a Prairie Ultima 2-photon microscope equipped with a Coherent Chameleon Ti:Sapphire laser, GaAsP PMT, and an Olympus 40× 0.9NA or 60× 1.1NA water immersion objective. DF/F analysis was carried out using custom scripts in MatLab, base fluorescence was calculated using all frames preceding valve trigger (occurring at 5s). All recordings were from cell bodies unless otherwise specified. To extract the ‘onset’ of a given response (Figure 3e, extended data figure 5b,c) we wrote a script that identifies the first sequence of 3 data points in the trace all of which are 2 standard deviations above average background (‘noise’, calculated from all data points preceding valve trigger); the first point in this sequence was used as ‘onset’ and mapped on the corresponding timestamp. Temperature was recorded at the fly head during each experiment, and was synchronized with imaging by starting the temperature recording and image acquisition by the same trigger signal. As the recording of the two variables was synchronous (and the distance of the thermo probe from the fly head small and relatively constant), we generally observed good time-locking between response and stimulus onset. To calculate decay constants of ‘fast’ and ‘slow’ responses (τ) we confirmed that the cellular response data fit an exponential decay function, and measured the time from peak to 1/e (~37%) of peak value.
Dose-response statistics
Each point in the dose-response plots (Figures 2d, 3e and 4g) represents the peak response of one cell body to one presentation of a given temperature change, as in the corresponding representative traces shown (Figures 2b, 3c and 4c). The same cell is challenged with a set of 5-10 stimuli and the resulting responses are connected by a line (N=5 cells/5 animals). For each cell type, we confirmed that the effect of temperature was significant as follows: the bin at zero contains the ‘responses’ recorded in control experiments ([Ca2+]i maxima of traces acquired to control for valve artifacts, i.e. triggering the valve system without feeding power to the Peltier elements; ΔT=0). We performed 2 sample t-tests comparing the zero bin against binned responses to temperature stimuli of ~0.5-3 °C (for all cell types p<0.05). We then calculated regression and slope statistics on all data points across individual flies to test whether the responses were proportional to stimulus intensity (see legends).
2-choice behavioral assays for temperature preference
The 2-choice assay for temperature preference has been described before1. Briefly, 20 3-5 days old flies were ice-anesthetized and placed in an arena consisting of four 1” square, individually addressable Peltier tiles. In each trial, flies were presented for 3 min. with a choice between 25°C and a test temperature between 10° and 40°C at 5°C intervals, and the position of flies was recorded during each trial (by a BASLER A601FM camera) to calculate an avoidance index for each test temperature (AI = #flies at 25C - #flies at test temp) / total # flies). AI values for each genotype were compared by 2-way ANOVA, and asterisks in Figure 5 denote a statistically significant interaction between the Gal4 and UAS transgenes (threshold p = 0.01, N > 18 biological replicates, see figure for specific Ns). Kolmogorov-Smirnov tests were used to confirm a normally distributed sample. Homogeneity of variance for each data set was confirmed by calculating the Spearman correlation (ρ) between the absolute values of the residual errors and the observed values of the dependent variable (threshold p = 0.05). Statistical analysis was carried out in MATLAB; sample sizes were chosen to reliably measure experimental parameters. Experiments did not involve randomization or blinding. The driver VT40053 is expressed in nearly all the broadly tuned tPNs that we have observed (~10) but its expression also includes 1 cold activated tPN, olfactory PNs19, fibers targeting auditory centers21, as well as sensory projections from the taste system22 (see http://brainbase.imp.ac.at/). In contrast, R22C06 is selectively expressed in a small group of PNs projecting to the antennal lobe: a subset of the broadly tuned tPNs (5-6), 1-2 cold activated tPNs and 1-2 olfactory PN, but no other cell in the brain (and only 2 neurons in the ventral nerve cord). VT26020 is expressed in 3 cold-activated tPNs innervating the mALT whose axons do not descend to the PLP (see extended data figure 2d, e and 6). Expression is also prominent in taste and auditory centers.
Extended Data
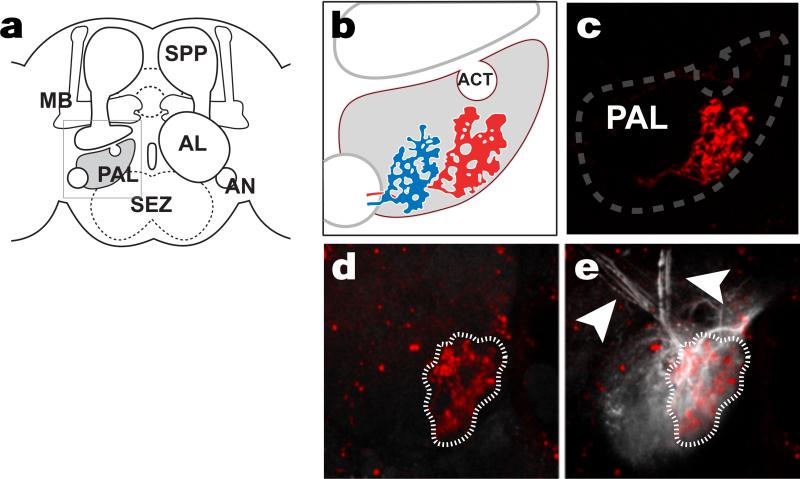
Extended data Figure 1. Targeted photo-conversion of PA-GFP reveals candidate tPN pathways.
(a) Diagram of the fly brain showing the location of the PAL. (b) Schematic diagram showing the expected location of ‘cold’ and ‘hot’ glomeruli (blue and red, respectively). (c-e) The hot glomerulus is visualized by tdTomato, driven by Gr28b.d-LexA (red). (e) Targeted photo activation of pan-neuronal PA-GFP (syb-Gal4/UAS-SPA) reveals ascending pathways (white arrows). d and e are imaged under the same conditions, before (d) and after (e) photoconversion. Anatomical abbreviations: MB=Mushroom Body, PAL=Posterior Anennal Lobe, SEZ=Sub Esophageal Zone, AL=Antennal Lobe, AN=Antennal Nerve, SPP=Super Peduncular Protocerebrum.
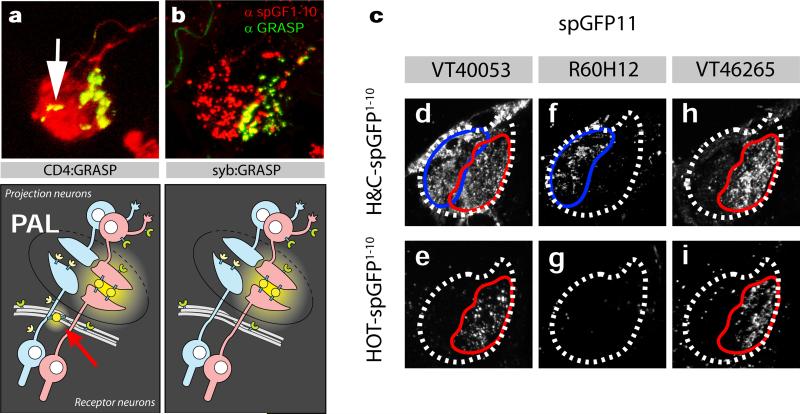
Extended data Figure 2. Synaptic-targeted GFP-reconstitution across synaptic partners (GRASP) reveals specific connectivity patterns between antennal TRs and tPN classes.
Using an n-synaptobrevin fragment to target spGFP1-10 to the pre-synaptic membrane (see methods), increases the specificity of GRASP fluorescence at synapses between thermosensory neurons and projection neurons in the PAL. (a) Immunofluorescence staining of GRASP contacts between hot and cold receptor neurons (IR94a-LexA, Aop-CD4:spGFP1-10) and projection neurons (VT46265, UAS-CD4:spGFP11), shows diffuse expression of spGFP1-10 throughout the membranes of the hot and cold receptor neurons (red), in addition to the GRASP signal at the synapses between hot cells and VT46265 projection neurons (green). Some non-synaptic GRASP fluorescence is seen at sites of contact between the receptor neurons and fibers of passage (arrows in a, and see cartoon below for illustration). In contrast, synaptically-targeted syb:GRASP (b) shows punctate expression of syb-spGFP1-10 (red) and specific GRASP signal (green) only at the hot-cell synapses of the PAL. (c) Representative native GRASP fluorescence between either (d,e,h) hot and cold thermosensory receptors (TRs, IR94a-LexA; Aop-CD4:spGFP1-10), or hot only TRs (e,g,i, GR28b.d-LexA; Aop-syb-spGFP1-10) onto three projection neuron types (VT40053, R60H12, and VT46265 - each driving UAS-CD4:spGFP11). GRASP connectivity corresponds well to their tuning (see text and Extended data Table 1 for details).
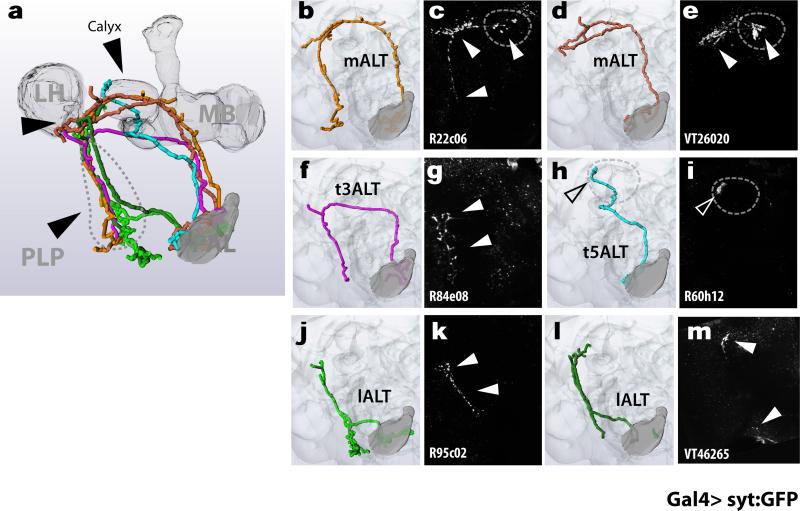
Extended data Figure 3. Target regions of tPN cell types.
Transgenic expression of synaptotagmin:GFP reveals the location of putative pre-synaptic termini for each of the identified tPN cell types. (a) 3D reconstruction of key target regions (the MB and LH, based on nc82 staining) showing their relationship to the tPN pathways (color and abbreviations are as in main Figure 1, note that the boundaries of the PLP are not clearly demarcated by nc82 staining, hence the PLP was not reconstructed but outlined -see methods for details). (b,d,f,h,j,l) 3D reconstructions of specific tPN pathways and (c,e,g,i,k,m) 2-photon stacks of brains expressing synaptotagmin:GFP under the control of Gal4 drivers expressed in neurons innervating such pathways (the driver name appears at the bottom of each panel). GFP fluorescence identifies putative pre-synaptic structures in the target regions (arrowheads). In (c,e) and (i) the MB Calyx is circled.
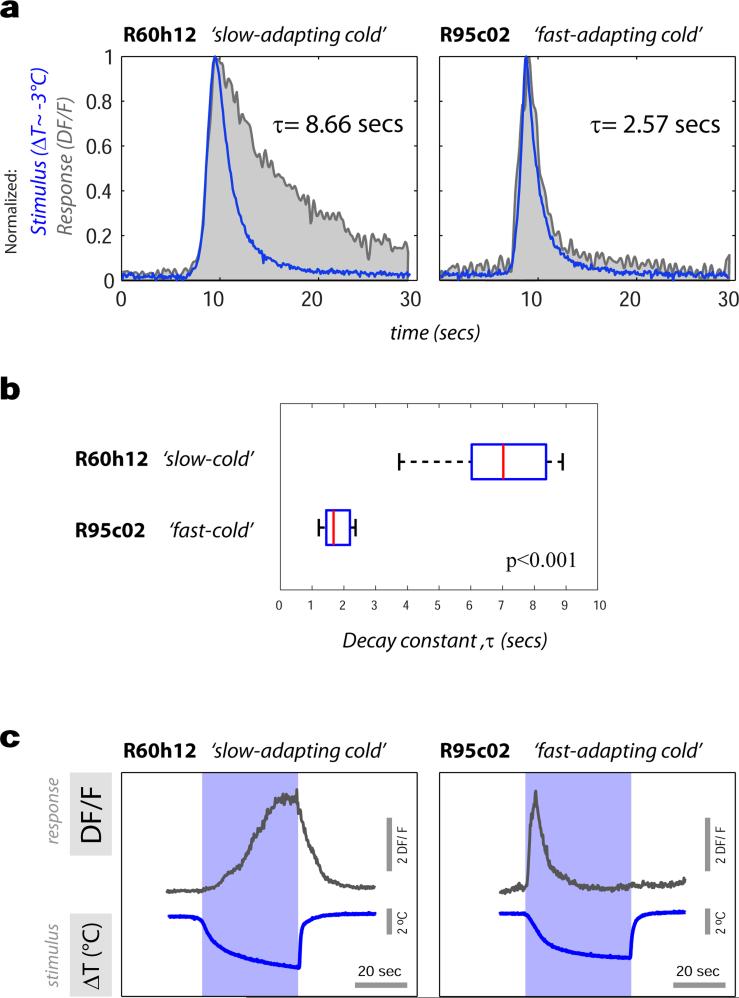
Extended data Figure 4. Temporal dynamics of slow and fast-adapting cold-activated tPNs.
Calcium transients of slow- and fast-adapting cold-activated tPNs differ significantly in the speed of decay. (a) The response of a ‘fast’ tPN (right plot, grey trace) returns to baseline much more rapidly than that of a ‘slow’ one (left plot, grey trace). In (a) a small cooling stimulus and the response it elicited in a representative cell are normalized and overlaid to facilitate comparison of dynamics (note that the sign of cooling stimuli is inverted for clarity, ΔT~ −3°C, Responses are DF/F recorded at cell bodies, stimuli and responses are recorded synchronously –see methods for details). The decay constant of each response is shown next to each plot (τ, defined as the time from peak to 1/e ~37% of peak value). (b) Decay constants of ‘slow ’ and ‘fast’ cold tPN responses to a range of cold stimuli are systematically different (boxplot: red line=median, blue box=25th and 75th percentiles, whiskers=data range; p<0.001, t-test; ΔT=2.91±0.75, mean ±SD; N=16 stimuli, N=7 slow cells, 9 fast cells). In (c) a larger cooling stimulus and the response it elicited in a representative ‘slow-adapting’ and ‘fast-adapting’ cell are shown side-by-side to facilitate comparison. Note that the ‘slow-adapting’ cell displays a persistent response that lasts as long as the cooling stimulus. In contrast, as a consequence of faster decay, the response of a ‘fast-adapting’ cell returns to the pre-stimulus baseline when the temperature is still changing.
Extended data Figure 5. “ON” and “OFF” responses amidst a complex temperature stimulus.
(a) ‘Fast-adapting cold’ (purple trace) and ‘fast-adapting hot’ cells (green trace) track remarkably well a dynamic temperature transient, displaying alternating “ON” and “OFF” responses. The ‘cold’ cell type (purple trace) displays a significantly delayed response whenever a cooling phase is preceded by heating. Notably, ‘cooling’-responses following a heating step begin when the temperature has nearly returned to baseline (red arrowheads in a, referred to as “OFF” responses, see main text). Shown here is a representative single stimulus and corresponding response traces simultaneously recorded from adjacent cell bodies; Genotype: R95C02/UAS-GCaMP6m).
Extended data Figure 6. “ON” and “OFF” responses of fast tPNs are not limited to a defined range of absolute temperature.
To better understand the nature of “ON” and “OFF” responses, we tested whether the dynamic activity of fast-adapting cells was limited to a defined range of absolute temperatures by delivering defined heating and cooling stimuli from a range of baseline temperatures. (a) “ON” responses from cold (purple traces) and hot (green traces) cells recorded from a 25°C baseline and from a higher (29°C) or lower (20°C) baseline, respectively (shown are representative single stimuli and corresponding response traces recorded from cell bodies). (b,c) The activity of fast tPNs is not restricted to a narrow temperature band as evident by plotting the absolute temperature corresponding to response onset (see arrows in a) against the baseline temperature for ‘fast-adapting cold’ (b) and ‘fast-adapting hot’ (c) cells, challenged with a range of hot and cold stimuli (ΔT 2-7°C; Cooling ΔT = −4.7±1.9°C, Heating ΔT = 4.6 ±2°C, mean ±SD; N>10 cells/>10 animals per cell type). In (b, c) filled purple and green dots represent “ON” responses while empty circles represent “OFF” responses. Due to their specific delay, the “OFF” responses of cold cells start at the very end of a hot stimulus, (i.e. when the temperature has nearly returned to baseline Tonset – Tbaseline = 0.68 ± 0.43°C, mean ±SD; ); in contrast, hot cells respond at or near the start of the heating phase that follows a cold stimulus (see below) and, as a result, systematically at a lower temperature than baseline (Tonset – Tbaseline = −2.97 ± 1.15°C, mean ±SD; note that this value is significantly different than the one calculated for cold cells, p<0.001, t-test). (d-h) ‘Fast-adapting’ hot cells innervating the lateral pathway display “OFF” responses whose delay varies by cell (d,e). A pair of adjacent hot-activated (green arrow and trace) and cold-activated (purple arrow and trace) tPNs innervating the lateral pathway (3D reconstruction in d, cell bodies in e; same cells and color coding as in main Figure 3). (f) The cold- activated tPN responded to cooling stimuli with a rapid ‘ON’ transient. The hot activated cell in this pair displayed a calcium transient that was not delayed, i.e. started immediately with the heating phase that followed the cooling stimulus (light green trace). (g,h) In contrast, a different ‘fast hot’ cell type in the same cluster (dark green circle and trace) displayed a delayed response (arrowhead), similar to the delayed “OFF” response reported for cold activated tPNs at the end of a heating stimulus (see main Figure 3).
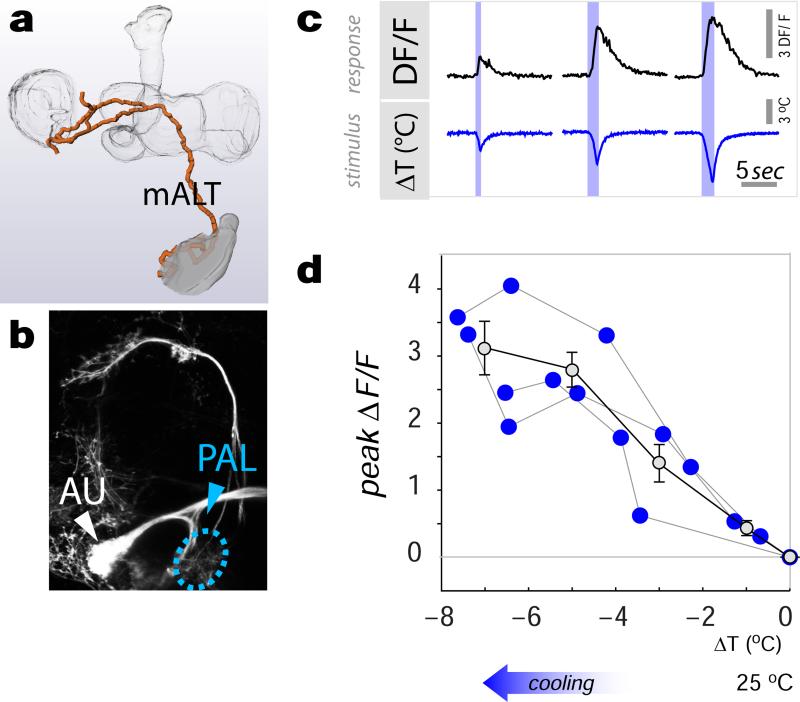
Extended data figure 7. Cold-specific of tPNs innervating the mALT.
(a-d) A distinct group of cold-activated tPNs follows the mALT and innervates the MB and LH (represented by a 3D reconstruction). (b) The driver VT26060 is active in 3 neurons innervating this pathway (as well showing prominent expression in auditory centers, AU, see methods for details- PAL=posterior antennal lobe, the approximate position of the cold glomerulus is circled; genotype= VT26060-Gal4/UAS-CD8:GFP). (c) Representative calcium-imaging traces from a single cell body displaying robust transients in response to cooling stimuli of increasing magnitude (-note that these cells do not show activation in response to heating). (d) Stimulus-response plot showing the responses of this cell type to defined cooling stimuli recorded at the cell body. The responses are proportional to cold stimuli over a wide range of intensities (R2=0.8, p<0.001; slope= −0.45, 95% CI= [−0.57 −0.33]; regression and slope statistics were calculated on all data points across individual flies). Each blue dot represents the maximal response of a single cell to a defined stimulus, dots are connected when the responses belong to the same cell, n=3 cells/3 animals. Grey dots represent binned averages ±SEM (bins=2°C; Genotype: VT26060-Gal4 / UAS-GCaMP6m).
Extended data figure 8. Cold-specific tPNs innervating the mALT.
Summary of the array of tPN pathways mediating temperature representation in the fly brain, their properties, and target regions. Multiple pathways carry specific information about stimulus quality (hot and cold) to the MB, LH and PLP. Most tPNs innervating these pathways are narrowly tuned, responding to either hot or cold stimuli, but a prominent group of cells is capable of responding to both heating and cooling temperature stimuli (‘broadly tuned’). Moreover, response dynamics of tPNs are strikingly different, allowing a classification of tPN responses in ‘slow’ vs ‘fast’ adapting.
ACKNOWLEDGMENTS
We thank Vanessa Ruta and Barbara Noro for providing PA-GFP flies and reagents, and especially Gerry Rubin for providing access to the FlyLight collection before publication. We are grateful to Nick Ryba, David Yarmolinsky, Charles Zuker and members of the Gallio lab for critical comments on the manuscript. Zeynep Turan and Andrew Kuang provided technical assistance and we thank Cameron Ulmer and a number of undergraduate students for fly husbandry. This work was supported by NIH grant 1R01NS086859-01 (to MG) and by training grant 2T32MH067564 (to DDF).
Footnotes
The authors declare no competing financial interests.
AUTHOR CONTRIBUTIONS:
MG and DDF designed the study, carried out the imaging experiments, analyzed data (with help from GCJ), and wrote the paper; DDF, GCJ and MG ran and analyzed all behavioral experiments; PJK carried out GRASP experiments using transgenic lines produced by MG and LJM.
SUPPLEMENTARY INFORMATION LINE:
Supplementary information is linked to the on-line version of the paper at www.nature.com
REFERENCES
- 1.Gallio M, Ofstad TA, Macpherson LJ, Wang JW, Zuker CS. The coding of temperature in the Drosophila brain. Cell. 2011;144:614–624. doi: 10.1016/j.cell.2011.01.028. doi:10.1016/j.cell.2011.01.028. [DOI] [PMC free article] [PubMed] [Google Scholar]
- 2.Ruta V, et al. A dimorphic pheromone circuit in Drosophila from sensory input to descending output. Nature. 2010;468:686–690. doi: 10.1038/nature09554. doi:10.1038/nature09554. [DOI] [PubMed] [Google Scholar]
- 3.Wang JW, Wong AM, Flores J, Vosshall LB, Axel R. Two-photon calcium imaging reveals an odor-evoked map of activity in the fly brain. Cell. 2003;112:271–282. doi: 10.1016/s0092-8674(03)00004-7. [DOI] [PubMed] [Google Scholar]
- 4.Ito K, et al. A systematic nomenclature for the insect brain. Neuron. 2014;81:755–765. doi: 10.1016/j.neuron.2013.12.017. doi:10.1016/j.neuron.2013.12.017. [DOI] [PubMed] [Google Scholar]
- 5.Datta SR, et al. The Drosophila pheromone cVA activates a sexually dimorphic neural circuit. Nature. 2008;452:473–477. doi: 10.1038/nature06808. doi:10.1038/nature06808. [DOI] [PubMed] [Google Scholar]
- 6.Shaner NC, et al. Improved monomeric red, orange and yellow fluorescent proteins derived from Discosoma sp. red fluorescent protein. Nat Biotechnol. 2004;22:1567–1572. doi: 10.1038/nbt1037. doi:10.1038/nbt1037. [DOI] [PubMed] [Google Scholar]
- 7.Jenett A, et al. A GAL4-driver line resource for Drosophila neurobiology. Cell reports. 2012;2:991–1001. doi: 10.1016/j.celrep.2012.09.011. doi:10.1016/j.celrep.2012.09.011. [DOI] [PMC free article] [PubMed] [Google Scholar]
- 8.Feinberg EH, et al. GFP Reconstitution Across Synaptic Partners (GRASP) defines cell contacts and synapses in living nervous systems. Neuron. 2008;57:353–363. doi: 10.1016/j.neuron.2007.11.030. [DOI] [PubMed] [Google Scholar]
- 9.Gordon MD, Scott K. Motor control in a Drosophila taste circuit. Neuron. 2009;61:373–384. doi: 10.1016/j.neuron.2008.12.033. [DOI] [PMC free article] [PubMed] [Google Scholar]
- 10.Nicolai LJ, et al. Genetically encoded dendritic marker sheds light on neuronal connectivity in Drosophila. Proc Natl Acad Sci U S A. 2010;107:20553–20558. doi: 10.1073/pnas.1010198107. doi:10.1073/pnas.1010198107. [DOI] [PMC free article] [PubMed] [Google Scholar]
- 11.Zhang YQ, Rodesch CK, Broadie K. Living synaptic vesicle marker: synaptotagmin-GFP. Genesis. 2002;34:142–145. doi: 10.1002/gene.10144. doi:10.1002/gene.10144. [DOI] [PubMed] [Google Scholar]
- 12.Baines RA, Uhler JP, Thompson A, Sweeney ST, Bate M. Altered electrical properties in Drosophila neurons developing without synaptic transmission. J Neurosci. 2001;21:1523–1531. doi: 10.1523/JNEUROSCI.21-05-01523.2001. [DOI] [PMC free article] [PubMed] [Google Scholar]
- 13.Thorne N, Amrein H. Atypical expression of Drosophila gustatory receptor genes in sensory and central neurons. J Comp Neurol. 2008;506:548–568. doi: 10.1002/cne.21547. doi:10.1002/cne.21547. [DOI] [PubMed] [Google Scholar]
- 14.Ni L, et al. A gustatory receptor paralogue controls rapid warmth avoidance in Drosophila. Nature. 2013;500:580–584. doi: 10.1038/nature12390. doi:10.1038/nature12390. [DOI] [PMC free article] [PubMed] [Google Scholar]
- 15.Benton R, Vannice KS, Gomez-Diaz C, Vosshall LB. Variant ionotropic glutamate receptors as chemosensory receptors in Drosophila. Cell. 2009;136:149–162. doi: 10.1016/j.cell.2008.12.001. doi:10.1016/j.cell.2008.12.001. [DOI] [PMC free article] [PubMed] [Google Scholar]
- 16.Karuppudurai T, et al. A hard-wired glutamatergic circuit pools and relays UV signals to mediate spectral preference in Drosophila. Neuron. 2014;81:603–615. doi: 10.1016/j.neuron.2013.12.010. doi:10.1016/j.neuron.2013.12.010. [DOI] [PMC free article] [PubMed] [Google Scholar]
- 17.Chen TW, et al. Ultrasensitive fluorescent proteins for imaging neuronal activity. Nature. 2013;499:295–300. doi: 10.1038/nature12354. doi:10.1038/nature12354. [DOI] [PMC free article] [PubMed] [Google Scholar]
- 18.Stocker RF, Lienhard MC, Borst A, Fischbach KF. Neuronal architecture of the antennal lobe in Drosophila melanogaster. Cell and tissue research. 1990;262:9–34. doi: 10.1007/BF00327741. [DOI] [PubMed] [Google Scholar]
- 19.Tanaka NK, Endo K, Ito K. Organization of antennal lobe-associated neurons in adult Drosophila melanogaster brain. J Comp Neurol. 2012;520:4067–4130. doi: 10.1002/cne.23142. doi:10.1002/cne.23142. [DOI] [PubMed] [Google Scholar]
- 20.Bruckner S, et al. BrainGazer--visual queries for neurobiology research. IEEE transactions on visualization and computer graphics. 2009;15:1497–1504. doi: 10.1109/TVCG.2009.121. doi:10.1109/TVCG.2009.121. [DOI] [PubMed] [Google Scholar]
- 21.Lai JS, Lo SJ, Dickson BJ, Chiang AS. Auditory circuit in the Drosophila brain. Proc Natl Acad Sci U S A. 2012;109:2607–2612. doi: 10.1073/pnas.1117307109. doi:10.1073/pnas.1117307109. [DOI] [PMC free article] [PubMed] [Google Scholar]
- 22.Wang Z, Singhvi A, Kong P, Scott K. Taste representations in the Drosophila brain. Cell. 2004;117:981–991. doi: 10.1016/j.cell.2004.06.011. doi:10.1016/j.cell.2004.06.011. [DOI] [PubMed] [Google Scholar]


