

Abstract
Cytochrome P450 2E1 (CYP2E1) induction and oxidative metabolism of ethanol in hepatocytes inflames and damages liver. Chronic ethanol ingestion also induces kidney dysfunction, which associates with mortality of alcoholic hepatitis. Whether kidney is directly affected by ethanol or is secondary to liver damage is not established. We found CYP2E1 was induced in kidney tubules of mice chronically ingesting a modified Lieber-deCarli liquid ethanol diet. Phospholipids of kidney tubules were oxidized and fragmented in ethanol fed mice with accumulation of azelaoyl phosphatidylcholine (Az-PC), a non-biosynthetic product formed only by oxidative truncation of polyunsaturated phosphatidylcholine. Az-PC stimulates the inflammatory PAF receptor (PTAFR) abundantly expressed by neutrophils and kidney tubules, and inflammatory cells and myeloperoxidase-containing neutrophils accumulated in kidney of ethanol fed mice after significant hysteresis. Decreased kidney filtration and induction of the Acute Kidney Injury biomarker KIM-1 in tubules temporally correlated with leukocyte infiltration. Genetic ablation of PTAFR reduced accumulation of PTAFR ligands, and reduced leukocyte infiltration into kidney. Loss of this receptor in PTAFR−/− mice also suppressed oxidative damage and kidney dysfunction without affecting CYP2E1 induction. Neutrophilic inflammation was responsible for ethanol-induced kidney damage because loss of neutrophil myeloperoxidase in MPO−/− mice was similarly protective. We conclude ethanol catabolism in renal tubules results in a self-perpetuating cycle of CYP2E1 induction, local PTAFR ligand formation, neutrophil infiltration and activation that leads to myeloperoxidase-dependent oxidation and damage to kidney function. Hepatocytes do not express PTAFR, so this oxidative cycle is a local response to ethanol catabolism in kidney.
Keywords: Reactive Oxygen Species, Kidney, Inflammation, Acute Kidney Injury, Oxidized Phospholipids, Free Radicals, PAF Receptor
Graphical abstract
Introduction
Alcohol abuse is common—estimated at 8% of the population—among adult Americans [1]. Liver is the primary site of ethanol catabolism, and chronic ethanol ingestion and metabolism induces fatty liver in nearly all heavy drinkers. Liver disease progresses to steatohepatitis in a third of this population and then progresses to cirrhosis and hepatocellular carcinoma in a smaller subset of patients [2]. Kidney dysfunction is common in alcoholic cirrhosis, and associates with nearly all of the mortality of hospitalized patients with severe alcoholic hepatitis [3]. Chronic alcoholism additionally associates with chronic kidney disease [4–6]. The common perception is that kidney damage must be secondary to liver injury since this is the major site of ethanol catabolim, but this is unproven.
The enzyme cytochrome P450 2E1 (CYP2E1) metabolizes ethanol, and is induced in liver by ethanol consumption [7, 8]. This enzyme has a propensity to form superoxide (O2•−) and ectopic expression of human CYP2E1 in mouse liver enhances ethanol-induced liver damage [9]. Conversely, genetic ablation of CYP2E1 reduces oxidant stress [10], ethanol-induced fatty liver disease [11], and liver injury [12]. CYP2E1 is expressed in the central nervous system [13] and kidney [14–18], so local ethanol catabolism has the potential to damage other CPY2E1 expressing tissues.
Polyunsaturated fatty acyl residues esterified in complex lipids are targets (Fig. 1) of free radical oxidation [19]. The most abundant polyunsaturated phospholipid is sn-2 linoleoyl phosphatidylcholine, and its peroxidation is followed by fragmentation of the resulting esterified 9-(hydro)peroxyoctadecadienoyl to the common oxidation product sn-2 azelaoyl phosphatidylcholine (Az-PC) [20–23]. Az-PC structurally resembles the inflammatory phospholipid mediator Platelet-activating Factor (PAF), and Az-PC stimulates the receptor (PTAFR) for PAF [24]. Neutrophils express PTAFR [25] and respond to both PAF and oxidized phospholipids [26]. Az-PC differs from PAF in that Az-PC can only be formed by chain fragmentation of peroxidized cellular and lipoprotein phospholipid, so its presence marks oxidative stress.
Figure 1. Linoleoyl sn-2 residues of ether phosphocholines are truncated by radical oxidation.
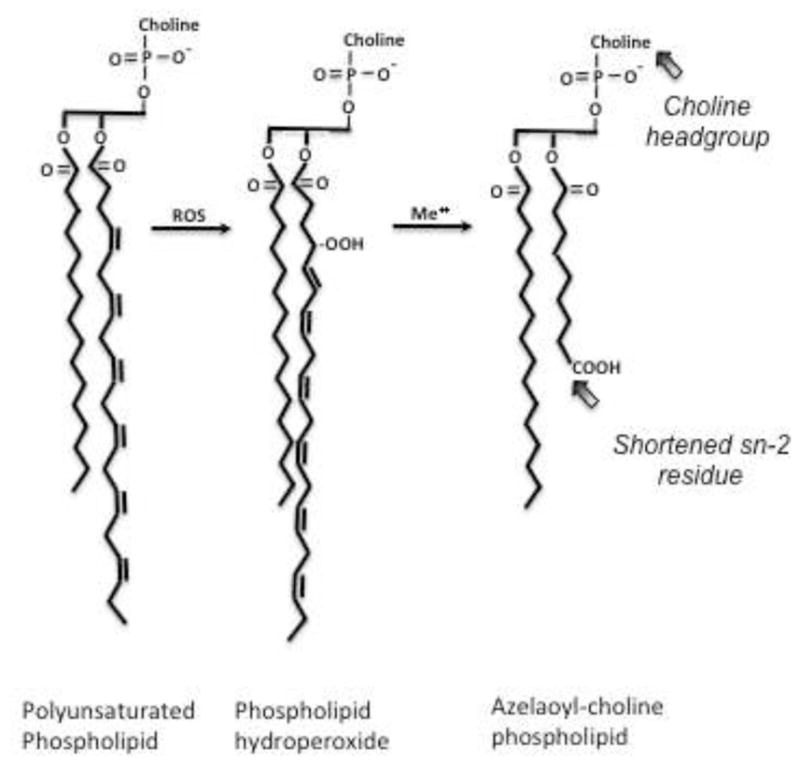
Hydrogen ion extraction between vicinal ethanolic bonds of polyunsaturated fatty acyl residues is followed by rearrangement to direct molecular oxygen incorporation at the distal and proximal end of the run of double bonds, forming phospholipid hydroperoxide (hydro)peroxides at these sites. The abundant sn-2 linoleoyl residue thereby produces nine carbon azelaoyl (nonanedioic acid) residues that remain esterified to the glyceryl phospholipid backbone. Oxidative truncation of linoleyl choline phospholipid to azelaoyl choline phospholipid generates a PAF-like agonist that stimulates the G protein coupled receptor for Platelet-activating Factor (PAF), the PTAFR. The critical elements recognized by this G protein coupled receptor include the short sn-2 acyl chain and the choline sn-3 headgroup;
Neutrophils are the source of bactericidal [27] myeloperoxidase [28] that synthesizes hypohalous acids, including HOCl, and generates radicals that oxidize the proteins and lipids of membranes and lipoproteins [29, 30]. The abundant and metabolically inactive amino acid taurine reacts with and sequesters HOCl [31], and taurine reduces oxidative stress, lipid oxidation, and fatty liver induced by ethanol feeding [32–34]. Taurine also reduces kidney damage and dysfunction in ethanol fed animals [18]. Taurine and halogenated taurine, however, have multiple and diverse activities that preclude identifying myeloperoxidase as the central, causal insult in oxidative [35] and inflammatory [36] diseases. Taurine protection during ethanol ingestion, then, need not reflect reduced HOCl levels.
We sought to determine whether dietary ethanol is a direct nephrotoxin that causes local lipid oxidation and formation of inflammatory PTAFR ligands. This, we hypothesized, would promote leukocyte recruitment and activation in kidney that would create an inflammatory cycle with positive feedback. We used PTAFR−/− and MPO−/− mice to assess whether this novel cycle of inflammation promotes local kidney damage and dysfunction during chronic ethanol ingestion.
Material and methods
Materials
Female C57BL/6J mice (6–8 weeks) were purchased from Jackson Labs (Bar Harbor, Maine). Lieber-DeCarli ethanol diets were from Dyets (Bethlehem, PA). PAFR null mice were the generous gift of Takao Shimizu (Univ. Tokyo) after back breeding to the BL6 strain (Jeffery Travers, Indiana Univ.). MPO null mice were the gift of Stanley Hazen (Cleveland Clinic). Anti-E06 antibody was from Avanti Polar (Alabaster, AL). CYP2E1 and 4-hydroxynonenol (4-HNE) antibodies were from Abcam (Cambridge, MA). Anti-β-actin antibody was from Santa Cruz Biotechnology (Santa Cruz, CA). Kits for blood urea nitrogen (BUN) and creatinine were purchased from Arbor Assays (Ann Arbor, MI). Anti-KIM-1 antibody was obtained from R&D Systems (Minneapolis, MN). All other reagents were used as analytical or mass spectrometry grade.
Mouse models and ethanol feeding
The chronic ethanol feeding model used in this study has been previously described [37]. All animals received humane care [52] in a protocol approved by the Cleveland Clinic Institutional Animal Care and Use Committee. Briefly, mice (8–10 weeks) were randomly assigned to the ethanol or isocaloric control arm of the protocol. Control mice were fed with maltose dextrin that was isocalorically substituted for ethanol based on the caloric intake of the ethanol-fed mice on the previous day. This pair feeding insures the weight gains during the trial were equal. Ethanol-fed mice were allowed free access to an ethanol containing liquid diet where the concentration of ethanol was ramped over time starting from 1% and 2% (vol/vol) each for 2 days, then 4% and 5% ethanol each for 7 days, and finally 6% ethanol for 1 week. The 6% (vol/vol) ethanol diet provides 32% of total calories in the diet. After ethanol or pair feeding, the mice were anesthetized, exsanguinated, and serum isolated and stored at −80°. Kidney tissues were isolated and stored in RNAlater™ for RNA quantification, and remaining tissues were stored at −80°C for protein and lipid determination. A small portion of the kidney tissues was immediately fixed in 10% formalin for histology.
Blood parameters
Sera from pair-fed and ethanol-fed mice was collected at defined times during the protocol. BUN, albumin, and creatinine were quantified by colorimetric detection kit from Arbor Assays (Ann Arbor, MI), strictly according to the manufacturer protocol.
Western blots
Kidney tissues from ethanol-fed and pair-fed control mice were washed with PBS, and homogenized on ice in a Potter-Elvehjem glass homogenizer containing 1x lysis buffer (Cell Signaling Technology) with protease inhibitor (Sigma, MO). The homogenates were cleared by centrifugation for 30 min at 14,000 × g. For western blotting, samples were mixed with 6x Laemmli buffer containing 10% SDS and 200 mM DDT, followed by boiling. SDS-PAGE used 10 to 12% gels that were blotted onto nitrocellulose membranes (Bio-Rad) and blocked with 5% nonfat dry milk (Bio-Rad). Alternatively, detection used anti-CYP2E1 antibody (Abcam, 1:2000) overnight at 4°C. LI-COR IRDye 800CW goat anti-rabbit IgG was used as a secondary antibody for CYP2E1 (1:10000) and IRDye 680RD goat anti-mouse IgG (1:10000) was used as secondary for β-actin. Images were collected and analyzed using an Odyssey Infrared Imaging System (Li-Core).
Mass Spectrometry of PAF and PAF-like lipids
Total lipids were extracted from pair-fed and ethanol-fed mouse kidney with [2H]PAF as an internal standard, purified over an aminopropyl column, and quantified by liquid chromatography/electrospray ionization/tandem mass spectrometry (LC/MS/MS) as described [18]. Samples in 85% methanol were injected onto a reverse phase C18 HPLC column (2 × 150 mm, 5-μM ODS(2) Phenomenex) equilibrated with 85% methanol containing 0.2% formic acid at a flow rate of 0.2 ml/min. PAF and oxidized phospholipids were resolved with a linear gradient from 85 to 100% methanol for 17 min and then a linear gradient from 100 to 85% methanol in 0.5 min and held for 6.5 min. Analyses were performed with a Quattro Ultima triple-quadrupole mass spectrometer (Micromass, Wythenshawe, UK) configured with the capillary voltage at 5 kV, the cone voltage at 60 V, the source temperature at 120 °C, and a desolvation temperature at 250 °C. N2 and desolvation gas flow were 90 and 811 liters/h. Collision induced dissociation used argon gas. Electrospray ionization in a positive ion mode with multiple reaction monitoring assessed phosphocholine m/z 184 product ion as the dominant ion of azelaoyl phosphatidylcholine (Az-PC) and PAF, so the precursor to product ion transitions were m/z 791 → 184 and m/z 667 → 184, respectively. The identity of the phospholipids was confirmed in comparison with synthetic standards with the product ion scan for Az-PC in the negative mode.
CYP2E1 over-expression and PTAFR ligand formation
Human kidney cells (HK-2, ATCC) were grown in DMEM-F12 medium supplemented with 10% fetal bovine serum, penicillin (100 U/ml), streptomycin (100 ug/ml), and 2 mmol/L glutamine in a humidified atmosphere of 5% CO2 at 37°C. Plasmid containing human CYP2E1 complementary DNA (pCI-2E1) was a gift from Dr. Natalia Nieto (Mount Siani). HK-2 cells (5 × 10⁵) were transfected with 10 μg pCI-2E1 using Lipofectamine™ LTX and Plus™ Reagent according to the instructions provided by the manufacturer (LifeTechnologies). After 48 h, the cells were trypsinized, cultured in 10% FBS DMEM-F12 containing 1 mg/ml Geneticin (G418), and 24h later were treated with ethanol (100 mM daily) for 4 days. CYP2E1 expression was evaluated by western blot after induction with ethanol. Total lipids were recovered by Bligh and Dyer [38] extraction, dried under N2 and reconstituted with HBSS containing 0.5% human serum albumin (HBSS/A). The reconstituted extracts were sonicated and vortexed just before use.
PTAFR ligand Bioassay
Neutrophils were isolated from human blood by dextran sedimentation and Ficoll centrifugation in a protocol approved by the Cleveland Clinic Institutional Review Board. Neutrophils (5.5 × 10⁶ cells/ml) were labeled with FURA-2-AM (1 μM, Life Technologies) for 45 min at 37°C and washed twice with HBSS/A before resuspension in HBSS/A (2.75 × 10⁶ cells/ml) [26]. Changes in intracellular Ca++ levels were detected by dual excitation at 340 and 380 nm, with emission monitored at 510 nm. Data are presented as excitation ratio at 340/380 nm.
RNA Isolation and Quantitative Reverse Transcription-PCR in kidney
Total RNA was extracted from kidney tissues preserved in RNAlater (Qiagen, Germantown, MD) using RNeasy mini kits (Qiagen, Germantown, MD). RNA content was measured in a NanoDrop ND-1000 spectrophotometer. Messenger RNA was quantified by SYBR Green one-step reverse transcription-PCR for CYP2E1, TNFα, CD18, CD64, MPO and 18S with the Bio-Rad MyiQ real-time PCR detection system. The primers for mouse CYP2E1 (sense, 5′-TGGGGAAACAGGGTAATGAG-3′; antisense-5′-GTGCACAGCCAATCAGAAAG-3′), mouse TNFα (sense, 5′-ACG GCA TGG ATC TCA AAG AC-3′; antisense, 5′-AGA TAG CAA ATC GGC TGA CG-3′), mouse KIM-1 (sense, 5′-CAA TGC CCA TCT TCT GCT TG-3′; antisense, 5′-TGC CCC TTT AAG TTG TAC CG-3′), mouse CD18 (sense-5′-TGC AGT AAT GGA GCA TCG AG-3′; sense-5′-TCG GAA GCC ATG ACC TTT AC-3′), mouse CD64 (sense, 5′-GAG GTC GCC ATT CTG AAA AC-3′; antisense, 5′-TCT TTC ACC GTG ATG GAC AC-3′), and mouse MPO (sense, 5′-AGC GGA GAG AAA GCA TCA AG-3′; antisense-5′-CCG GCT GCT TGA AGT AAA AC-3′) were purchased from IDT (Coralville, IA). The mRNA expression was normalized to 18S mRNA content and 2−ΔΔCT was used to calculate change.
Immunohistochemistry
Kidney tissues were fixed in 10% buffered formalin and embedded in paraffin. The sections were deparaffinized in Safeclear II Xylene substitute and consecutively hydrated in 100%, 95%, 85% and 70% ethanol followed by two washes in PBS. Sections were treated with 10 mM citrate buffer (pH 6.0) at 95–100°C for 15 min for antigen retrieval. Sections were treated with peroxidase block (Pierce) for 30 min. Washed sections were blocked with 10% donkey serum and 0.1% Triton X-100 in PBS and incubated with 1:200 polyclonal anti-rabbit 4-HNE antibody (Abcam) or CYP2E1 antibody (Abcam) for 2 hr. After 3 washes in PBS, the sections were incubated with SP-conjugated streptavidin for 30 min followed by HRP for 30 min. After washing in PBS, the sections were treated with substrate-chromogen solution (DAB/Metal concentrate) for 2–5 min at room temperature. Sections were washed and mounted with mounting medium containing DAPI. Images were acquired with a 60X objective. Sections to be stained for KIM-1 were treated with proteinase K (20 μg/ml, 15 min) for antigen retrieval. Washed sections were blocked with 10% donkey serum and 0.1% Triton X-100 in phosphate-buffered saline and incubated overnight with 1:200 polyclonal anti-rabbit Kidney Injury Molecule-1 (KIM-1; Abcam, Cambridge, MA) antibody. Washed sections were incubated with 1:1000 Alexa Fluor 488-conjugated donkey-anti-rat IgG. Sections were washed and mounted with VECTASHIELD (Vector Laboratories, Burlingame, CA) before images were acquired with a 60X objective.
Data Analysis
All data are presented as mean ± S.E. Independent Student’s t test (two groups) or one-way analysis of variance (multiple groups) was performed by GraphPad Prism5 statistics software. Statistical significance was considered to be p < 0.05.
Results
Chronic ethanol feeding damages murine kidney and impairs its function
Liver damage from chronic ethanol ingestion has long been modeled in rats [39], which is accompanied by kidney damage [18]. Prolonged ethanol feeding also oxidatively damages murine liver [7], and we find chronic ethanol ingestion similarly damages murine kidney (Fig. 2A). The histology of periodate-Schiff (PAS) stained kidney sections showed expansion of the mesangial matrix of glomeruli after ethanol feeding, accompanied by occlusion of proximal convoluted tubules with PAS staining material. In concordance, renal filtration was reduced by chronic ethanol consumption with a significant increase in the circulation of both Blood Urea Nitrogen (BUN) and creatinine (Fig. 2B) that are no longer effectively filtered.
Figure 2. Chronic ethanol ingestion alters renal architecture and function.
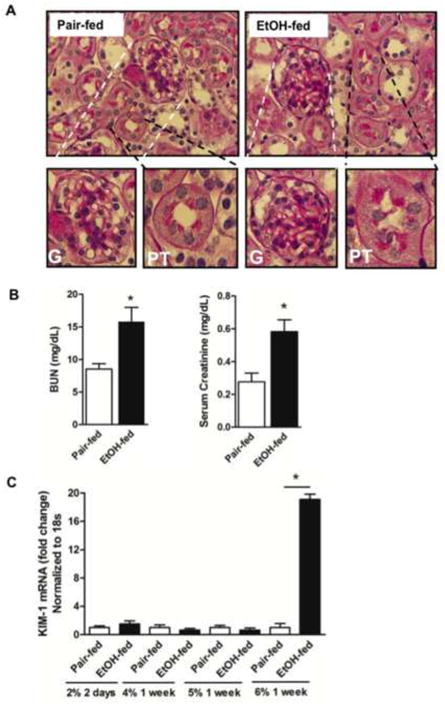
A) Chronic ethanol ingestion alters the structure of murine kidney. Paraffin embedded kidney sections were deparaffinized and hydrated, stained with Periodic acid-Schiff reagent (60x). Lower Expanded images of glomeruli (G, left) or proximal tubules (PT, right) of mice pair-fed a control diet (Left) or 25d ethanol (Right) as described in “Methods”. Ethanol-fed mice kidneys have swollen tubules with proteinaceous substances within the tubules, and mesangial matrix expansion around glomeruli. B) Ethanol feeding functionally damages kidney. Blood urea nitrogen (BUN) and creatinine (mg/dL) in plasma were increased in ethanol-fed mice relative to control mice. The data are expressed as mean±SEM (n=6) and p<0.05 was considered as significant. C) Ethanol feeding induced mRNA for Kidney Injury Molecule-1. Total RNA was isolated from ethanol and pair-fed kidneys at the stated times during the feeding trial, and quantified by SYBR Green one-step Reverse Transcription-PCR for CYP2E1 and 18S with the Bio-Rad MyiQ real-time PCR detection system. mRNA expression was normalized to 18S mRNA content and 2−ΔΔCT was used to calculate the fold changes. Data are expressed as mean±SEM (n=4), and p<0.05 was considered as significant.
The brush border membrane protein Kidney Injury Molecule-1 is not a component of normal kidney, but is strongly induced by acute injury [40]. KIM-1 mRNA in the kidneys of ethanol fed mice was not different from that in mice pair fed a control diet for the first weeks of the ethanol feeding protocol (Fig. 2C). However, during the final week of the diet, when mice ingest 6% ethanol, KIM-1 mRNA increased by 18-fold.
Ethanol ingestion induces CYP2E1 expression in kidney tubules with accumulation of PTAFR ligands and neutrophil infiltration
CYP2E1 expression was undetectable by immunohistochemistry in the kidneys of mice ingesting a control diet for the full 25 days (Fig. 3A). In contrast, this ethanol-metabolizing enzyme was prominent among renal proximal tubules when the kidneys derived from ethanol fed mice. Western blotting for CYP2E1 protein confirmed increased mRNA expression correlated with increased protein expression since CYP2E1 was undetectable in control kidneys, but was increased by 13-fold after chronic ethanol ingestion (Fig. 3B). qPCR confirmed chronic ethanol ingestion stimulated the accumulation of CYP2E1 mRNA (Fig. 3C). The increase in mRNA was a modest 2-fold, but the larger increase in protein abundance is consistent with post-transcriptional regulation of CYP2E1 [41].
Figure 3. Chronic ethanol feeding induces renal CYP2E1 and local oxidative stress.
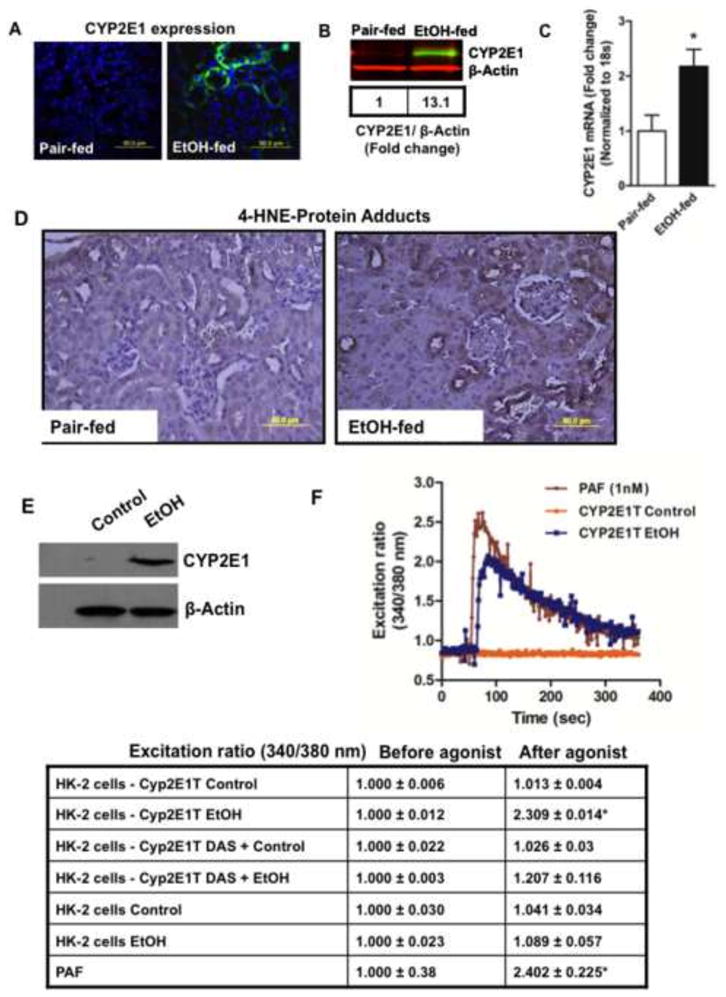
A) Immunohistochemistry of CYP2E1 expression in murine kidney tubules. Paraffin embedded kidney sections of animals fed ethanol or pair fed an isocaloric control diet for 25 days were deparaffinized, hydrated, and blocked with 10% donkey serum. The sections were immunostained with anti-rabbit CYP2E1 antibody, and Alexa Fluor® 488 donkey anti-rabbit IgG as a secondary antibody prior to imaging fluorescence at 60X. The figures are representative of 2 to 3 images per kidney of 4 mice per group. B) Ethanol induces CYP2E1 protein expression. Western blot of CYP2E1 expression in the crude homogenate (20 μg protein) of kidneys from pair-fed and ethanol-fed mice detected with IRDye® 800 CW anti-rabbit secondary antibody prior to scanned in an Odyssey Image station. Equal loading of protein was confirmed by using anti-β-actin antibody and Li-Cor IRDye® 680 RD goat anti-mouse IgG1 secondary antibody. The box defines the fold change in gray scale imaging ratios. C) Ethanol feeding induces CYP2E1 mRNA accumulation. Total RNA was isolated from ethanol and pair-fed kidneys, and quantified by SYBR Green one-step Reverse Transcription-PCR for CYP2E1 and 18S by real-time PCR. The mRNA expression was normalized to 18S mRNA content and 2−ΔΔCT was used to calculate the fold changes. The data are expressed as mean±SEM (n=4), and p<0.05 was considered as significant. D) Ethanol ingestion induces 4-hydroxynonenal adduct formation in renal tubules. Paraffin embedded kidney sections were deparaffinized and hydrated, antigens retrieved as described in “Methods.” Peroxidase was blocked, the sections blocked with blocking buffer, and then stained with anti-4-HNE antibody followed by HRP-conjugated secondary antibody that was developed with DAB/metal staining. Dark brown staining identifies 4-hydroxynonenal protein-adducts. The figures are representative of 2 to 3 images per kidney of 4 mice per group. E) CYP2E1 expression in transiently transfected human kidney cells. HK-2 cells were transfected with CYP2E1 (pCI-2E1) and Lipofectamine for 48 h, harvested and reseeded for 24h in 10% FBS/DMEM. Cells were treated, or not, with ethanol (100 mM daily) for 4 days prior to harvest and solubilization for SDS-PAGE immunohistochemistry with anti-CYP2E1 antibody followed by anti-β-actin antibody. F) CYP2E1 expressing HK-2 cells accumulate PTAFR ligands. HK-2 cells transiently transfected with CYP2E1, or not, were exposed to ethanol as in the preceding panel, although with or without the CYP2E1 inhibitor diallyl sulfide (100 μM). Total cellular lipids were extracted, dried, and reconstituted in HBSS with 0.5% human serum albumin before the presence of PTAFR ligands was determined using freshly isolated human neutrophils previously loaded with FURA2-AM. Changes in intracellular free Ca++ was monitored by changes over time in the fluorescent intensity at 340 nm relative to 380 nm. Synthetic PAF (1 nM) was the positive control. The table is a compilation of results using extracts of HK-2 cells treated as described where the fluorescent ratio of each assay is presented before and after extract addition.
This radical generating enzyme CYP2E1 appeared to be active in kidney because ethanol feeding induced lipid oxidation localized to kidney tubules, and not glomeruli, as shown by the appearance of 4-hydroxynonenal-protein adducts (Fig. 3D). The corresponding product of this oxidative fragmentation of cellular phospholipids are truncated phospholipids, some of which are agonists of the receptor (PTAFR) for the inflammatory phospholipid autacoid Platelet-activating Factor (PAF) [19]. We determined whether oxidative catabolism of ethanol by CYP2E1 generated PAF-like lipid mediators by transfecting normal human kidney (HK-2) cells with a CYP2E1 expression construct (Fig. 3E). We supplied these cells with ethanol, or not, extracted their lipids and assessed the presence of PTAR activators by induction of a spike of intracellular free Ca++ using FURA2-labeled human neutrophils [26]. Ethanol catabolism in CYP2E1-transfected kidney cells generated PTAFR agonists that stimulated neutrophils equivalent to stimulation by synthetic PAF (Fig. 3F). Untransfected cells or CYP2E1-transfected cells incubated with ethanol and the CYP2E1 inhibitor diallyl sulfide (DAS) did not accumulate PTAFR ligands.
Oxidative fragmentation of phospholipid (hydro)peroxides to release soluble 4-HNE generates a corresponding complex lipid reaction product that also contains a reactive acyl fragment. These phospholipid fragments also derivatize cellular material, which is detectable with the anti-oxidized phospholipid monoclonal antibody E06 [42]. Staining with the E06 antibody shows ethanol feeding increased formation of oxidized phospholipid-protein adducts in renal tubules (Fig. 4A). Quantitative mass spectrometry showed the non–biosynthetic phospholipid azelaoyl phosphatidylcholine also accumulated in the kidney of ethanol fed mice (Fig. 4B). This compound is an agonist for PTAFR [24], and ethanol feeding also stimulated accumulation of PAF itself.
Figure 4. Chronic ethanol ingestion induces phospholipid oxidation, formation of PAF receptor ligands, and leukocyte infiltration into murine kidney.
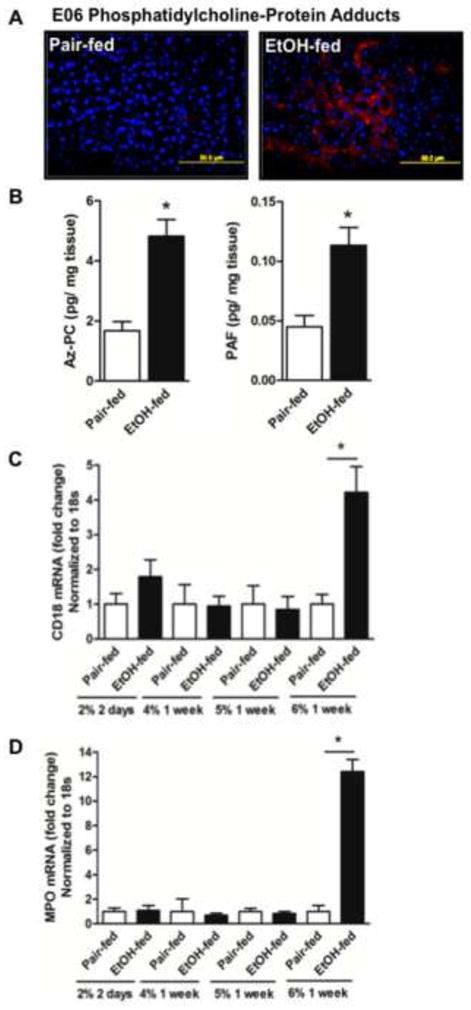
A) Oxidized phospholipid adducts form in kidney tubules during ethanol ingestion. Paraffin embedded kidney sections were deparaffinized, hydrated, and subjected to antigen retrieval before blocking with 10% goat serum as in the proceeding panel. The processed sections were incubated with anti-oxidized phospholipid E06 antibody (1:1000) before detection with Alexa Fluor® 568 goat anti-mouse IgG (1:1000). The panels (60X) are representative of 2–3 images per kidney of 4 mice per group. B) PTAFR ligands accumulate in kidney after ethanol feeding. Total lipid was isolated from pair-fed and ethanol-fed kidneys in the presence of [2H]PAF as an internal standard. sn-2 Palmitoyl azelaoyl choline phospholipid (Az-PC) and Platelet-activating Factor (PAF) were quantified by liquid chromatography/electrospray ionization/tandem mass spectrometry (LC/MS/MS) as described in methods and normalized to the amount of protein in the extracted tissue. The data are expressed as mean±SEM (n=4), and p<0.05 was considered as significant. C) mRNA for leukocyte β2 integrin (CD18) increased in kidney during ethanol ingestion. Mice were pair-fed an isocaloric control diet that was substituted with progressively increasing concentrations (v/v) of ethanol for the stated times. Total RNA was isolated from pair-fed and ethanol fed mice kidneys, and quantified by SYBR Green one-step reverse transcription-PCR for CD18 and 18S by real-time PCR detection. mRNA expression was normalized to 18S mRNA content and 2−ΔΔCT was used to calculate the fold change. The data are expressed as mean±SEM (n=4), and p<0.05 was considered as significant. D) Ethanol feeding increases mRNA for myeloperoxidase in kidney over time. RNA was extracted and processes as in the preceding panel before quantitation by real time qPCR relative to 18S RNA. The data again expressed as mean±SEM (n=4), and with significance set at p<0.05.
PTAFR instigates inflammatory responses as a potent agonist of cells of the innate immune system [25, 43]. Accordingly, leukocytes expressing the CD18 β2 integrin accumulated in kidneys of ethanol fed mice (Fig. 4C). White blood cell infiltration, like the renal damage marked by KIM-1 induction described above, also displayed a prolong hysteresis so that inflammation was only evident in mice ingesting 6% (v/v) ethanol. Neutrophils were components of this inflammatory infiltrate because mRNA for neutrophil myeloperoxidase increased over 10-fold in kidneys of ethanol fed mice, and again this was only apparent at the end of the experiment (Fig. 4D).
Ethanol induced radicals and PTAFR ligand formation require PTAFR
We used PAF receptor null mice to identify the potential role of PTAFR ligands in ethanol-induced renal inflammation. We first noted that CYP2E1 was induced equally in the kidneys of control and PTAFR−/− mice (Fig. 5A), so PTAFR ligands were not necessary to initiate ethanol catabolism in kidney. In contrast, loss of PTAFR abolished 4-HNE adduction in the kidneys of ethanol fed mice (Fig. 5B). As would be anticipated, since both 4-HNE and Az-PC share common precursors, loss of the receptor for PAF also ablated the ethanol-induced increase of the oxidatively formed phospholipid Az-PC (Fig. 5C left). However, we also found the PAF receptor was required to stimulate formation of its PAF ligand (Fig. 5C right). We conclude that while ethanol can be metabolized in kidney, this alone does not induce phospholipid oxidation or PAF synthesis. Instead, these processes require PAF receptor dependent events.
Figure 5. PTAFR is required for ethanol-induced kidney tubule oxidation and PTAFR ligand formation.
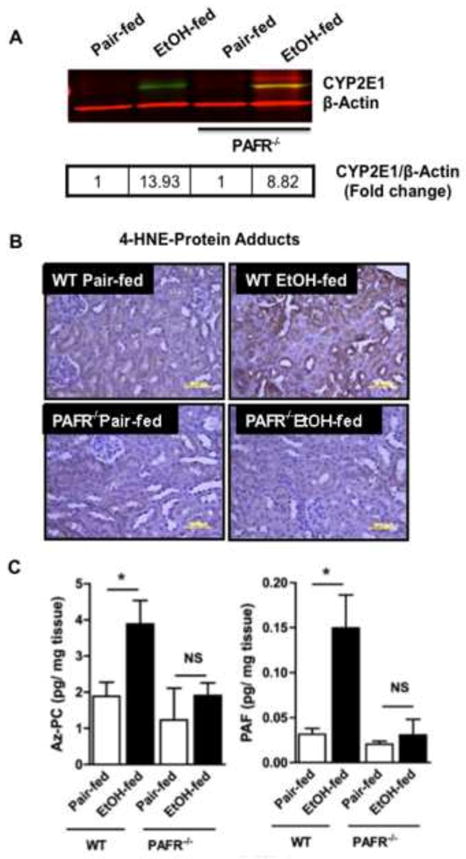
A) CYP2E1 induction is independent of PTAFR. Kidney homogenates from wild-type and PTAFR−/− mice fed control or ethanol-containing diets were resolved by SDS-PAGE (20 μg protein/well) prior to immunostaining for CYP2E1 with anti-rabbit CYP2E1 antibody followed by IRDye® 800 CW anti-rabbit secondary antibody prior to scanned in an Odyssey Imaging system. We again confirmed equal loading of protein simultaneously using anti-β-actin antibody and IRDye® 680 RD goat anti-mouse IgG1 secondary antibody. Fold change from pair fed control homogenates was calculated (box) following conversion to gray scale. B) 4-hydroxynonenal adduct formation in renal tubules requires PTAFR. Sections of kidney of C57/BL6 or PTAR−/− mice fed control or ethanol supplemented diets were immunostained with anti-4-hydroxynonenal antibody as in Fig. 3. The dark brown deposits of protein-4-hydroxynonenal adducts are representative of 2 to 3 images per kidney of 4 mice/group. C) PTAFR ligand formation in the kidneys of ethanol fed mice requires PTAFR. sn-2 Azelaoyl choline phospholipid (Az-PC) and Platelet-activating Factor (PAF) were quantified in kidneys of pair- and ethanol-fed wild-type and PTAFR−/− mice by liquid chromatography/electrospray ionization/tandem mass spectrometry (LC/MS/MS) using [2H]PAF as an internal standard as in the preceding figure. The data are expressed as mean±SEM (n=4), and p<0.05 was considered as significant.
Neutrophil infiltration, inflammation, and renal damage require PTAFR
Neutrophils and monocytes both express PTAFR, and are activated by PAF receptor ligands. Global ablation of PTAFR fully repressed accumulation of these FcγR1 (CD64) expressing inflammatory cells in the kidneys of ethanol fed mice (Fig. 6A left). Correspondingly, accumulation of a second inflammatory marker, CD18 β2 integrin, also was abolished in PTAFR−/− mice (Fig. 6A middle). Neutrophils are the primary source [28] of kidney damaging [44] myeloperoxidase, and the increase in myeloperoxidase mRNA induced by ethanol feeding was also abolished when PTAFR was deleted (Fig. 6A right).
Figure 6. Genetic ablation of PTAFR attenuates ethanol-induced neutrophilic inflammation and protects kidney function.
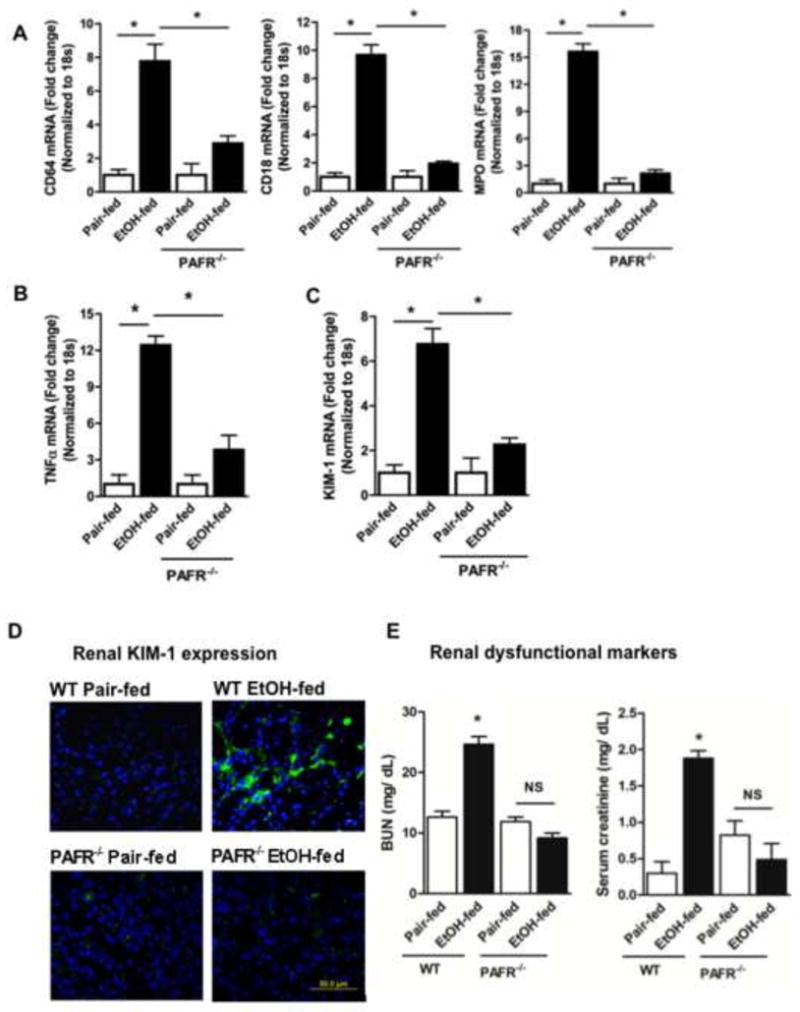
A) Genetic deletion of PTAFR blocks ethanol-induced renal inflammation. Parental C57BL/6 mice and their PTAFR−/− progeny were pair-fed a control diet or the progressive ethanol diet before total RNA was isolated from pair-fed and ethanol fed mice kidneys, and mRNA was quantified by real time reverse transcription-PCR for CD18, CD64, MPO. mRNA expression was normalized to 18S mRNA content and 2−ΔΔCT was used to calculate the fold change as before. The data are expressed as mean±SEM (n=4), and p<0.05 was considered as significant. B, C) PTAFR deletion prevents kidney inflammation and damage. mRNA for the inflammatory mediator B) TNFα and C) for the acute kidney injury marker KIM-1 was quantified and analyzed as in the preceding panel. D) Ablation of the PAF receptor suppresses KIM-1 protein expression in kidney tubules. Paraffin embedded kidney sections were processed as in Fig. 3 prior to immunostaining for KIM-1 (1:1000,) with detection by Alexa Fluor 488 donkey anti-rabbit IgG as a secondary antibody. The kidney sections were observed under fluorescence microscopy. The figures (60X) are representative of 2–3 images per kidney of 4 mice per group. E) Kidney function is protected by PTAFR deletion. Plasma creatinine and blood urea nitrogen (BUN) concentrations (mg/dL) were assessed by commercial kits as in Fig. 2. Data are expressed as mean±SEM (n=4), with significance accepted at p<0.05.
Prolonged ethanol ingestion induced a local inflammatory response in kidney, with a 12-fold increase in mRNA for TNFα (Fig. 6B). Genetic ablation of PTAFR significantly reduced induction of this inflammatory mediator [45], although about a fourth of the induction occurred via a PTAFR-independent pathway. KIM-1 is induced by a range of renal insults [46], and stimulated expression of KIM-1 mRNA in the kidney of ethanol fed mice also was highly dependent on the presence of PTAFR (Fig 6C). Ethanol, like other nephrotoxins, induced KIM1 expression by tubular cells, which depended on PTAFR signaling (Fig. 6D).
Chronic ethanol ingestion compromised renal filtration, and circulating Blood Urea Nitrogen and creatinine increased in this separate feeding trial (Fig. 6E). Ethanol ingestion in PTAFR−/− mice did not result in a significant increase either measure of defective filtration in the circulation, so PTAFR-dependent events, and not ethanol metabolism itself, cause the loss of kidney function.
Ethanol induced kidney damage requires neutrophil myeloperoxidase
Myeloperoxidase expressed by activated neutrophils generates oxidizing hypohalous acids. We use MPO−/− mice to determine whether this enzyme is the effector of PTAFR-activated neutrophils that damages renal filtration. The histology of PAF stained kidneys showed MPO deficient mice were protected from mesangial cell matrix proliferation surrounding the glomeruli, and their tubules remained free of sloughed periodate-Schiff-positive material (Fig. 7A). KIM1 expression by ethanol-damaged kidney tubules was abolished by loss of MPO (Fig. 7B). Ablation of MPO also protected kidney from the functional deficits that resulted from chronic ethanol ingestion since filtration of both BUN and serum creatinine were normalized in MPO−/− mice (Fig. 7C).
Figure 7. Genetic deletion of myeloperoxidase attenuates ethanol-induced kidney damage and dysfunction.
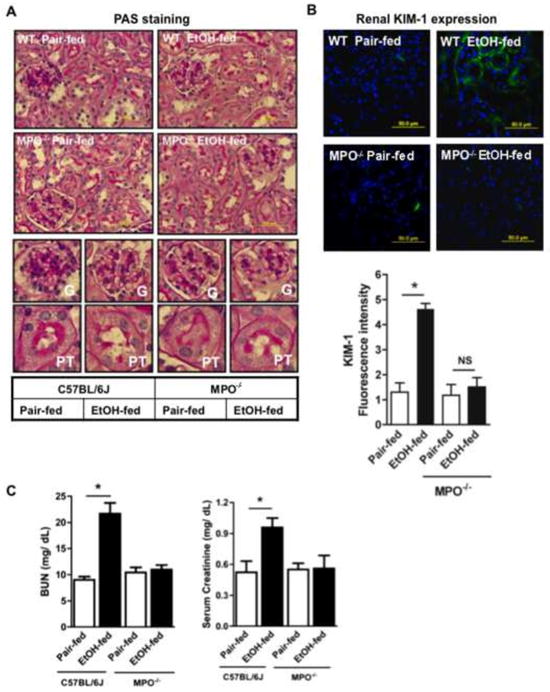
A) Kidney structure is preserved in MPO−/− mice ingesting ethanol. Kidney from C57BL/6 parental mice or their MPO−/− derivatives were sectioned, fixed, and processed as in Fig. 2 prior to staining with Periodic acid–Schiff (PAS) and hematoxylin reagent and imaging at 60x (Top). Glomeruli (G, middle) or proximal tubules (PT, lower) from each section imaged at 60x were electronically expanded. B) Genetic ablation of MPO blocked ethanol induced acute kidney injury. Kidneys of wild-type or MPO−/− mice ingesting ethanol or pair fed control diets were harvested before KIM-1 immunofluorescence was quantified in 4 to 5 sections in each kidneys of pair-fed and ethanol-fed mice using ImageJ 1.47v software (NIH), and the data are expressed as mean±SEM, n=4, p<0.05 (*). C) MPO deletion protects renal filtration from ethanol ingestion. Plasma creatinine and blood urea nitrogen (BUN) concentrations (mg/dL) were assessed as in Fig. 2. The data are expressed as mean±SEM (n=4), and p<0.05 was considered as significant.
Discussion
Ethanol use is common in American society where it is estimated, since precise use, volumes, and frequency are difficult to quantify, that the majority of the population ingests alcohol [47] and that several percent of the population meet the definition of alcohol dependency [48]. The majority of ingested ethanol is metabolized in liver by alcohol dehydrogenase and aldehyde dehydrogenase, by the CYP2E1 cytochrome P450 (MEOS, mitochondrial ethanol oxidizing system), and by catalase [49] with production of reactive oxygen and nitrogen species [50]. Accordingly, ethanol is a hepatotoxin where its chronic use causes lipid accumulation in the livers of nearly all individuals, with a third of these individuals progressing to liver fibrosis, and 10% or so of these progressing to cirrhosis [1, 2]. Inflammatory alcoholic hepatitis can be superimposed on this progression with a mortality of up to 40% [3, 51].
Chronic alcohol consumption additionally results in acute as well as chronic kidney disease [6, 52–54] that strongly associates with the mortality of alcoholic hepatitis [3]. The incidence of end stage renal disease with its high risk of mortality is also associated with ethanol consumption [55]. Both kidney architecture [18, 52] and filtration [18, 53] are altered during ethanol consumption in humans and in the standard [39] rat model of ethanol feeding. These changes highlight the potential for kidney damage to significantly exacerbate the effect on alcohol in patients, but whether kidney itself is directly affected by ethanol or if its loss of function is only secondary to liver damage is unresolved. We now find similar changes in renal structure and deranged filtration in a murine model of chronic ethanol consumption that allows the use of genetic interventions to elucidate the mechanism of ethanol induced kidney damage. The livers of neither mice nor rats are severely damaged by this chronic ingestion of ethanol, so ethanol is a direct nephrotoxin that is not secondary to liver damage, at least in these rodent models.
Kidney expresses trace amounts of CYP2E1 [14–17] and, like liver, we find this enzyme was induced by ethanol ingestion. Since kidney is exposed to circulating ethanol, kidney too should be subjected to oxidative stress from ethanol metabolism. As would be expected, we found oxidized phospholipids, and their protein adducts, accumulated in murine kidney during ethanol ingestion. Ethanol induced CYP2E1 in renal proximal tubules and this was the site where the oxidized phospholipid-protein adducts were generated. We conclude from this that ethanol oxidation associates with radical production in kidney as in liver.
Oxygen activation by cytochromes P450 generates O2•− and H2O2 that contribute to oxidative tissue injury [56]. Genetic ablation of CYP2E1 decreases alcohol-enhanced steatosis, the first stage in the progression of liver disease, while ectopic expression of human CYP2E1 in these null animals restores this injury [12]. In contrast, chronic ethanol ingestion induced a more severe pathology in kidney, which developed acute kidney injury [18] (above), but this was not a direct effect of CYP2E1 generated radicals. We conclude this because ablation of PTAFR was fully protective for kidney even though the animals still upregulated CYP2E1 to catabolize the ingested ethanol. Instead, induction of kidney damage temporally correlated with neutrophil influx, while causality was established by loss of PTAFR that suppressed formation of this inflammatory infiltrate, reactive radical formation, and kidney damage. Neutrophil myeloperoxidase and NADPH oxidase type 2 have critical roles in ethanol-induced liver damage [57, 58], but have primary roles in the more severe damage to kidney structure and function that results from chronic ethanol feeding.
We conclude renal damage need not depend on prior liver damage from CYP2E1 ethanol catabolism. First, fact kidneys were more susceptible to inflammation, damage, and dysfunction than liver. This kidney dysfunction was significant since the increase in circulating BUN and creatinine in ethanol fed mice rivals that after injection of large amounts of lipopolysaccharide [59]. In contrast, ethanol is only a mild hepatotoxic insult that fails to significantly progress beyond lipid accumulation common to the earliest stages of alcoholic liver disease [60]. The second line of evidence that ethanol damage to kidney function is not secondary to liver damage is that kidney, unliket liver, abundantly expresses PTAFR[61–63] that was required for kidney dysfunction. Notably, chronic ethanol ingestion failed to induce a leukocytic influx in the kidneys of PTAFR−/− mice. Loss of this receptor also was fully effective in maintaining renal filtration, with normal levels of circulating BUN and creatinine in the PTAFR knockout animals ingesting ethanol. Additionally, ethanol metabolism failed to induce an inflammatory increase in TNFα expression in the kidneys of PTAFR null mice. Loss of this receptor suppressed the acute kidney injury marker KIM-1 and preserved renal function, so oxidation of tubular phospholipids to generate PTAFR ligands results from leukocyte infiltration and activation.
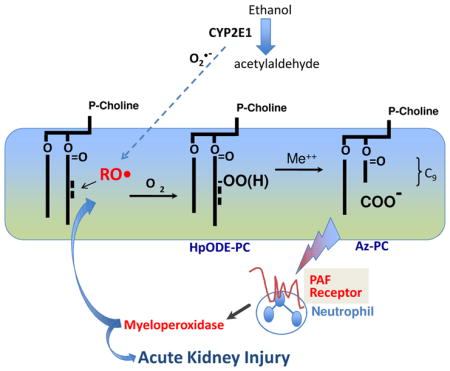
Ablation of MPO also protected kidney from ethanol-induced renal damage, so leukocyte influx and activation underlie these structural and functional changes. We suggest all these data can be assembled into a single, internally consistent model (Fig. 8). We propose oxidative stress imposed by CYP2E1 catabolism in kidney is manageable and is insufficient to induce structural or functional changes during ethanol ingestion. When ethanol flux through CYP2E1 either overwhelms this balance either through a small increase ingested ethanol, that is from 5% to 6%, or after the 20 days of catabolism then small amounts of oxidatively truncated phospholipids that are PTAFR ligands [19] accumulate. These lipid agonists recruit leukocytes into kidney through PTAFR-dependent signaling.- PTAFR-activated PMN release myeloperoxidase that is essential in extending leukocyte recruitment and activation by generating oxidized phospholipids and directly damaging kidney [44, 64, 65]. This model is validated by the complete protection afforded by the genetic ablation of PTAFR at the top of this cascade or MPO as the effector at the bottom of the cascade.
Fig. 8.
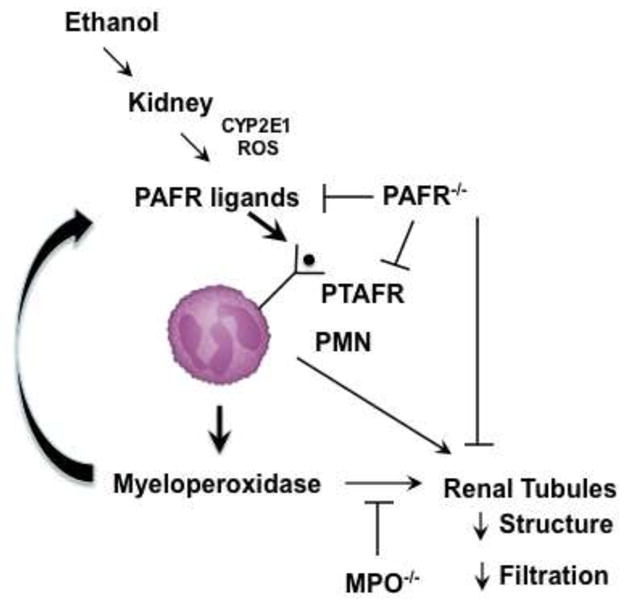
Ethanol metabolism induces a cycle of PTAFR ligand formation followed by PTAFR-dependent activation of neutrophil myeloperoxidase.
CYP2E1 is induced in kidney tubules by ethanol allowing CYP2E1 production of ethanol to create reactive oxygen species (ROS) that peroxidize cellular polyunsaturated phospholipids. Hock fragmentation generates reactive fragments that derivatize local proteins so local tissue oxidation is marked by anti-4-hydroxynonenal and E06 anti-phospholipid antibody. Oxidative fragmentation of phosphatidylcholine also generates PAF-like truncated phospholipids that stimulate the PAF receptor (PTAFR). PTAFR stimulates neutrophil infiltration and activation that both synthesize PAF and releases oxidants that contribute to oxidative phospholipid truncation to PTAFR ligands. PTAFR activated neutrophils release myeloperoxidase (MPO) that damages kidney function. Genetic ablation of PTAFR blocks initiation of this new cascade, while ablation of myeloperoxidase blocks tissue damage and PTAFR ligand formation.
Together, these data show kidney has the capability to metabolize ethanol, that radical production and phospholipid oxidation co-localize with CYP2E1 expression, that PTAFR ligands derived from phospholipid oxidation accumulate in kidney, and that PTAFR signaling is required for neutrophil influx into kidney. Neutrophil myeloperoxidase from activated neutrophils is required for ethanol-induced kidney damage. We conclude ethanol is a nephrotoxin that induces an autocrine cycle of inflammation and oxidative production of inflammatory stimuli.
Highlights.
Ethanol ingestion increases lipid oxidation, induces leukocyte infiltration, and damages kidney tissue and function.
Ethanol is a nephrotoxin that acts through a cycle of leukocyte infiltration, activation, and ROS production.
PAF receptor ligands induce kidney damage by recruiting and activating neutrophil myeloperoxidase.
Acknowledgments
We greatly appreciate the renal expertise of Sankar Navaneethan (Nephrology and Hypertension, Cleveland Clinic) in viewing kidney sections, as well as donation of mouse strains from Drs. Takao Shimizu (University Tokyo), Jeffery. Travers (Indiana University), and Stanley Hazen (Cleveland Clinic). We appreciate the advice of William Baldiwin III in renal immunostaining. We gratefully acknowledge the gift of a CYP2E1 expression plasmid from Drs. Arthur Cederbaum and Natalia Nieto (Mount Sinai). We appreciate the aid of Rui Chen in designing experiments and blood cell isolation, and we appreciate the animal husbandry of Jazmine Danner and Megan R. McMullen. The aid of Renliang Zhang and the Lerner Research Institute small molecule mass spectrometry core are also appreciated as is the artwork of the Cleveland Clinic Center for Medical Art and Photography.
This work was supported by NIAAA R01 017748, ASH U01 AA021890, P20 AA017837, and R37 AA011876
Abbreviations
- AKI
Acute Kidney Injury
- BUN
blood urea nitrogen
- CYP2E1
cytochrome P450 isotype 2E1
- KIM-1
Kidney Injury Molecule-1
- PAF
Platelet-activating Factor
Footnotes
Publisher's Disclaimer: This is a PDF file of an unedited manuscript that has been accepted for publication. As a service to our customers we are providing this early version of the manuscript. The manuscript will undergo copyediting, typesetting, and review of the resulting proof before it is published in its final citable form. Please note that during the production process errors may be discovered which could affect the content, and all legal disclaimers that apply to the journal pertain.
References
- 1.O’Shea RS, Dasarathy S, McCullough AJ. Alcoholic liver disease. Hepatology. 2010;51:307–328. doi: 10.1002/hep.23258. [DOI] [PubMed] [Google Scholar]
- 2.Gao B, Bataller R. Alcoholic liver disease: pathogenesis and new therapeutic targets. Gastroenterology. 2011;141:1572–1585. doi: 10.1053/j.gastro.2011.09.002. [DOI] [PMC free article] [PubMed] [Google Scholar]
- 3.Altamirano J, Fagundes C, Dominguez M, Garcia E, Michelena J, Cardenas A, Guevara M, Pereira G, Torres-Vigil K, Arroyo V, Caballeria J, Gines P, Bataller R. Acute kidney injury is an early predictor of mortality for patients with alcoholic hepatitis. Clin Gastroenterol Hepatol. 2012;10:65–71. e63. doi: 10.1016/j.cgh.2011.09.011. [DOI] [PubMed] [Google Scholar]
- 4.Labib M, Abdel-Kader M, Ranganath L, Martin S, Marks V. Impaired renal tubular function in chronic alcoholics. J R Soc Med. 1989;82:139–141. doi: 10.1177/014107688908200307. [DOI] [PMC free article] [PubMed] [Google Scholar]
- 5.Shankar A, Klein R, Klein BE. The association among smoking, heavy drinking, and chronic kidney disease. Am J Epidemiol. 2006;164:263–271. doi: 10.1093/aje/kwj173. [DOI] [PubMed] [Google Scholar]
- 6.White SL, Polkinghorne KR, Cass A, Shaw JE, Atkins RC, Chadban SJ. Alcohol consumption and 5-year onset of chronic kidney disease: the AusDiab study. Nephrol Dialysis Transplant. 2009;24:2464–2472. doi: 10.1093/ndt/gfp114. [DOI] [PubMed] [Google Scholar]
- 7.Roychowdhury S, McMullen MR, Pritchard MT, Li W, Salomon RG, Nagy LE. Formation of gamma-ketoaldehyde-protein adducts during ethanol-induced liver injury in mice. Free Radic Biol Med. 2009;47:1526–1538. doi: 10.1016/j.freeradbiomed.2009.07.015. [DOI] [PMC free article] [PubMed] [Google Scholar]
- 8.Sebastian BM, Roychowdhury S, Tang H, Hillian AD, Feldstein AE, Stahl GL, Takahashi K, Nagy LE. Identification of a cytochrome P4502E1/Bid/C1q-dependent axis mediating inflammation in adipose tissue after chronic ethanol feeding to mice. J Biol Chem. 2011;286:35989–35997. doi: 10.1074/jbc.M111.254201. [DOI] [PMC free article] [PubMed] [Google Scholar]
- 9.Butura A, Nilsson K, Morgan K, Morgan TR, French SW, Johansson I, Schuppe-Koistinen I, Ingelman-Sundberg M. The impact of CYP2E1 on the development of alcoholic liver disease as studied in a transgenic mouse model. J Hepatol. 2009;50:572–583. doi: 10.1016/j.jhep.2008.10.020. [DOI] [PubMed] [Google Scholar]
- 10.Gonzalez FJ. Role of cytochromes P450 in chemical toxicity and oxidative stress: studies with CYP2E1. Mutat Res. 2005;569:101–110. doi: 10.1016/j.mrfmmm.2004.04.021. [DOI] [PubMed] [Google Scholar]
- 11.Lu Y, Zhuge J, Wang X, Bai J, Cederbaum AI. Cytochrome P450 2E1 contributes to ethanol-induced fatty liver in mice. Hepatology. 2008;47:1483–1494. doi: 10.1002/hep.22222. [DOI] [PubMed] [Google Scholar]
- 12.Lu Y, Wu D, Wang X, Ward SC, Cederbaum AI. Chronic alcohol-induced liver injury and oxidant stress are decreased in cytochrome P4502E1 knockout mice and restored in humanized cytochrome P4502E1 knock-in mice. Free Radic Biol Med. 2010;49:1406–1416. doi: 10.1016/j.freeradbiomed.2010.07.026. [DOI] [PMC free article] [PubMed] [Google Scholar]
- 13.Heit C, Dong H, Chen Y, Thompson DC, Deitrich RA, Vasiliou VK. The role of CYP2E1 in alcohol metabolism and sensitivity in the central nervous system. Subcell Biochem. 2013;67:235–247. doi: 10.1007/978-94-007-5881-0_8. [DOI] [PMC free article] [PubMed] [Google Scholar]
- 14.Ronis MJ, Huang J, Longo V, Tindberg N, Ingelman-Sundberg M, Badger TM. Expression and distribution of cytochrome P450 enzymes in male rat kidney: effects of ethanol, acetone and dietary conditions. Biochem Pharmacol. 1998;55:123–129. doi: 10.1016/s0006-2952(97)00381-x. [DOI] [PubMed] [Google Scholar]
- 15.Cummings BS, Zangar RC, Novak RF, Lash LH. Cellular distribution of cytochromes P-450 in the rat kidney. Drug Metab Disposition. 1999;27:542–548. [PubMed] [Google Scholar]
- 16.Liu H, Baliga R. Cytochrome P450 2E1 null mice provide novel protection against cisplatin-induced nephrotoxicity and apoptosis. Kidney Int. 2003;63:1687–1696. doi: 10.1046/j.1523-1755.2003.00908.x. [DOI] [PubMed] [Google Scholar]
- 17.Zerilli A, Lucas D, Amet Y, Beauge F, Volant A, Floch HH, Berthou F, Menez JF. Cytochrome P-450 2E1 in rat liver, kidney and lung microsomes after chronic administration of ethanol either orally or by inhalation. Alcohol Alcohol. 1995;30:357–365. [PubMed] [Google Scholar]
- 18.Latchoumycandane C, Nagy LE, McIntyre TM. Chronic Ethanol Ingestion Induces Kidney Oxidative Injury through Taurine-inhibitable Inflammation. Free Radic Biol Med. 2014;69:403–416. doi: 10.1016/j.freeradbiomed.2014.01.001. [DOI] [PMC free article] [PubMed] [Google Scholar]
- 19.McIntyre TM. Bioactive oxidatively truncated phospholipids in inflammation and apoptosis: Formation, targets, and inactivation. Biochim Biophys Acta. 2012;1818:2456–2464. doi: 10.1016/j.bbamem.2012.03.004. [DOI] [PMC free article] [PubMed] [Google Scholar]
- 20.Itabe H, Kushi Y, Handa S, Inoue K. Identification of 2-azelaoylphosphatidylcholine as one of the cytotoxic products generated during oxyhemoglobin-induced peroxidation of phosphatidylcholine. Biochim Biophys Acta. 1988;962:8–15. [PubMed] [Google Scholar]
- 21.Stremler KE, Stafforini DM, Prescott SM, McIntyre TM. Human plasma platelet-activating factor acetylhydrolase. Oxidatively fragmented phospholipids as substrates. J Biol Chem. 1991;266:11095–11103. [PubMed] [Google Scholar]
- 22.Tokumura A, Toujima M, Yoshioka Y, Fukuzawa K. Lipid peroxidation in low density lipoproteins from human plasma and egg yolk promotes accumulation of 1-acyl analogues of platelet- activating factor-like lipids. Lipids. 1996;31:1251–1258. doi: 10.1007/BF02587909. [DOI] [PubMed] [Google Scholar]
- 23.Uhlson C, Harrison K, Allen CB, Ahmad S, White CW, Murphy RC. Oxidized phospholipids derived from ozone-treated lung surfactant extract reduce macrophage and epithelial cell viability. Chem Res Toxicol. 2002;15:896–906. doi: 10.1021/tx010183i. [DOI] [PubMed] [Google Scholar]
- 24.Chen R, Chen X, Salomon RG, McIntyre TM. Platelet activation by low concentrations of intact oxidized LDL particles involves the PAF receptor. Arterioscler Thromb Vasc Biol. 2009;29:363–371. doi: 10.1161/ATVBAHA.108.178731. [DOI] [PMC free article] [PubMed] [Google Scholar]
- 25.Ishii S, Nagase T, Shimizu T. Platelet-activating factor receptor. Prostaglandins Other Lipid Mediat. 2002;68–69:599–609. doi: 10.1016/s0090-6980(02)00058-8. [DOI] [PubMed] [Google Scholar]
- 26.Marathe GK, Davies SS, Harrison KA, Silva AR, Murphy RC, Castro-Faria-Neto H, Prescott SM, Zimmerman GA, McIntyre TM. Inflammatory platelet-activating factor-like phospholipids in oxidized low density lipoproteins are fragmented alkyl phosphatidylcholines. J Biol Chem. 1999;274:28395–28404. doi: 10.1074/jbc.274.40.28395. [DOI] [PubMed] [Google Scholar]
- 27.Hansson M, Olsson I, Nauseef WM. Biosynthesis, processing, and sorting of human myeloperoxidase. Arch Biochem Biophys. 2006;445:214–224. doi: 10.1016/j.abb.2005.08.009. [DOI] [PubMed] [Google Scholar]
- 28.Klebanoff SJ, Kettle AJ, Rosen H, Winterbourn CC, Nauseef WM. Myeloperoxidase: a front-line defender against phagocytosed microorganisms. J Leukoc Biol. 2013;93:185–198. doi: 10.1189/jlb.0712349. [DOI] [PMC free article] [PubMed] [Google Scholar]
- 29.Schmitt D, Shen Z, Zhang R, Colles SM, Wu W, Salomon RG, Chen Y, Chisolm GM, Hazen SL. Leukocytes utilize myeloperoxidase-generated nitrating intermediates as physiological catalysts for the generation of biologically active oxidized lipids and sterols in serum. Biochemistry (Mosc) 1999;38:16904–16915. doi: 10.1021/bi991623w. [DOI] [PubMed] [Google Scholar]
- 30.Hazen SL, Zhang R, Shen Z, Wu W, Podrez EA, MacPherson JC, Schmitt D, Mitra SN, Mukhopadhyay C, Chen Y, Cohen PA, Hoff HF, Abu-Soud HM. Formation of nitric oxide-derived oxidants by myeloperoxidase in monocytes: pathways for monocyte-mediated protein nitration and lipid peroxidation In vivo. Circ Res. 1999;85:950–958. doi: 10.1161/01.res.85.10.950. [DOI] [PubMed] [Google Scholar]
- 31.Weiss SJ, Klein R, Slivka A, Wei M. Chlorination of taurine by human neutrophils. Evidence for hypochlorous acid generation. J Clin Invest. 1982;70:598–607. doi: 10.1172/JCI110652. [DOI] [PMC free article] [PubMed] [Google Scholar]
- 32.Kerai MD, Waterfield CJ, Kenyon SH, Asker DS, Timbrell JA. Taurine: protective properties against ethanol-induced hepatic steatosis and lipid peroxidation during chronic ethanol consumption in rats. Amino Acids. 1998;15:53–76. doi: 10.1007/BF01345280. [DOI] [PubMed] [Google Scholar]
- 33.Kerai MD, Waterfield CJ, Kenyon SH, Asker DS, Timbrell JA. Reversal of ethanol-induced hepatic steatosis and lipid peroxidation by taurine: a study in rats. Alcohol Alcohol. 1999;34:529–541. doi: 10.1093/alcalc/34.4.529. [DOI] [PubMed] [Google Scholar]
- 34.Balkan J, Kanbagli O, Aykac-Toker G, Uysal M. Taurine treatment reduces hepatic lipids and oxidative stress in chronically ethanol-treated rats. Biol Pharm Bull. 2002;25:1231–1233. doi: 10.1248/bpb.25.1231. [DOI] [PubMed] [Google Scholar]
- 35.Pushpakiran G, Mahalakshmi K, Anuradha CV. Taurine restores ethanol-induced depletion of antioxidants and attenuates oxidative stress in rat tissues. Amino Acids. 2004;27:91–96. doi: 10.1007/s00726-004-0066-8. [DOI] [PubMed] [Google Scholar]
- 36.Marcinkiewicz J, Kontny E. Taurine and inflammatory diseases. Amino Acids. 2012 doi: 10.1007/s00726-012-1361-4. [DOI] [PMC free article] [PubMed] [Google Scholar]
- 37.Roychowdhury S, Chiang DJ, Mandal P, McMullen MR, Liu X, Cohen JI, Pollard J, Feldstein AE, Nagy LE. Inhibition of Apoptosis Protects Mice from Ethanol-Mediated Acceleration of Early Markers of CCl(4) -Induced Fibrosis but not Steatosis or Inflammation. Alcohol Clin Exp Res. 2012;36:1139–1147. doi: 10.1111/j.1530-0277.2011.01720.x. [DOI] [PMC free article] [PubMed] [Google Scholar]
- 38.Bligh EG, Dyer WJ. A rapid method of total lipid extraction and purification. Can J Biochem Physiol. 1959;37:911–917. doi: 10.1139/o59-099. [DOI] [PubMed] [Google Scholar]
- 39.Lieber CS, DeCarli LM. The feeding of alcohol in liquid diets: two decades of applications and 1982 update. Alcohol Clin Exp Res. 1982;6:523–531. doi: 10.1111/j.1530-0277.1982.tb05017.x. [DOI] [PubMed] [Google Scholar]
- 40.Ichimura T, Bonventre JV, Bailly V, Wei H, Hession CA, Cate RL, Sanicola M. Kidney injury molecule-1 (KIM-1), a putative epithelial cell adhesion molecule containing a novel immunoglobulin domain, is up-regulated in renal cells after injury. J Biol Chem. 1998;273:4135–4142. doi: 10.1074/jbc.273.7.4135. [DOI] [PubMed] [Google Scholar]
- 41.Koop DR, Tierney DJ. Multiple mechanisms in the regulation of ethanol-inducible cytochrome P450IIE1. Bioessays. 1990;12:429–435. doi: 10.1002/bies.950120906. [DOI] [PubMed] [Google Scholar]
- 42.Tsimikas S, Bergmark C, Beyer RW, Patel R, Pattison J, Miller E, Juliano J, Witztum JL. Temporal increases in plasma markers of oxidized low-density lipoprotein strongly reflect the presence of acute coronary syndromes. J Am Coll Cardiol. 2003;41:360–370. doi: 10.1016/s0735-1097(02)02769-9. [DOI] [PubMed] [Google Scholar]
- 43.Prescott SM, Zimmerman GA, McIntyre TM. Platelet-activating factor. J Biol Chem. 1990;265:17381–17384. [PubMed] [Google Scholar]
- 44.Malle E, Buch T, Grone HJ. Myeloperoxidase in kidney disease. Kidney Int. 2003;64:1956–1967. doi: 10.1046/j.1523-1755.2003.00336.x. [DOI] [PubMed] [Google Scholar]
- 45.Navarro JF, Mora-Fernandez C. The role of TNF-alpha in diabetic nephropathy: pathogenic and therapeutic implications. Cytokine Growth Factor Rev. 2006;17:441–450. doi: 10.1016/j.cytogfr.2006.09.011. [DOI] [PubMed] [Google Scholar]
- 46.Vaidya VS, Ramirez V, Ichimura T, Bobadilla NA, Bonventre JV. Urinary kidney injury molecule-1: a sensitive quantitative biomarker for early detection of kidney tubular injury. Am J Physiol Renal Physiol. 2006;290:F517–529. doi: 10.1152/ajprenal.00291.2005. [DOI] [PubMed] [Google Scholar]
- 47.Greenfield TK, Midanik LT, Rogers JD. A 10-year national trend study of alcohol consumption, 1984–1995: is the period of declining drinking over? Am J Public Health. 2000;90:47–52. doi: 10.2105/ajph.90.1.47. [DOI] [PMC free article] [PubMed] [Google Scholar]
- 48.Caetano R, Cunradi C. Alcohol dependence: a public health perspective. Addiction. 2002;97:633–645. doi: 10.1046/j.1360-0443.2002.00184.x. [DOI] [PubMed] [Google Scholar]
- 49.Zakhari S. Overview: how is alcohol metabolized by the body? Alcohol Res Health. 2006;29:245–254. [PMC free article] [PubMed] [Google Scholar]
- 50.Das SK, Vasudevan DM. Alcohol-induced oxidative stress. Life Sci. 2007;81:177–187. doi: 10.1016/j.lfs.2007.05.005. [DOI] [PubMed] [Google Scholar]
- 51.Lucey MR, Mathurin P, Morgan TR. Alcoholic hepatitis. New England J Med. 2009;360:2758–2769. doi: 10.1056/NEJMra0805786. [DOI] [PubMed] [Google Scholar]
- 52.Van Thiel DH, Gavaler JS, Little JM, Lester R. Alcohol: its effect on the kidney. Metabolism. 1977;26:857–866. doi: 10.1016/0026-0495(77)90004-x. [DOI] [PubMed] [Google Scholar]
- 53.Van Thiel DH, Williams WD, Jr, Gavaler JS, Little JM, Estes LW, Rabin BS. Ethanol--its nephrotoxic effect in the rat. Am J Pathol. 1977;89:67–83. [PMC free article] [PubMed] [Google Scholar]
- 54.Cecchin E, De Marchi S. Alcohol misuse and renal damage. Addict Biol. 1996;1:7–17. doi: 10.1080/1355621961000124656. [DOI] [PubMed] [Google Scholar]
- 55.Perneger TV, Whelton PK, Puddey IB, Klag MJ. Risk of end-stage renal disease associated with alcohol consumption. Am J Epidemiol. 1999;150:1275–1281. doi: 10.1093/oxfordjournals.aje.a009958. [DOI] [PubMed] [Google Scholar]
- 56.Lu Y, Cederbaum AI. CYP2E1 and oxidative liver injury by alcohol. Free Radic Biol Med. 2008;44:723–738. doi: 10.1016/j.freeradbiomed.2007.11.004. [DOI] [PMC free article] [PubMed] [Google Scholar]
- 57.Kono H, Rusyn I, Uesugi T, Yamashina S, Connor HD, Dikalova A, Mason RP, Thurman RG. Diphenyleneiodonium sulfate, an NADPH oxidase inhibitor, prevents early alcohol-induced liver injury in the rat. Am J Physiol Gastrointest Liver Physiol. 2001;280:G1005–1012. doi: 10.1152/ajpgi.2001.280.5.G1005. [DOI] [PubMed] [Google Scholar]
- 58.Kono H, Rusyn I, Yin M, Gabele E, Yamashina S, Dikalova A, Kadiiska MB, Connor HD, Mason RP, Segal BH, Bradford BU, Holland SM, Thurman RG. NADPH oxidase-derived free radicals are key oxidants in alcohol-induced liver disease. J Clin Invest. 2000;106:867–872. doi: 10.1172/JCI9020. [DOI] [PMC free article] [PubMed] [Google Scholar]
- 59.Bhargava R, Altmann CJ, Andres-Hernando A, Webb RG, Okamura K, Yang Y, Falk S, Schmidt EP, Faubel S. Acute lung injury and acute kidney injury are established by four hours in experimental sepsis and are improved with pre, but not post, sepsis administration of TNF-alpha antibodies. PLoS One. 2013;8:e79037. doi: 10.1371/journal.pone.0079037. [DOI] [PMC free article] [PubMed] [Google Scholar]
- 60.Mathews S, Xu M, Wang H, Bertola A, Gao B. Animals models of gastrointestinal and liver diseases. Animal models of alcohol-induced liver disease: pathophysiology, translational relevance, and challenges. Am J Physiol Gastrointest Liver Physiol. 2014;306:G819–823. doi: 10.1152/ajpgi.00041.2014. [DOI] [PMC free article] [PubMed] [Google Scholar]
- 61.Lopez-Novoa JM. Potential role of platelet activating factor in acute renal failure. Kidney Int. 1999;55:1672–1682. doi: 10.1046/j.1523-1755.1999.00450.x. [DOI] [PubMed] [Google Scholar]
- 62.Predescu D, Ihida K, Predescu S, Palade GE. The vascular distribution of the platelet-activating factor receptor. Eur J Cell Biol. 1996;69:86–98. [PubMed] [Google Scholar]
- 63.Bito H, Honda Z, Nakamura M, Shimizu T. Cloning, expression and tissue distribution of rat platelet-activating-factor-receptor cDNA. Eur J Biochem. 1994;221:211–218. doi: 10.1111/j.1432-1033.1994.tb18731.x. [DOI] [PubMed] [Google Scholar]
- 64.Li JZ, Sharma R, Dileepan KN, Savin VJ. Polymorphonuclear leukocytes increase glomerular albumin permeability via hypohalous acid. Kidney Int. 1994;46:1025–1030. doi: 10.1038/ki.1994.363. [DOI] [PubMed] [Google Scholar]
- 65.Odobasic D, Kitching AR, Semple TJ, Holdsworth SR. Endogenous myeloperoxidase promotes neutrophil-mediated renal injury, but attenuates T cell immunity inducing crescentic glomerulonephritis. J Am Soc Nephrol. 2007;18:760–770. doi: 10.1681/ASN.2006040375. [DOI] [PubMed] [Google Scholar]