Abstract
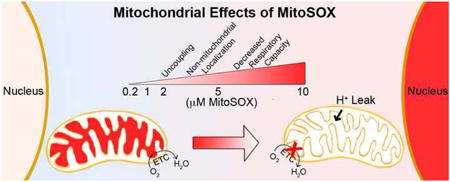
MitoSOX Red is a fluorescent probe used for the detection of mitochondrial reactive oxygen species by live cell imaging. The lipophilic, positively charged triphenylphosphonium moiety within MitoSOX concentrates the superoxide-sensitive dihydroethidium conjugate within the mitochondrial matrix. Here we investigated whether common MitoSOX imaging protocols influence mitochondrial bioenergetic function in primary rat cortical neurons and microglial cell lines. MitoSOX dose-dependently uncoupled neuronal respiration, whether present continuously in the assay medium or washed following a ten minute loading protocol. Concentrations of 5-10 μM MitoSOX caused severe loss of ATP synthesis-linked respiration. Redistribution of MitoSOX to the cytoplasm and nucleus occurred concomitant to mitochondrial uncoupling. MitoSOX also dose-dependently decreased the maximal respiration rate and this impairment could not be rescued by delivery of a complex IV specific substrate, revealing complex IV inhibition. As in neurons, loading microglial cells with MitoSOX at low micromolar concentrations resulted in uncoupled mitochondria with reduced respiratory capacity whereas submicromolar MitoSOX had no adverse effects. The MitoSOX parent compound dihydroethidium also caused mitochondrial uncoupling and respiratory inhibition at low micromolar concentrations. However, these effects were abrogated by pre-incubating dihydroethidium with cation exchange beads to remove positively charged oxidation products, which would otherwise by sequestered by polarized mitochondria. Collectively, our results suggest that the matrix accumulation of MitoSOX or dihydroethidium oxidation products causes mitochondrial uncoupling and inhibition of complex IV. Because MitoSOX is inherently capable of causing severe mitochondrial dysfunction with the potential to alter superoxide production, its use therefore requires careful optimization in imaging protocols.
Keywords: bioenergetics, Seahorse, reactive oxygen species, respiration, dihydroethidium, hydroethidine, MitoSOX
Graphical abstract
Introduction
Mitochondrial electron transport establishes the protonmotive force that drives ATP synthesis, with molecular oxygen as the terminal electron acceptor [1]. A fraction of mitochondrial oxygen consumed results from the premature leakage of electrons to form superoxide instead of from the complete reduction of oxygen by cytochrome c oxidase (complex IV) [2]. The majority of superoxide generated by mitochondria is formed in the matrix, originating from sources that include complex I, complex III, and tricarboxylic acid cycle enzymes such as α-ketoglutarate dehydrogenase [2]. Although the fraction of premature electron leakage to oxygen within mitochondria is small (<1%) in healthy cells, it increases in many disease states [3, 4]. Mitochondrial reactive oxygen species (ROS) production is implicated in aging [5], neurodegenerative disorders [4], inflammation [6, 7], and numerous other pathologies. Mitochondria-derived ROS, hydrogen peroxide in particular, are also thought be required for some physiological signal transduction mechanisms such as stabilization of the hypoxia-inducible factor-1 (HIF-1) subunit HIF-1α [8], and for mitophagy, the turnover of damaged mitochondria [9-11]. Consequently, there is intense interest in the accurate quantification of mitochondrial superoxide production in living cells.
MitoSOX™ Red is a fluorescent probe designed for precisely that purpose [12, 13]. MitoSOX was developed by conjugating triphenylphosphonium ion (TPP+), a lipophilic cation used to accumulate various cargo molecules into the highly negatively-charged mitochondrial matrix [14], to dihydroethidium, an existing probe used to detect cellular superoxide [15]. When oxidized by superoxide, dihydroethidium (also called hydroethidine) forms the superoxide-specific oxidation product 2-hydroxyethidium, whereas it forms ethidium and other byproducts when oxidized by ROS other than superoxide [16, 17]. Dihydroethidium and MitoSOX oxidation products exhibit red, largely overlapping fluorescence spectra, the intensities of which are enhanced by the presence of nucleic acids [16, 18-20]. The accumulation of red fluorescence is used as an indicator of ROS without specifying a particular species whereas quantification of the 2-hydroxyethidium or “mito”-2-hydroxyethidium oxidation products by high-performance liquid chromatography is necessary to specifically measure superoxide [17].
Importantly, MitoSOX redistributes out of mitochondria in response to stimuli that decrease mitochondrial membrane potential [21, 22]. This renders estimation of mitochondrial ROS based on cellular MitoSOX fluorescence semi-quantitative at best. This is because factors other than mitochondrial ROS affect the total cellular fluorescent signal once mitochondria are depolarized. We found that cellular MitoSOX fluorescence was enhanced when oligomycin was used to prevent ATP synthase reversal from maintaining mitochondrial membrane potential in the presence of an electron transport chain inhibitor [22]. This observation suggests that increased nucleic acid availability (i.e., cytoplasmic RNA and nuclear DNA) following efflux of MitoSOX from mitochondria may modify the fluorescent signal independently of changes in mitochondrial ROS generation (see [22] for a detailed discussion). Thus, great caution should be applied when using MitoSOX to make inferences about mitochondria-derived ROS following drug treatments or disease states with altered mitochondrial bioenergetic properties.
Even in the absence of treatment, concentration- and time-dependent redistribution of MitoSOX dye to the nucleus has been observed by multiple investigators [12, 22, 23]. This suggests that matrix accumulation of MitoSOX oxidation products dissipates mitochondrial membrane potential, thereby decreasing charge-based dye sequestration. Recently we showed that primary neurons loaded with a commonly used MitoSOX concentration (5 μM) exhibit bioenergetic derangements, consistent with the observed loss of membrane potential [22]. Avoiding bioenergetic alterations when using MitoSOX for ROS quantification is absolutely critical not only because changes in membrane potential influence dye distribution, but also because respiratory inhibition and uncoupling both can affect the rate of ROS generation [2].
In this study, we further characterized the time- and concentration-dependent effects of MitoSOX loading on mitochondrial function and intracellular dye distribution in cultured primary rat cortical neurons, with the goal of determining how MitoSOX impairs bioenergetics, as well as optimal conditions for the use of this ROS indicator. In addition, for the first time, we examined whether MitoSOX loading impairs mitochondrial function in cells of microglial origin. Our results revealed that low micromolar MitoSOX concentrations not only uncouple mitochondria in multiple neural cell types but also inhibit complex IV of the electron transport chain.
Materials and Methods
Materials
All cell culture supplies, as well as MitoSOX™ Red mitochondrial superoxide detection reagent, were from Invitrogen (Grand Island, NY). All other reagents were from Sigma-Aldrich (St. Louis, MO). Pyruvate was made fresh from powder (sodium salt, Sigma-Aldrich #P2256) prior to each experiment. Other reagents were diluted from pH-adjusted stocks stored at -20°C. Artificial cerebrospinal fluid (aCSF) assay medium consisting of NaCl (120 mM), KCl (3.5 mM), CaCl2 (1.3 mM), KH2PO4 (0.4 mM), MgCl2 (1 mM), and HEPES (5 mM) was pH-adjusted to 7.4 and stored at -20°C. Glucose (15 mM) and 4 mg/ml fatty acid-free bovine serum album (Sigma-Aldrich, catalogue #A6003) were added to aCSF on the day of the experiment.
Preparation of Primary Cortical Neurons
Primary rat cortical neurons from E18 rat cortices were prepared by enzymatic trypsin dissociation [24, 25] and cells were cultured and plated for analysis by Seahorse Bioscience XF24 microplate-based respirometry as previously described [26]. Cytosine arabinofuranoside (5 μM) added at 4 days in vitro (DIV) was used to inhibit glial proliferation. Neurons were maintained at 37°C in a humidified atmosphere of 95% air/5% CO2 and used for experiments at DIV 10-14. All procedures were approved by the University of Maryland Institutional Animal Care and Use Committee (IACUC protocol #1109008 and #0813014) and were in agreement with the NIH Guide for the Care and Use of Laboratory Animals.
O2 consumption rate (OCR) measurements
O2 consumption measurements were made using an XF24 Extracellular Flux Analyzer (Seahorse Bioscience) as described [26, 27]. Briefly, cell culture medium was removed, cells were washed once with 1 ml aCSF assay medium supplemented with glucose (15 mM) and fatty acid-free bovine serum albumin (4 mg/ml), and cells were then incubated in 675 μl of aCSF in a CO2-free incubator. For MitoSOX pre-treatments, cells were incubated with or without 0.1% dimethyl sulfoxide vehicle or MitoSOX treatments (0.2 to 10 μM). Treatments were either removed after 10 minutes of incubation or maintained throughout the experiment as indicated. In other experiments, cells were acutely exposed to MitoSOX via injection. MitoSOX and other drugs of interest were loaded into reagent delivery chambers a, b, c, d in a 75 μl volume and injected sequentially at 10×, 11×, 12×, and 13× the final working concentration, respectively. Each assay consisted of cycles of 3 min mix, 3 min wait, and 2 min measure, and was performed at 37°C.
In experiments where the exogenous electron donor N,N,N′N′-tetramethyl-p-phenylenediamine (TMPD, 0.1 mM) was used in combination with ascorbate (10 mM), the same concentrations of these chemicals were injected in a blank well on the XF24 plate at the same time the compounds were added to cells. The OCR in the blank well which contained aCSF but no cells was used to correct cellular OCR measurements for O2 consumption due to chemical auto-oxidation following TMPD plus ascorbate treatments.
MitoSOX Imaging
Primary rat cortical neurons were plated on 2 or 4-well chamber slides (model 1 German borosilicate; Lab-Tek) at a density of either 250,000 (2-well) or 125,000 neurons (4-well). Neurons were cultured to DIV 10, and then exposed to two different imaging paradigms for MitoSOX.
In the first paradigm, half of the culture medium was removed and replaced with medium containing 200 nM MitoTracker Green (for a final concentration of 100 nM), 20 μM Hoechst (for a final of 10 μM) and either 400 nM, 2 μM, 10 μM or 20 μM MitoSOX (to obtain final concentrations of 200 nM, 1 μM, 5 μM or 10 μM, respectively). Following a 10 minute incubation, neurons were then washed with dye-free aCSF three times and then immediately imaged with a Zeiss ApoTome- and AxioCamMRm Rev.3 camera-equipped AxioObserver Z1 inverted microscope (Zeiss MicroImaging), using a 100×/1.4 Plan-Apochromat objective lens.
In the second paradigm, the culture medium was removed and replaced with aCSF containing 10 μM Hoechst and 100 nM MitoTracker Green. Following a 10 min incubation, neurons were then selected for live-cell imaging based on healthy tubular mitochondrial morphology and images were captured at 2 minute intervals. Exposure times were 50 ms for MitoTracker Green (using an emission wavelength of 524 nm), 250 ms for Hoechst (using an emission wavelength of 455 nm) and 25 ms for MitoSOX (using an emission wavelength of 572 nm). Following acquisition of the 6th image (10 minutes after the initial starting baseline), FCCP was added to the medium at a final concentration of 5 μM. Following the 8th image, MitoSOX was added to the medium to a final concentration of 10 μM and the subcellular MitoSOX distribution was imaged for 30 minutes.
Results and Discussion
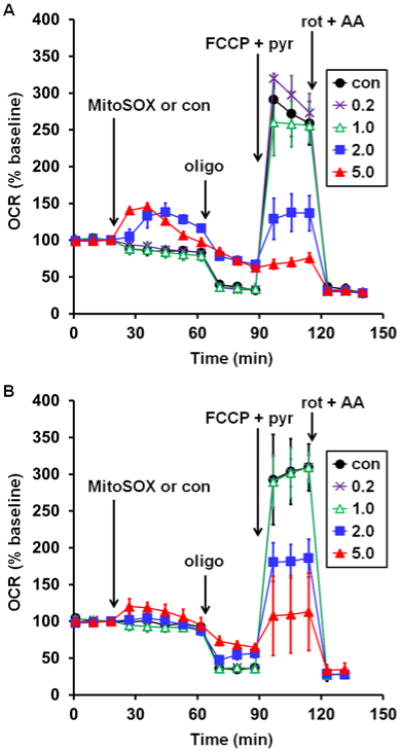
To test whether MitoSOX Red affects mitochondrial bioenergetic function, MitoSOX (0.2-10 μM) or vehicle control (0.1% dimethyl sulfoxide) was acutely added to adherent primary cortical neurons while cellular oxygen consumption rate (OCR) was monitored in real time by Seahorse XF24 microplate-based respirometry. Addition of 5 or 10 μM MitoSOX caused an elevation of OCR whereas basal O2 consumption was unchanged in response to lower (0.2-2 μM) concentrations of MitoSOX (Fig. 1A, first arrow). To investigate whether increased OCR was a response to increased energy demand or due to mitochondrial uncoupling, the ATP synthase inhibitor oligomycin (0.3 μg/ml) was added following 40 min of incubation with MitoSOX. Oligomycin suppresses respiration coupled to ATP synthase, which is controlled by energy demand, but does not suppress oxygen consumption driven by proton leak across the mitochondrial inner membrane. Oligomycin-insensitive respiration was elevated by 2, 5, or 10 μM MitoSOX (Fig. 1A, second arrow), suggesting that low micromolar concentrations of MitoSOX uncouple mitochondria. To further investigate mitochondrial function, maximal uncoupling was induced by addition of the protonophore carbonyl cyanide 4-(trifluoromethyoxy) phenylhydrazone (FCCP, 5 μM). By dissipating the proton gradient, uncoupler eliminates control of respiration by the ATP synthase. This enables estimation of maximal mitochondrial respiration, which is primarily limited by electron transport chain capacity and substrate supply. Cell permeable complex I substrate pyruvate (10 mM) was simultaneously administered to ensure that mitochondrial substrate supply was not rate limiting for respiration measurements. MitoSOX at 5 or 10 μM, but not at lower concentrations, impaired the maximal respiration rate measured in the presence of FCCP and pyruvate (Fig. 1A, third arrow). Addition of the electron transport chain inhibitors rotenone (1 μM) and antimycin A (1 μM) to inhibit Complex I and Complex III, respectively, confirmed that the majority of cellular O2 consumption was by mitochondria (Fig. 1A, fourth arrow). Both the MitoSOX-induced increase in oligomycin-insensitive respiration and the attenuation of maximal OCR were unaffected by cyclosporin A, an inhibitor of a non-selective mitochondrial inner membrane ion channel called the permeability transition pore that is a frequent cause of bioenergetic disruption (data not shown).
Fig. 1.
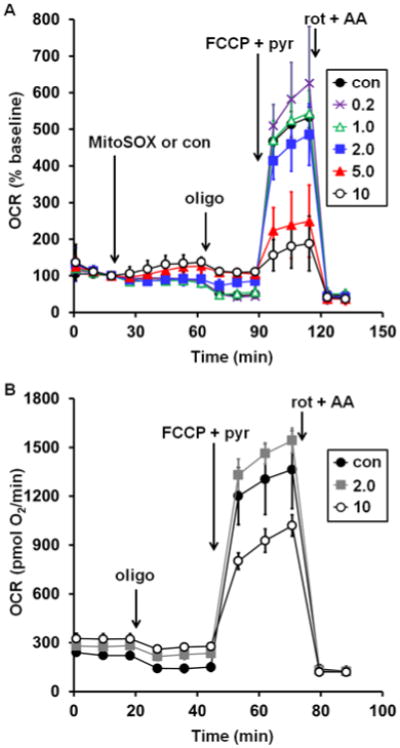
Low micromolar MitoSOX causes uncoupling and impairment of uncoupled respiration in neurons. A. Primary rat cortical neurons were treated with vehicle control (con, filled circles) or MitoSOX at the indicated concentrations after three baseline O2 consumption rate (OCR) measurements (first arrow). Subsequently, oligomycin (oligo, 0.3 μg/ml), FCCP plus pyruvate (FCCP+pyr, 5 μM and 10 mM, respectively), and a combination of rotenone (rot, 1 μM) and antimycin A (AA, 1 μM) were added as indicated (arrows). B. Primary rat cortical neurons were incubated with vehicle control (con, filled circles) or MitoSOX at the indicated concentrations for 10 minutes and then washed in MitoSOX-free aCSF prior to the start of the three baseline OCR measurements. Oligo, FCCP+pyr, and rot+AA were then added as in A. Results in A and B are mean ± SD (n=3 wells) and are representative of two independent experiments. OCR is baseline-normalized to the point immediately prior to MitoSOX addition in A while absolute OCR are given in pmol O2/min in B. Numbers in legends correspond to MitoSOX concentration in μM.
The results in Fig. 1A establish that continuous exposure of neurons to low micromolar concentrations of MitoSOX for ≥40 min detrimentally affect mitochondrial bioenergetic function. However, a common loading protocol for MitoSOX imaging consists of only a short, 10 min incubation with 10 μM dye followed by washing cells in MitoSOX-free assay medium [28]. We mimicked this loading protocol, adding MitoSOX for a 10 min period followed by washing out the dye using aCSF without MitoSOX. Similar to findings with continuous MitoSOX exposure, transient MitoSOX loading at 10 μM caused both an elevation in oligomycin-insensitive respiration (Fig. 1B, first arrow) and impaired respiratory capacity (Fig. 1B, second arrow), whereas loading at 2 μM was innocuous. Previously we reported that cell loading at 5 μM MitoSOX for 10 min caused increased oligomycin-insensitive respiration but did not impair respiratory capacity [22]. Thus, uncoupling occurs prior to respiratory inhibition. This also indicates that respiratory inhibition by MitoSOX is not only concentration-dependent but also time-dependent, as neuronal respiratory capacity was impaired after a longer, 40 min incubation with 5 μM MitoSOX (Fig. 1A) though not with transient, 10 min exposure [22], except at the higher concentration of 10 μM (Fig. 1B). Finally, because the increase in oligomycin-insensitive O2 consumption that is suggestive of uncoupling was present not only during continuous MitoSOX exposure but also following washout, it is unlikely that utilization of the protonmotive force for MitoSOX accumulation is the primary reason for this increase.
Next, we investigated the subcellular distribution of MitoSOX dye at the various loading concentrations in primary cortical neurons concurrently labeled with MitoTracker Green to reveal mitochondrial morphology and with Hoechst to stain nuclei. Imaging cells following a 10 min incubation with 200 nM or 1 μM MitoSOX revealed a primarily mitochondrial localization of MitoSOX and addition of the mitochondria-targeted MitoSOX dye did not have a noticeable impact on mitochondrial morphology (Fig. 2). However, loading at the higher concentrations of 5 or 10 μM MitoSOX caused a predominantly non-mitochondrial localization of the dye (Fig. 2). Consistent with mitochondrial bioenergetic dysfunction at these concentrations, mitochondrial morphology was dramatically altered, with numerous rounded up and distended structures appearing.
Fig. 2.
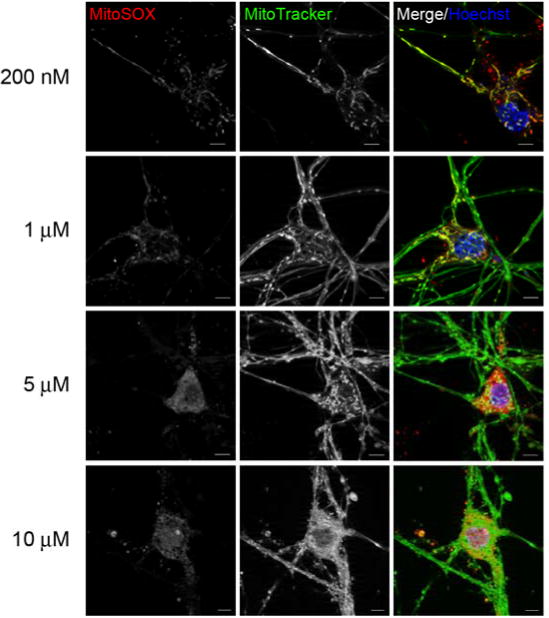
Low micromolar concentrations of MitoSOX show non-mitochondrial localization. In A, primary rat cortical neurons were incubated with 100 nM MitoTracker Green (green), 10 μM Hoechst (blue) and either 200 nM, 1 μM, 5 μM or 10 μM MitoSOX (red) for 10 min. Cells were then washed three times in dye-free aCSF and immediately imaged. The scale bars are 5 μm.
To test whether MitoSOX matrix accumulation is required for MitoSOX to impair mitochondrial respiratory capacity, FCCP was added first to abolish the protonmotive force required for mitochondrial MitoSOX uptake, followed by the subsequent addition of MitoSOX (10 μM). Although respiration in the presence of FCCP plus pyruvate was unstable and declined slowly over time, MitoSOX injection did not increase the rate of this decline compared to vehicle-treated cells (Fig. 3A). Nevertheless, MitoSOX impaired FCCP-stimulated respiration when added prior to FCCP on the same plate of cells (Fig. 3B), consistent with the results in Fig. 1. Lack of effect of MitoSOX on uncoupled respiration when the protonmotive force was already dissipated was confirmed using 2,4-dinitrophenol (DNP, 200 μM), a different mitochondrial uncoupler (data not shown). As expected, live-cell imaging revealed that MitoSOX does not localize to mitochondria when added following the uncoupler FCCP (Figure 4), consistent with the requirement for mitochondrial membrane potential for recruitment of MitoSOX to the matrix.
Fig. 3.
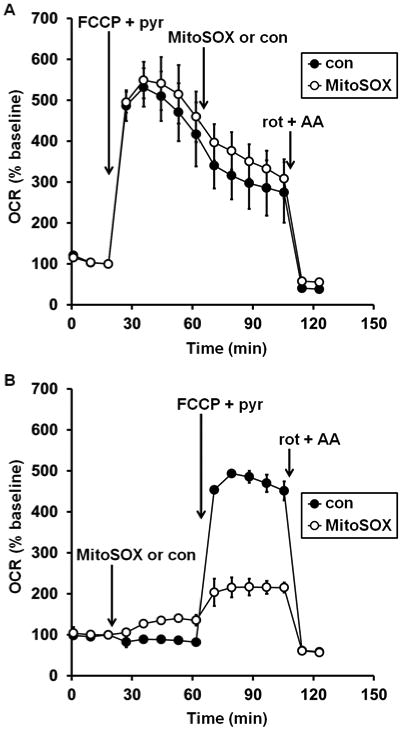
Mitochondrial matrix accumulation is required for MitoSOX inhibition of uncoupled respiration. In A, primary rat cortical neurons were treated with FCCP plus pyruvate (FCCP+pyr, 5 μM and 10 mM, respectively, first arrow), followed by vehicle control (con, filled circles) or MitoSOX (10 μM, open circles), and finally with a combination of rotenone (rot, 1 μM) and antimycin A (AA, 1 μM). In B, neurons in other wells on the same plate were first treated with MitoSOX or vehicle control, then with FCCP+pyr and rot+AA. Results in A and B are mean ± SD (n=3 wells) and are representative of two independent experiments. OCR is baseline-normalized to the point immediately prior to the first addition.
Fig. 4.
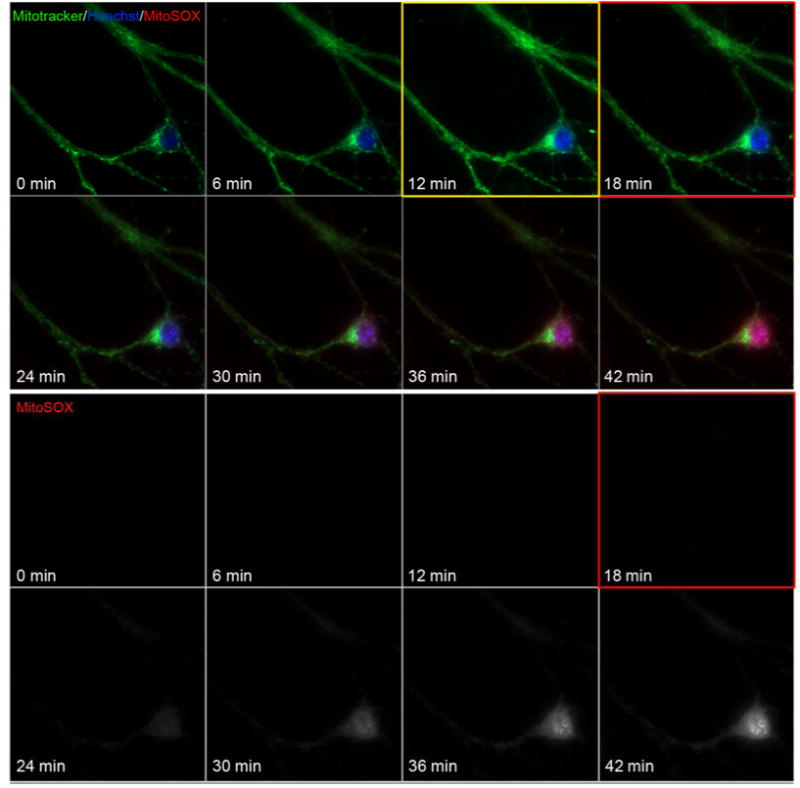
Mitochondrial localization of MitoSOX requires membrane potential. In A, primary rat cortical neurons were incubated with 100 nM MitoTracker green and 10 μM Hoechst for 10 min. Candidate neurons were selected for imaging by their mitochondrial stain and images were collected at a 2 min interval. Prior to the 7th image FCCP was added to a final concentration of 5 μM to depolarize mitochondria (yellow boxed image, FCCP added following 10 min of baseline imaging). Cells were imaged for 2 more images, and then MitoSOX to 10 μM was added (prior to red boxed image). Neurons were then imaged for an additional 30 minutes to visualize cellular MitoSOX accumulation.
The observation that the attenuation of respiratory capacity caused by MitoSOX is time-dependent raises the possibility that it is the accumulation of oxidized products, rather than the dye itself, which is deleterious to mitochondria. The MitoSOX parent compound dihydroethidium is uncharged whereas the oxidized products 2-hydroxyethidium and ethidium each have a positive charge. Excessive and/or prolonged incubation of immortalized cells with dihydroethidium is reported to cause the mitochondrial accumulation of its charged oxidized products, respiratory alterations similar to those caused by MitoSOX, and toxicity to cells [29]. It has long been known that ethidium bromide uncouples mitochondria and inhibits respiration, albeit at >100 μM, when added to isolated mitochondria [30]. To test whether dihydroethidium or its oxidized products, like MitoSOX, can induce mitochondrial respiratory changes, we loaded primary rat neurons with dihydroethidium at varying concentrations for 40 minutes in an analogous experiment to Fig. 1A. Pronounced attenuation of mitochondrial respiratory capacity was observed in neurons incubated with 5 or 10 μM dihydroethidium; in cells incubated with 10 μM of the drug, an elevation of oligomycin-insensitive OCR was observed as well (Fig. 5A). In imaging experiments, preincubation of dihydroethidium with cation exchange beads is frequently conducted to remove any positively charged oxidation products prior to cell loading [21, 31]. To assess whether dihydroethidium-induced mitochondrial impairments require the presence of charged derivatives, we incubated the dihydroethidium stock solution used for the experiment depicted in Fig. 5A with cation exchange beads for 30 min on a rotator and then conducted an identical experiment with a new plate of neurons. Preincubation of dihydroethidium with cation exchange beads abrogated mitochondrial uncoupling and loss of respiratory capacity that were otherwise observed with dihydroethidium loading (Fig. 5B). This finding suggests that it is the oxidized products of dihydroethidium and by analogy, of MitoSOX, that are most detrimental to the normal functioning of mitochondria. Because MitoSOX itself is charged, it is not possible to selectively remove oxidized products using cation exchange beads as was done for dihydroethidium.
Fig. 5.
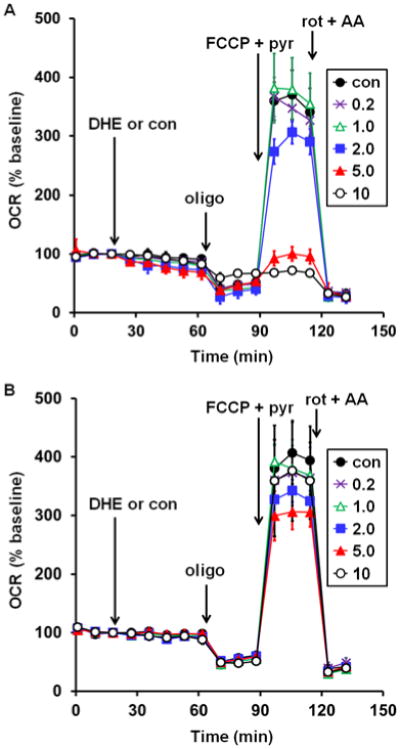
Prevention of dihydroethidium-induced uncoupling and impairment of maximal respiration by removal of charged oxidation products using cation exchange beads. A. Primary rat cortical neurons were treated with vehicle control (con, filled circles) or dihydroethidium (DHE) at the indicated concentrations after three baseline O2 consumption rate (OCR) measurements (first arrow). Other additions were as in Fig. 1A. Results are mean ± SD (n=3 wells) and are representative of two independent experiments. OCR is baseline-normalized to the point immediately prior to DHE addition. Numbers in legends correspond to DHE concentration in μM. B. The same experiment that was depicted in A but following a preincubation of DHE with cation exchange beads for 30 minutes.
Next, we sought to determine the site within the electron transport chain that is inhibited by MitoSOX. Intact neurons were incubated with 10 μM MitoSOX for 40 min, a paradigm that causes both uncoupling and ablation of respiratory capacity (see Fig. 1A). The plasma membrane of neurons was then acutely permeabilized using saponin under conditions that preserve mitochondrial integrity and function [26], enabling control of mitochondrial substrate supply. We found that respiration was deficient in MitoSOX-incubated cells relative to control, regardless of whether respiration was stimulated by ADP in the presence of the complex I-linked substrates pyruvate and malate (Fig. 6A, second arrow) or in the presence of the complex II substrate succinate and the complex I inhibitor rotenone (Fig. 6B, second arrow). Although it is possible that MitoSOX independently inhibits complex I and complex II, it is more likely that MitoSOX inhibits respiration at a common site downstream of these complexes.
Fig. 6.
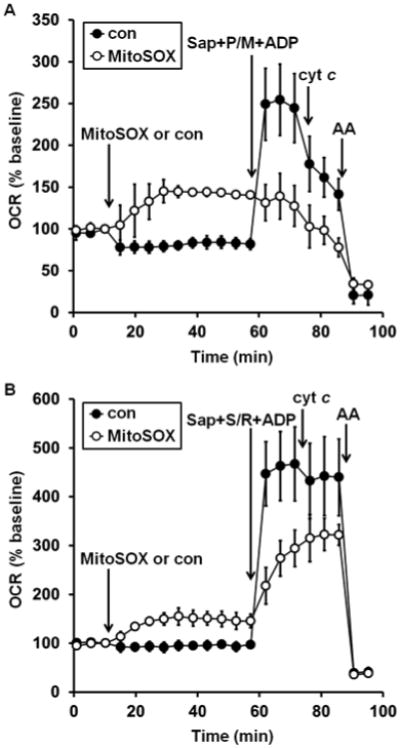
MitoSOX impairs both complex I- and complex II-dependent ADP-stimulated respiration. A. Primary rat cortical neurons were treated with vehicle control (con, filled circles) or MitoSOX (10 μM, open circles) after three baseline O2 consumption rate (OCR) measurements (first arrow). Neurons were permeabilized by saponin (sap, 25 μg/ml) in the presence of EGTA (5 mM, second arrow). Pyruvate and malate (P/M, 5 mM each), ADP (1 mM), and excess K2PHO4 (3.6 mM for 4 mM final) were co-injected with saponin to measure complex I-dependent ADP-stimulated respiration. Purified cytochrome c (cyt c, 100 μM) was injected at the third arrow, followed by antimycin A (AA, 1 μM) at the fourth arrow. B. The same experiment as depicted in A, but with the complex II substrate succinate (S, 5 mM) and the complex I inhibitor rotenone (R, 0.5 μM) added in place of complex I substrates pyruvate and malate. Results in A and B are mean ± SD (n=3 wells) and are representative of two independent experiments. OCR is baseline-normalized to the point immediately prior to the first addition.
In addition to direct electron transport chain complex inhibition, cytochrome c loss from the mitochondrial intermembrane space is another mechanism by which mitochondrial O2 consumption can be abolished [32, 33]. To assess whether the MitoSOX-induced diminution of respiratory capacity is due to cytochrome c release, we tested whether respiration could be restored by exogenous cytochrome c. Although we previously established that delivery of purified cytochrome c to saponin-permeabilized cells rescues impaired O2 consumption due to Bax/Bak-dependent cytochrome c release [33, 34], cytochrome c addition did not restore the respiratory impairment caused by MitoSOX incubation (Fig. 6, third arrow). This result indicates that cytochrome c loss alone is not responsible for the respiratory inhibition. To test whether MitoSOX inhibits complex IV downstream of cytochrome c, we added the cell permeable artificial electron donor N,N,N′N′-tetramethyl-p-phenylenediamine (TMPD) in combination with ascorbate and the complex III inhibitor antimycin A. TMPD donates electrons to cytochrome c, which then transfers electrons to complex IV while oxidized TMPD is reduced by ascorbate [35, 36]. O2 is then consumed by complex IV, independent of complex I, II, or III activity [35, 36]. As expected, TMPD plus ascorbate fully supported uncoupled respiration in the presence of an antimycin A concentration that inhibits O2 consumption in the absence of TMPD (Fig. 7). Furthermore, OCR measured following addition of TMPD, ascorbate, and antimycin A was sensitive to the complex IV inhibitor azide, consistent with O2 consumption by complex IV. Importantly, uncoupler-stimulated respiration remained suppressed by MitoSOX even when complex IV activity was isolated by using the complex IV-specific substrate TMPD in the presence of a complex III inhibitor. While this result does not exclude the possibility that MitoSOX also inhibits the electron transport chain proximal to complex IV, it does establish that complex IV is a major locus of inhibition by MitoSOX.
Fig. 7.
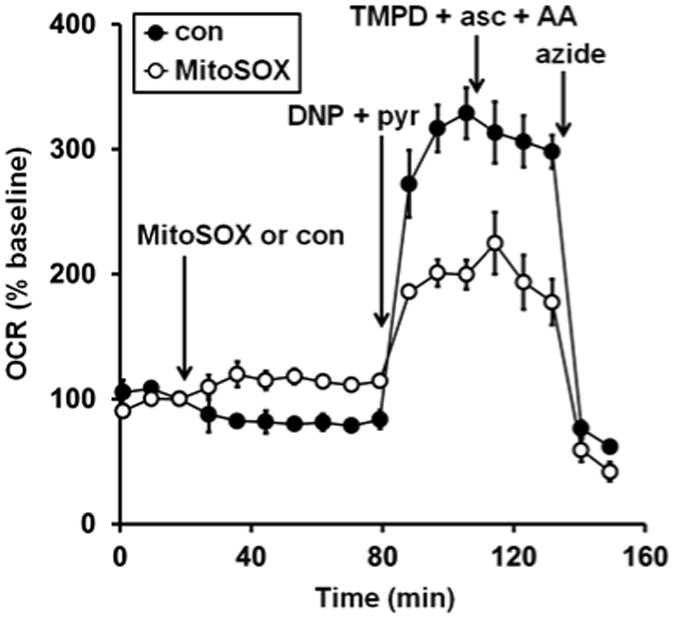
Complex IV substrate fails to rescue MitoSOX impaired oxygen consumption. Primary rat cortical neurons were treated with vehicle control (con, filled circles) or MitoSOX (10 μM, open circles) after three baseline O2 consumption rate (OCR) measurements (first arrow). Next, the uncoupler 2,4-dinitrophenol plus pyruvate (DNP+pyr, 200 μM and 10 mM, respectively) was added (second arrow), followed by the addition of a combination of TMPD (0.1 mM), ascorbate (asc, 10 mM), and antimycin A (AA, 1 μM, third arrow). Finally sodium azide (5 mM) was added (azide, fourth arrow). TMPD + asc + AA was included in a well with no cells to correct for O2 consumption due to auto-oxidation reactions. Results are mean ± SD (n=3-4 wells) and are representative of two independent experiments. OCR is baseline-normalized to the point immediately prior to MitoSOX addition.
Finally, to assess whether the ability of low micromolar MitoSOX concentrations to impact mitochondrial bioenergetics is specific to neurons or also occurs in other cell types, we incubated two commonly used microglial cell lines with a range of MitoSOX concentrations for 40 minutes and evaluated mitochondrial coupling and respiratory capacity. Microglial cells were selected for this study because mitochondrial ROS, typically evaluated using 5 μM MitoSOX, have been implicated in the signal transduction process of proinflammatory microglial activation [7]. Similar to the results seen in neurons (Fig. 1A), incubation with 5 μM MitoSOX for 40 min led to both an increase in oligomycin-insensitive respiration and a decrease in the maximal respiration rate measured in the presence of FCCP in rat HAPI (Fig. 8A) and mouse BV2 (Fig. 8B) microglial cells. In contrast to the results in neurons, uncoupling and respiratory inhibition were also substantial when microglial cells were incubated with only 2 μM MitoSOX (Fig. 8). This finding indicates that the dose-response relationship of bioenergetic alterations caused by MitoSOX depends on cell type.
Fig. 8.
Low micromolar MitoSOX causes mitochondrial bioenergetic dysfunction in microglial cells. Rat HAPI (A) or mouse BV2 (B) microglial cells were treated with vehicle control (con, filled circles) or MitoSOX at the indicated concentrations after three baseline O2 consumption rate (OCR) measurements (first arrow). Subsequently, oligomycin (oligo, 0.3 μg/ml), FCCP plus pyruvate (FCCP+pyr, 5 μM and 10 mM, respectively), and a combination of rotenone (rot, 1 μM) and antimycin A (AA, 1 μM) were added as indicated (arrows). Results in A and B are mean ± SD (n=4 wells) and are representative of two independent experiments. OCR is baseline-normalized to the point immediately prior to MitoSOX addition. Numbers in legends correspond to MitoSOX concentration in μM.
Conclusions
Collectively, our data indicate that the ROS-sensitive MitoSOX probe at the low micromolar concentrations often used for imaging experiments can cause mitochondrial uncoupling and inhibition of both ADP-stimulated and uncoupled respiration. We showed that MitoSOX inhibits complex IV but our data do not exclude the possibility that MitoSOX also interferes with additional components of the electron transport chain. The finding that the MitoSOX parent compound dihydroethidium induces bioenergetic changes similar to MitoSOX under conditions where its oxidized products can be sequestered by mitochondria suggests that similar MitoSOX and dihydroethidium oxidation products are primarily responsible for the respiratory changes. TPP+ derivatives other than MitoSOX have also been shown to alter mitochondrial bioenergetics, with the particular conjugated functional group and alkyl linker influencing whether uncoupling and/or inhibition of electron transport are observed [37-39]. Therefore the TPP+ moiety within MitoSOX may contribute to the observed bioenergetic effects, particularly uncoupling, which was more pronounced for MitoSOX (Fig. 1A) compared to dihydroethidium (Fig. 5A). Importantly, MitoSOX impairs respiratory capacity even when the dye is removed by washing after 10 min or extruded from the matrix by uncoupler-induced membrane potential depolarization after 40 minutes, indicating that damage to mitochondria is not readily reversed.
We also demonstrated that extrusion of MitoSOX from mitochondria occurs at concentrations of MitoSOX that disrupt bioenergetic function, revealing that intracellular fluorescence at these MitoSOX concentrations is no longer an accurate reflection of MitoSOX oxidation within the matrix. Therefore, quantification of MitoSOX fluorescence without verifying mitochondrial localization (e.g. by flow cytometry or microplate-based fluorescence) is strongly discouraged, as the signal cannot be conclusively attributed to mitochondrial ROS.
MitoSOX is designed to measure mitochondrial superoxide and other reactive oxygen species. Impairment of mitochondrial bioenergetics by MitoSOX will confound such measurements not only by modifying MitoSOX localization but also by potentially modifying the very species it is designed to detect, as it is well-established that uncoupling and complex IV inhibition influence mitochondrial ROS [2]. Restriction of MitoSOX to 200 nM in ROS imaging experiments is recommended since at this loading concentration fluorescent oxidation products display complete mitochondrial localization in neurons and do not build up enough to alter bioenergetics.
Acknowledgments
This work was supported by the National Institutes of Health [R01NS064978, R01NS085165, and P01HD016596].
Abbreviations
- aCSF
artificial cerebrospinal fluid
- DIV
days in vitro
- DNP
2,4-dinitrophenol
- FCCP
carbonyl cyanide 4-(trifluoromethyoxy) phenylhydrazone
- HIF-1
hypoxia-inducible factor-1
- OCR
oxygen consumption rate
- ROS
reactive oxygen species
- TMPD
N,N,N′,N′-tetramethyl-p-phenylenediamine
- TPP+
triphenylphosphonium ion
Footnotes
Publisher's Disclaimer: This is a PDF file of an unedited manuscript that has been accepted for publication. As a service to our customers we are providing this early version of the manuscript. The manuscript will undergo copyediting, typesetting, and review of the resulting proof before it is published in its final citable form. Please note that during the production process errors may be discovered which could affect the content, and all legal disclaimers that apply to the journal pertain.
References
- 1.Nicholls DG, Ferguson SJ. Bioenergetics. Vol. 4. London: Academic Press; 2013. [Google Scholar]
- 2.Andreyev AY, Kushnareva YE, Starkov AA. Mitochondrial metabolism of reactive oxygen species. Biochemistry (Mosc) 2005;70:200–14. doi: 10.1007/s10541-005-0102-7. [DOI] [PubMed] [Google Scholar]
- 3.Tahara EB, Navarete FD, Kowaltowski AJ. Tissue-, substrate-, and site-specific characteristics of mitochondrial reactive oxygen species generation. Free Radic Biol Med. 2009;46:1283–97. doi: 10.1016/j.freeradbiomed.2009.02.008. [DOI] [PubMed] [Google Scholar]
- 4.Lin MT, Beal MF. Mitochondrial dysfunction and oxidative stress in neurodegenerative diseases. Nature. 2006;443:787–95. doi: 10.1038/nature05292. [DOI] [PubMed] [Google Scholar]
- 5.Dai DF, Chiao YA, Marcinek DJ, Szeto HH, Rabinovitch PS. Mitochondrial oxidative stress in aging and healthspan. Longev Healthspan. 2014;3:6. doi: 10.1186/2046-2395-3-6. [DOI] [PMC free article] [PubMed] [Google Scholar]
- 6.Pelletier M, Lepow TS, Billingham LK, Murphy MP, Siegel RM. New tricks from an old dog: mitochondrial redox signaling in cellular inflammation. Semin Immunol. 2012;24:384–92. doi: 10.1016/j.smim.2013.01.002. [DOI] [PMC free article] [PubMed] [Google Scholar]
- 7.Bordt EA, Polster BM. NADPH oxidase- and mitochondria-derived reactive oxygen species in proinflammatory microglial activation: a bipartisan affair? Free Radic Biol Med. 2014;76C:34–46. doi: 10.1016/j.freeradbiomed.2014.07.033. [DOI] [PMC free article] [PubMed] [Google Scholar]
- 8.Brunelle JK, Bell EL, Quesada NM, Vercauteren K, Tiranti V, Zeviani M, et al. Oxygen sensing requires mitochondrial ROS but not oxidative phosphorylation. Cell Metab. 2005;1:409–14. doi: 10.1016/j.cmet.2005.05.002. [DOI] [PubMed] [Google Scholar]
- 9.Twig G, Elorza A, Molina AJ, Mohamed H, Wikstrom JD, Walzer G, et al. Fission and selective fusion govern mitochondrial segregation and elimination by autophagy. EMBO J. 2000;27:433–46. doi: 10.1038/sj.emboj.7601963. [DOI] [PMC free article] [PubMed] [Google Scholar]
- 10.Wang Y, Nartiss Y, Steipe B, McQuibban GA, Kim PK. ROS-induced mitochondrial depolarization initiates PARK2/PARKIN-dependent mitochondrial degradation by autophagy. Autophagy. 2012;8:1462–76. doi: 10.4161/auto.21211. [DOI] [PubMed] [Google Scholar]
- 11.Joselin AP, Hewitt SJ, Callaghan SM, Kim RH, Chung YH, Mak TW, et al. ROS-dependent regulation of Parkin and DJ-1 localization during oxidative stress in neurons. Hum Mol Genet. 2012;21:4888–903. doi: 10.1093/hmg/dds325. [DOI] [PubMed] [Google Scholar]
- 12.Robinson KM, Janes MS, Pehar M, Monette JS, Ross MF, Hagen TM, et al. Selective fluorescent imaging of superoxide in vivo using ethidium-based probes. Proc Natl Acad Sci U S A. 2006;103:15038–43. doi: 10.1073/pnas.0601945103. [DOI] [PMC free article] [PubMed] [Google Scholar]
- 13.Mukhopadhyay P, Rajesh M, Yoshihiro K, Hasko G, Pacher P. Simple quantitative detection of mitochondrial superoxide production in live cells. Biochem Biophys Res Commun. 2007;358:203–8. doi: 10.1016/j.bbrc.2007.04.106. [DOI] [PMC free article] [PubMed] [Google Scholar]
- 14.Ross MF, Kelso GF, Blaikie FH, James AM, Cocheme HM, Filipovska A, et al. Lipophilic triphenylphosphonium cations as tools in mitochondrial bioenergetics and free radical biology. Biochemistry (Mosc) 2005;70:222–30. doi: 10.1007/s10541-005-0104-5. [DOI] [PubMed] [Google Scholar]
- 15.Benov L, Sztejnberg L, Fridovich I. Critical evaluation of the use of hydroethidine as a measure of superoxide anion radical. Free Radic Biol Med. 1998;25:826–31. doi: 10.1016/s0891-5849(98)00163-4. [DOI] [PubMed] [Google Scholar]
- 16.Zhao H, Joseph J, Fales HM, Sokoloski EA, Levine RL, Vasquez-Vivar J, et al. Detection and characterization of the product of hydroethidine and intracellular superoxide by HPLC and limitations of fluorescence. Proc Natl Acad Sci U S A. 2005;102:5727–32. doi: 10.1073/pnas.0501719102. [DOI] [PMC free article] [PubMed] [Google Scholar]
- 17.Zielonka J, Kalyanaraman B. Hydroethidine- and MitoSOX-derived red fluorescence is not a reliable indicator of intracellular superoxide formation: another inconvenient truth. Free Radic Biol Med. 2010;48:983–1001. doi: 10.1016/j.freeradbiomed.2010.01.028. [DOI] [PMC free article] [PubMed] [Google Scholar]
- 18.Olmsted J, III, Kearns DR. Mechanism of ethidium bromide fluorescence enhancement on binding to nucleic acids. Biochemistry. 1977;16:3647–54. doi: 10.1021/bi00635a022. [DOI] [PubMed] [Google Scholar]
- 19.Zhao H, Kalivendi S, Zhang H, Joseph J, Nithipatikom K, Vasquez-Vivar J, et al. Superoxide reacts with hydroethidine but forms a fluorescent product that is distinctly different from ethidium: potential implications in intracellular fluorescence detection of superoxide. Free Radic Biol Med. 2003;34:1359–68. doi: 10.1016/s0891-5849(03)00142-4. [DOI] [PubMed] [Google Scholar]
- 20.LePecq JB, Paoletti C. A fluorescent complex between ethidium bromide and nucleic acids. Physical-chemical characterization. J Mol Biol. 1967;27:87–106. doi: 10.1016/0022-2836(67)90353-1. [DOI] [PubMed] [Google Scholar]
- 21.Johnson-Cadwell LI, Jekabsons MB, Wang A, Polster BM, Nicholls DG. ‘Mild Uncoupling’ does not decrease mitochondrial superoxide levels in cultured cerebellar granule neurons but decreases spare respiratory capacity and increases toxicity to glutamate and oxidative stress. J Neurochem. 2007;101:1619–31. doi: 10.1111/j.1471-4159.2007.04516.x. [DOI] [PubMed] [Google Scholar]
- 22.Polster BM, Nicholls DG, Ge SX, Roelofs BA. Use of potentiometric fluorophores in the measurement of mitochondrial reactive oxygen species. Methods Enzymol. 2014;547:225–50. doi: 10.1016/B978-0-12-801415-8.00013-8. [DOI] [PMC free article] [PubMed] [Google Scholar]
- 23.Voloboueva LA, Emery JF, Sun X, Giffard RG. Inflammatory response of microglial BV-2 cells includes a glycolytic shift and is modulated by mitochondrial glucose-regulated protein 75/mortalin. FEBS Lett. 2013;587:756–62. doi: 10.1016/j.febslet.2013.01.067. [DOI] [PMC free article] [PubMed] [Google Scholar]
- 24.Stoica BA, Movsesyan VA, Knoblach SM, Faden AI. Ceramide induces neuronal apoptosis through mitogen-activated protein kinases and causes release of multiple mitochondrial proteins. Mol Cell Neurosci. 2005;29:355–71. doi: 10.1016/j.mcn.2005.02.009. [DOI] [PubMed] [Google Scholar]
- 25.Yakovlev AG, Ota K, Wang G, Movsesyan V, Bao WL, Yoshihara K, et al. Differential expression of apoptotic protease-activating factor-1 and caspase-3 genes and susceptibility to apoptosis during brain development and after traumatic brain injury. J Neurosci. 2001;21:7439–46. doi: 10.1523/JNEUROSCI.21-19-07439.2001. [DOI] [PMC free article] [PubMed] [Google Scholar]
- 26.Clerc P, Polster BM. Investigation of mitochondrial dysfunction by sequential microplate-based respiration measurements from intact and permeabilized neurons. PLoS ONE. 2012;7:e34465. doi: 10.1371/journal.pone.0034465. [DOI] [PMC free article] [PubMed] [Google Scholar]
- 27.Wu M, Neilson A, Swift AL, Moran R, Tamagnine J, Parslow D, et al. Multiparameter metabolic analysis reveals a close link between attenuated mitochondrial bioenergetic function and enhanced glycolysis dependency in human tumor cells. Am J Physiol Cell Physiol. 2007;292:C125–C136. doi: 10.1152/ajpcell.00247.2006. [DOI] [PubMed] [Google Scholar]
- 28.Mukhopadhyay P, Rajesh M, Hasko G, Hawkins BJ, Madesh M, Pacher P. Simultaneous detection of apoptosis and mitochondrial superoxide production in live cells by flow cytometry and confocal microscopy. Nat Protoc. 2007;2:2295–301. doi: 10.1038/nprot.2007.327. [DOI] [PMC free article] [PubMed] [Google Scholar]
- 29.Lyublinskaya OG, Zenin VV, Shatrova AN, Aksenov ND, Zemelko VI, Domnina AP, et al. Intracellular oxidation of hydroethidine: compartmentalization and cytotoxicity of oxidation products. Free Radic Biol Med. 2014;75:60–8. doi: 10.1016/j.freeradbiomed.2014.07.008. [DOI] [PubMed] [Google Scholar]
- 30.Miko M, Chance B. Ethidium bromide as an uncoupler of oxidative phosphorylation. FEBS Lett. 1975;54:347–52. doi: 10.1016/0014-5793(75)80937-9. [DOI] [PubMed] [Google Scholar]
- 31.Vesce S, Kirk L, Nicholls DG. Relationships between superoxide levels and delayed calcium deregulation in cultured cerebellar granule cells exposed continuously to glutamate. J Neurochem. 2004;90:683–93. doi: 10.1111/j.1471-4159.2004.02516.x. [DOI] [PubMed] [Google Scholar]
- 32.Polster BM, Kinnally KW, Fiskum G. BH3 death domain peptide induces cell type-selective mitochondrial outer membrane permeability. J Biol Chem. 2001;276:37887–94. doi: 10.1074/jbc.M104552200. [DOI] [PubMed] [Google Scholar]
- 33.Clerc P, Carey GB, Mehrabian Z, Wei M, Hwang H, Girnun GD, et al. Rapid Detection of an ABT-737-Sensitive Primed for Death State in Cells Using Microplate-Based Respirometry. PLoS ONE. 2012;7:e42487. doi: 10.1371/journal.pone.0042487. [DOI] [PMC free article] [PubMed] [Google Scholar]
- 34.Clerc P, Ge SX, Hwang H, Waddell J, Roelofs BA, Karbowski M, et al. Drp1 is dispensable for apoptotic cytochrome c release in primed MCF10A and fibroblast cells but affects Bcl-2 antagonist-induced respiratory changes. Br J Pharmacol. 2014;171:1988–99. doi: 10.1111/bph.12515. [DOI] [PMC free article] [PubMed] [Google Scholar]
- 35.Packer L, Mustafa MG. Pathways of electron flow established by tetramethylphenylenediamine in mitochondria and ascites tumor cells. Biochim Biophys Acta. 1966;113:1–12. doi: 10.1016/s0926-6593(66)80115-7. [DOI] [PubMed] [Google Scholar]
- 36.Villani G, Greco M, Papa S, Attardi G. Low reserve of cytochrome c oxidase capacity in vivo in the respiratory chain of a variety of human cell types. J Biol Chem. 1998;273:31829–36. doi: 10.1074/jbc.273.48.31829. [DOI] [PubMed] [Google Scholar]
- 37.Fink BD, Herlein JA, Yorek MA, Fenner AM, Kerns RJ, Sivitz WI. Bioenergetic effects of mitochondrial-targeted coenzyme Q analogs in endothelial cells. J Pharmacol Exp Ther. 2012;342:709–19. doi: 10.1124/jpet.112.195586. [DOI] [PMC free article] [PubMed] [Google Scholar]
- 38.Reily C, Mitchell T, Chacko BK, Benavides G, Murphy MP, Darley-Usmar V. Mitochondrially targeted compounds and their impact on cellular bioenergetics. Redox Biol. 2013;1:86–93. doi: 10.1016/j.redox.2012.11.009. [DOI] [PMC free article] [PubMed] [Google Scholar]
- 39.Trnka J, Elkalaf M, Andel M. Lipophilic triphenylphosphonium cations inhibit mitochondrial electron transport chain and induce mitochondrial proton leak. PLoS ONE. 2015;10:e0121837. doi: 10.1371/journal.pone.0121837. [DOI] [PMC free article] [PubMed] [Google Scholar]


