Abstract
Ca2+ activation and membrane electroporation by 10-ns and 4-ms electric pulses (nsEP and msEP) were compared in rat embryonic cardiomyocytes. The lowest electric field which triggered Ca2+ transients was expectedly higher for nsEP (36 kV/cm) than for msEP (0.09 kV/cm) but the respective doses were similar (190 and 460 mJ/g). At higher intensities, both stimuli triggered prolonged firing in quiescent cells. An increase of basal Ca2+ level by >10 nM in cells with blocked voltage-gated Ca2+ channels and depleted Ca2+ depot occurred at 63 kV/cm (nsEP) or 0.14 kV/cm (msEP) and was regarded as electroporation threshold. These electric field values were at 150–230% of stimulation thresholds for both msEP and nsEP, notwithstanding a 400,000-fold difference in pulse duration. For comparable levels of electroporative Ca2+ uptake, msEP caused at least 10-fold greater uptake of propidium than nsEP, suggesting increased yield of larger pores. Electroporation by msEP started Ca2+ entry abruptly and locally at the electrode-facing poles of cell, followed by a slow diffusion to the center. In a stark contrast, nsEP evoked a “supra-electroporation” pattern of slower but spatially uniform Ca2+ entry. Thus nsEP and msEP had comparable dose efficiency, but differed profoundly in the size and localization of electropores.
Keywords: Electroporation, electropermeabilization, calcium activation, nanosecond electric pulses, cardiomyocytes
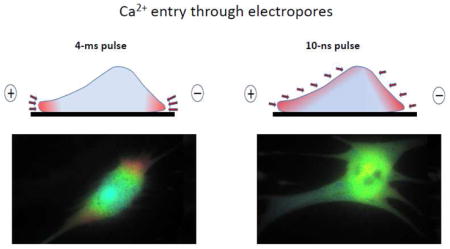
Graphical abstract
Introduction
During the last decade, the research into bioeffects of intense, nanosecond duration electric pulses (nsEP) has been growing exponentially. The principal directions of this research are the lethal cell damage by nsEP and its mechanisms[1–6], with emerging applications in cancer and tissue ablation[7–11], and the biophysical mechanisms of membrane permeabilization by nsEP, properties of electropores, and their impact on cell function[4, 12–16]. Recently, more studies have focused on cell stimulation and Ca2+ activation by nsEP, potentially leading to some unique physiological and medical applications, including heart pacing, defibrillation, and stimulation of neurosecretion and other functions[13, 17–21]. However, the mechanisms of cell excitation and Ca2+ mobilization by nsEP remain uncertain.
With conventional electrostimulation using “long” (micro- and millisecond) pulses, the externally applied electric field moves ions in extra- and intracellular electrolytes, whereas the cell membrane acts as a barrier. The resulting build-up of the electric potential across the membrane amplifies the externally applied electric field (the process called Maxwell-Wagner ionic polarization), with the amplification factor for mammalian cells being on the order of thousands [22–24]. This amplification enables the excitation and electroporation by external electric fields many orders of magnitude weaker than the natural electric field across the cell membrane. External fields impose the highest transmembrane potential (TMP) at cell poles facing stimulating electrodes, and membrane depolarization at the cathode-facing pole leads to the opening of voltage-gated channels and excitation. In contrast, electroporative TMP levels can be reached faster at the anode-facing pole where the resting membrane potential adds to the external electric field. The polar pattern of membrane permeabilization by individual millisecond pulses (msEP) and shorter pulses (down to at least 600 ns) has been routinely detected by the polar entry of marker dyes and ions (propidium, ethidium, YO-PRO-1, and Ca2+) [25–28]. The entry could be higher from either anodic or cathodic pole, depending on the marker and other factors, including the different pore size at the two poles[27]. Polar dye entry was also reported after high-rate trains of multiple pulses as short as 4 ns[29].
Stimuli shorter than 100–200 ns are too brief to cause ionic polarization, but can induce TMP needed for electroporation by a dielectric polarization mechanism [22, 24, 25, 30–32]. However, the amplification factor is smaller and the stimulus strength needs to be increased accordingly. Moreover, such stimuli appear too brief to shift the voltage sensor of voltage-gated channels across the plasma membrane and cause a series of conformation changes leading to the channel opening (which takes 10–100 μs [33]). Still, isolated reports suggested that nsEP can excite nerve and muscle cells just like conventional micro- and millisecond electric shocks [17, 34, 35], but the mechanism underlying the excitation by nsEP was not explained or explored. Other studies [17] suggested that excitation may in part be mediated by electroporation (which leads to the loss of the resting potential, depolarization, and channel opening).
Since “short” nsEP increase TMP without movement and redistribution of mobile charges, their effect should be less restricted to electrode-facing poles of the cell. Pore enlargement presumably occurs during the imposed pulse [36], and shorter pulses can reasonably be expected to produce smaller pores. Indeed, modeling of nsEP interaction with cells predicted diffuse electroporation pattern throughout the plasma membrane and intracellular membranes, termed “supra-electroporation”, and the calculated diameter of pores was smaller than in the conventional electroporation[30, 37, 38]. Experimental studies confirmed poration of intracellular organelles by nsEP [9, 13, 20, 39, 40] and smaller pore size [14, 36, 41]. However the diffuse, non-polar pattern of pore formation has not been demonstrated by direct experiments, which made it one of the goals of the present work.
We focused on studying the excitation and electroporation in isolated cardiomyocytes, considering both the shortage of data about nsEP effects in excitable cells, and the potential benefit of nsEP technology for cardiac defibrillation. Since at least some adverse effects of defibrillation shocks are attributed to electroporation [42–46], the formation of only smaller pores by switching from msEP to nsEP may reduce damage and cell loss. The undesired transport of solutes through electropores is further reduced by essentially eliminating the electrophoretic component[37]. The excitation which relies on the dielectric polarization should lead to deeper penetration and more uniform activation of tissue [9, 22, 24, 25, 30, 32], both being crucial advantages for defibrillation. While these benefits come at the expense of the reduced amplification factor, which for nsEP is from tens to hundreds [22, 24, 31], higher intensity of shocks will not necessarily translate into higher energy, as the energy losses to move free charges towards the cell membrane are eliminated.
To our knowledge, nsEP effects on cardiomyocytes were analyzed in just a single peer-reviewed study, which reported both Ca2+ transients and Ca2+ waves induced by 4-ns stimuli[17]. The authors concluded that at least for certain nsEP parameters, these Ca2+ responses are probably mediated by nanoporation of sarcolemma. They employed multi-pulse stimulation protocols which complicated the interpretation of results (repetitive nsEP at 2 Hz; or three 1-ms, 2.4 kV/cm stimuli followed by either a single nsEP or a 10-kHz nsEP train), especially considering that 2.4 kV/cm is well above the electroporation threshold for 1-ms pulses[47–49] and that intense instant heating was likely (up to 20 °C per one msEP, based on the dose and adiabatic heat calculation[50, 51]). In this work, we compared the stimulation and electroporation effects of individual 10 ns and 4 ms stimuli for different conditions and in a wide range of pulse intensities.
Materials and Methods
Cell Culture
Embryonic rat cardiac myocytes, the culture medium, and its supplements were purchased from Lonza (Walkersville, MD) and handled according to supplier recommendations. Cells were seeded on “0” thickness glass coverslips coated with nitrocellulose and incubated at 37 °C with 5% CO2 in air, in RCGM medium supplemented with 7.5% horse serum, 7.5% fetal bovine serum, 0.1% of pre-mixed gentamicin/amphotericin-B solution, and 200 μM of 5-bromo-2′-deoxyuridine. To prepare coverslip coating solution, a nitrocellulose filter paper (Invitrogen, Eugene, OR) was dissolved in methanol (0.1 cm2/10 ml). Every 3 days, 50% of the growth medium was replaced by fresh one. Cells on coverslips did not propagate and were used up to three weeks after thawing.
Reagents and Solutions
Fura-2 pentapotassium salt, Fura-2/AM, and Pluronic F-127 (20% solution in DMSO) were purchased from Life Technologies (Grand Island, NY). Verapamil and cyclopiazonic acid (CPA) were obtained from Tocris Bioscience (Minneapolis, MN). Other chemicals were from Sigma-Aldrich (St. Louis, MO). During experiments, cells were continually perfused at 0.5 ml/min (or 10 ml/min for faster drug delivery) with a physiological solution containing (in mM): 140 NaCl, 5.4 KCl, 1.5 MgCl2, 2 CaCl2, 10 glucose, and 10 HEPES (pH 7.3, 300–310 mOsm/kg). For Ca2+-free conditions, CaCl2 was replaced with 2 mM Na-EGTA.
Measurement of cytosolic Ca2+ concentration
The detailed procedures employed for loading cells with Fura-2 and dye calibration were reported earlier[13, 20]. In brief, cells were loaded with the dye for 30 min at room temperature, in the dark, in the physiological solution supplemented with 5 μM Fura-2/AM and 0.02% of Pluronic F-127. After loading, the coverslip was placed in a glass-bottomed perfusion chamber mounted on an IX71 microscope (Olympus America, Center Valley, PA) and washed with the physiological solution for 15 min to allow for deesterification of the dye. Fura-2 fluorescence was measured using an ET FURA2 filter set (Chroma Technology, Bellows Falls, VT) and a UApoN340 40×/1.35 objective (Olympus). A fast wavelength switcher Lambda DG4 (Sutter Instruments, Novato, CA) was employed to excite the dye alternatively at 340 and 380 nm and fluorescence was recorded at 510 nm. Images were acquired in a streaming mode (20 ms exposure, 25 image pairs/s) using Metafluor v.7.5 software (Molecular Devices, Sunnyvale, CA) and iXon Ultra 897 EM CCD camera (Andor Technology, Belfast, UK).
Measurement of Propidium (Pr) uptake
The perfusion chamber was filled with the physiological solution containing 3 μg/ml of Pr iodide and perfusion was turned off. Pr becomes highly fluorescent upon entering the cell and binding to nucleic acids, but cannot enter the cell through the intact plasma membrane. Therefore, the gain in Pr emission is commonly used to quantify the disruption of the plasma membrane barrier function by electroporation[14, 27, 52–55]. Emission of Pr was recorded using a TRITC filter cube (Olympus) and the iXon Ultra 897 camera (100 ms exposure, 0.9 images/s). The recording began 1 min prior to electroporation and continued for 9 min after it; the gain in fluorescence by the end of recording was used as a measure of Pr uptake.
Exposure to nsEP and msEP
The technique of electric field delivery to individual cells was the same as reported previously [4, 13–15, 20, 55]. Trapezoidal pulses of up to 20 kV amplitude and approximately 10 ns duration (at 50% height) were produced by a model FPG 20–1NM pulse generator (FID GmbH, Burbach, Germany). Rectangular 4-ms pulses were produced by a Grass S88 Stimulator (Grass Instrument, Quincy, MA). Typical pulse shapes of nsEP and msEP are presented in the inset of Fig. 1.
Fig. 1.
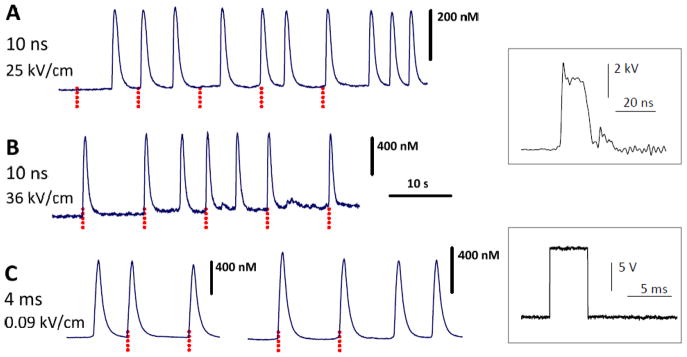
Spontaneous, nsEP-induced, and msEP-induced Ca2+ transients in rat embryonic cardiomyocytes. A–C: different individual cells subjected to subthreshold (A) and suprathreshold stimuli (B, C). Stimulation parameters are given in the legends. Vertical dotted lines show when the stimuli were applied. Insets show typical shapes of nsEP and msEP.
Pulses were delivered to selected cells on a coverslip with a pair of tungsten rod electrodes (0.1 mm diameter). The pulse shapes and amplitudes were monitored with a TDS 3052 oscilloscope (Tektronix, Beaverton, OR). Electrodes were positioned precisely at 50 μm above the coverslip surface using an MPC-200 robotic manipulator (Sutter, Novato, CA). To deliver nsEP at the lowest tested electric field of 25 kV/cm, the electrodes were raised to 70 μm. Cells selected for exposure were in the middle of the 0.24-mm gap between the tips of the electrodes. Pulses were triggered externally and synchronized with image acquisition and bath buffer exchanges by a TTL pulse protocol using Digidata 1440A board and Clampex v. 10.2 software (Molecular Devices, Sunnyvale, CA). The electric field at the location of the cells was determined by a 3D simulation with a finite-element Maxwell equation solver Amaze 3D (Field Precision, Albuquerque, NM) as described earlier[15].
Data Analysis
Numerical data were analyzed using Origin 8.0 software package (Origin Lab, Northampton, MA) and plotted using Grapher V. 11.4 (Golden Software, Golden, CO). Data are presented as mean ± s.e. Statistical analyses were performed using a two-tailed t-test where p < 0.05 was considered statistically significant.
Results and Discussion
Stimulation by 10 ns and 4-ms pulses
Ca2+ activity in the embryonic cardiomyocytes varied from one cell to another, and it also changed with the age of the culture. In the early culture, most cells spontaneously fired arrhythmic Ca2+ transients. The peak amplitude of the spontaneous transients ranged between 0.5–2 μM in different cells, but in each individual cell it was fairly stable. Applying 10-ns pulses at 25 kV/cm (Fig. 1A) or 4-ms pulses at 0.05 kV/cm did not elicit transients or any detectable changes in the cytosolic Ca2+, and had no apparent effect on the spontaneous activity. The minimum effective electric field (36 kV/cm for nsEP and 0.08 kV/cm for msEP) elicited full-amplitude Ca2+ transients (Fig. 1B, C). Despite the much greater electric field needed for stimulation with nsEP, the delivered dose was lower (190 mJ/g at 10 ns versus 460 mJ/g at 4 ms). We did not search for exact stimulation thresholds and instead refer here to the above numbers as to “near-threshold” values.
Intense stimuli trigger prolonged Ca2+ increase and spontaneous firing
Increasing the stimulus amplitude to about twice the near-threshold value caused a prolonged elevation of the cytosolic Ca2+ along with a high-rate spontaneous firing in previously quiescent cells (Fig. 2). This response was seen with either nsEP or msEP and was likely a result of lasting permeabilization of the sarcolemma by electroporation, which is supported by the data discussed in the next sections. The recovery of cytosolic Ca2+ to the basal level could take minutes, followed by restoration of quiescent state and generation of “regular” all-or-none Ca2+ transients in response to stimuli of the near-threshold intensity (Fig. 2A). In other cells, spontaneous Ca2+ oscillations persisted even after the restoration of the basal Ca2+ level; moreover, the oscillations recovered after incubtion with 10 μM nifedipine or extracellular Ca2+ removal (Fig. 2B,C). Thus, the lasting Ca2+ oscillations relied on the spontaneous opening of L-type Ca2+ channels, and the “active” condition of the cell was preserved regardless of whether it was actually firing or not. A detailed analysis of mechanisms involved would require a separate study; here we would only like to note the qualitative similarity of nsEP and msEP effects as the intensity of the stimuli was increased beyond the near-threshold levels.
Fig. 2.
Intense msEP and nsEP cause sustained elevation of cytosolic Ca2+ and trigger asynchronous firing in previously quiescent cells. Stimulation parameters are given in the legends; vertical dotted lines show when the stimuli were applied. Horizontal dashed lines show the basal level of Ca2+ (about 100 nM). In three different cells, msEP (A) and nsEP (B, C) caused a lasting but reversible Ca2+elevation. A: A recovered cell generates regular Ca2+ transients in response to non-electroporative stimuli. B and C: Asynchronous Ca2+ oscillations depend on the entry of extracellular Ca2+ through L-type Ca2+ channels. They are reversibly blocked by nifedipine or perfusion by a Ca2+-free solution (horizontal bars).
Dose efficiency of nsEP and msEP for electroporation of the sarcolemma
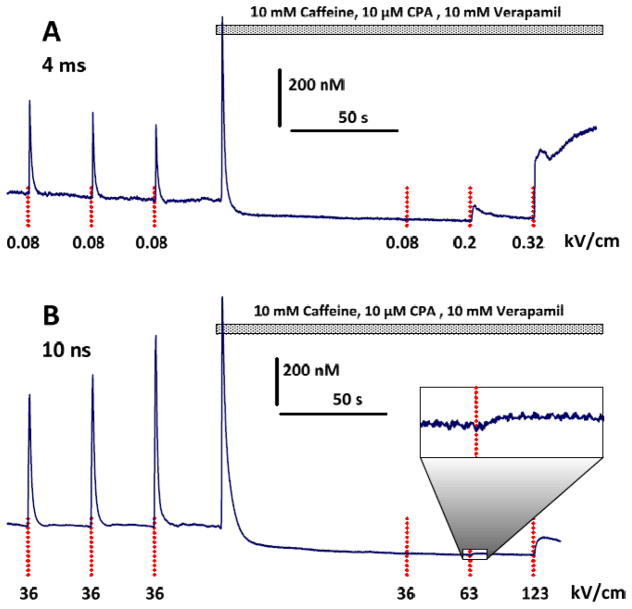
In order to quantitate the electroporative Ca2+ entry, we used a cocktail of 10 μM verapamil (to block L-type Ca2+ channels of the sarcolemma), 10 mM caffeine (to deplete Ca2+ from the sarcoplasmic reticulum by stimulating ryanodine receptors), and 10 μM of CPA (to block re-uptake of Ca2+ to the reticulum). This cocktail triggered a brief Ca2+ elevation followed by a drop and stabilization below the basal level (Fig. 3). Concurrently, the cocktail fully blocked Ca2+ transients in response to nsEP or msEP of the near-threshold electric field. However, an increase of the stimulus strength evoked Ca2+ responses of a different type: (1) their amplitude increased gradually as the stimulus strength was increased, (2) Ca2+ concentration could continue to increase for tens of seconds with or without recovery, and (3) when present, Ca2+ recovery to the basal level was slow (Figs. 3 and 4A). This response was abolished in a Ca2+-free medium (data not shown) and was concluded to be a result of electroporation of the plasma membrane.
Fig. 3.
A cocktail of caffeine, CPA, and verapamil fully blocks Ca2+ transients in response to previously effective stimuli and enables the observation of electroporative Ca2+ entry after more intense stimuli. A and B: representative experiments with msEP and nsEP, respectively. The perfusion with the cocktail (horizontal bar) transiently increases the cytosolic Ca2+, followed by its drop below the basal level. An inset zoom (B) shows a small Ca2+ response with 10x magnification. See Fig. 2 for other details.
Fig. 4.
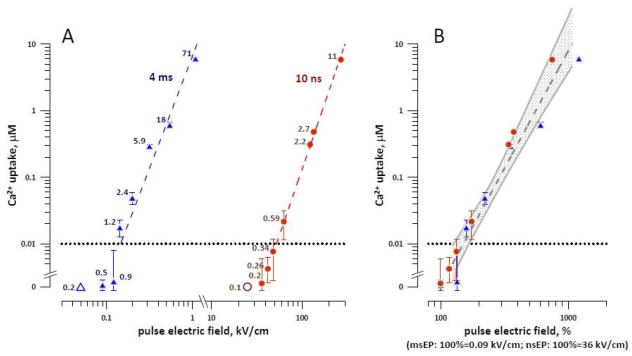
The amplitude of electroporative Ca2+ entry as a function of stimulus intensity for msEP and nsEP. A: 10-ns pulses require much higher electric field to cause electroporation than 4-ms pulses. Measurements were performed in cells blocked with 10 mM caffeine, 10 μM CPA, and 10 mM verapamil. The horizontal dotted line at 0.01 μM delimits the lowest detectable Ca2+ increase, so the datapoints falling below this line are considered subthreshold for electroporation. Mean values +/− s.e. for 5–8 experiments; the error bars may be not visible when they are smaller than the central symbol. Ca2+ entry for datapoints above the dotted line was statistically significant at p<0.05 or better. The labels next to the datapoints are the respective dose values, in J/g. The dashed lines are the best power function fits of data above 0.01 μM. Two open symbols at 0 Ca2+ uptake are the values subthreshold for stimulation (in cells not blocked with the drugs). B: same data expressed in % to the minimum electric field known to be effective for stimulation of unblocked cells, namely 0.09 and 36 kV/cm for msEP and nsEP, respectively. The dashed area is the common power function fit and the shaded corridor sets the limits of a 95% confidence interval. See text for more details.
The smallest Ca2+ increase that could be reliably resolved in our experiments was about 10 nM (a horizontal dotted line in Fig. 4). Thus the electroporation thresholds were 0.14 and 63 kV/cm for msEP and nsEP, respectively (Fig. 4A). Despite this 500-fold difference, the threshold electroporation dose was 2-fold smaller for nsEP (0.6 J/g) than for msEP (1.2 J/g).
Above the threshold, the amplitude of Ca2+ rise increased as a power function of the stimulus intensity. In order to compare the stimulation and electroporation thresholds, we (a) normalized the electroporating voltages to the near-threshold stimulation electric field values (0.09 kV/cm for msEP and 36 kV/cm for nsEP), and (b) normalized the electroporating voltages to the highest known subthreshold electric field (0.05 kV/cm for msEP and 25 kV/cm for nsEP). These steps have yielded, respectively, the lower and the higher boundaries of electroporation thresholds estimated relative to the stimulation thresholds.
When the msEP and nsEP intensities were normalized as in step (a) above, the Ca2+ uptake values overlapped and could be approximated with a common power fit, with a high coefficient of determination (R2=0.95, Fig. 4B). The intercept of this best fit line with the 10-nM detection limit at 150% (Fig. 4B) can be regarded as a lower bounder of the electroporation threshold for both msEP and nsEP. For normalization as in step (b), the normalized Ca2+ uptake values also overlapped and could be approximated with a common power fit (R2=0.91; data not shown). From this fit, the upper boundary of the electroporation threshold was estimated at 230%.
Thus, for both msEP and nsEP, electroporation occurred at intensities of only 150–230% of the stimulation threshold (or at doses between 200% and 500%), which was a striking similarity for stimuli differing in duration by almost 6 orders of magnitude.
Different size of pores opened by nsEP and msEP
If the safety factor of electrostimulation is defined simply as a ratio of electroporating and stimulating voltages (or doses), our data would suggest no impact from changing the pulse duration. At the same time, previous studies as well as in silico models found that shorter electric pulses produce fewer large-diameter pores [12, 14, 30, 36] and should be less damaging. Measuring the electroporative entry of a small cation such as Ca2+ does not necessarily reveal the difference in pore size, hence it was probed with a larger Pr cation [15, 54].
From plots in Fig. 4A, we identified the electric field intensities of msEP and nsEP which caused practically the same Ca2+ response: 0.14 and 63 kV/cm; 0.55 and 135 kV/cm; and 1.1 and 270 kV/cm. In separate experiments, we measured Pr uptake and plotted it against the Ca2+ uptake at the respective stimulus strength. Fig. 5 shows that for nsEP and msEP treatments which caused the same Ca2+ rise, the msEP treatment caused at least a 10-fold greater Pr uptake. This result indicates that msEP indeed opened more of the larger, Pr-permeable pores. Perhaps the fraction of Pr-permeable pores was small when compared to the entire pore population, and therefore had little impact on Ca2+ uptake which entered the cell through a much larger population of pores. This conclusion is similar to the one made earlier when comparing Pr and water uptake caused by 60- and 600-ns electric pulses[14]. Notwithstanding the relatively small number of larger-size pores, the physiological consequences of their formation can be significant. For example, the presence of even a small population of larger-size pores was implicated as a major reason why cell survival in cells exposed to high-intensity 300-ns, 2-μs, or 9-μs electric pulses was much lower than after 10-ns pulse treatments at the same dose[1]. Thus, despite the similarity of electroporation thresholds with respect to the stimulation thresholds, nsEP will likely cause less damage to cells by not opening larger electropores in the plasma membrane.
Fig. 5.
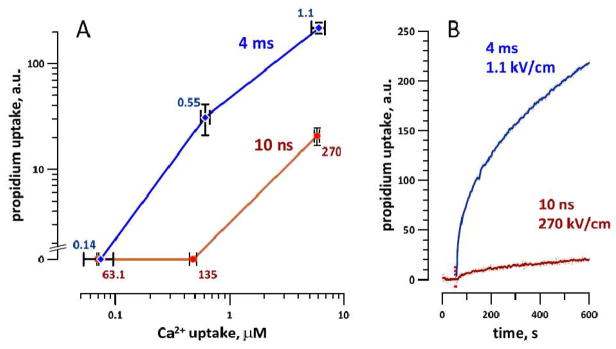
Propidium uptake triggered by nsEP and msEP at intensities equipotent for electroporative Ca2+ uptake. A: propidium uptake was studied at 3 different msEP and nsEP intensities, which were chosen to cause the same Ca2+ entry by electroporation (see text and Fig. 4). The uptake of propidium (as measured 9 min after the stimulus) from nsEP was reduced significantly (p<0.01) while Ca2+ uptake was the same. Mean values +/− s.e for 5–8 experiments. Labels indicate the electric field applied, kV/cm. B: sample traces of propidium uptake caused by nsEP and msEP at the indicated E-field. Vertical dotted line marks the application of the pulse.
Supra-electroporation of sarcolemma by nsEP
As discussed above, with long electric pulses and capacitive charging of the cell membrane, the critical TMP builds up primarily at cell poles facing the electrodes. With nsEP being too brief to move ions to charge the membrane, and relying on the dielectric polarization instead, the electroporation by nsEP should be less restricted to cell poles. Simulation models predicted a widespread, diffuse pattern of supra-electroporation[30, 38], which however has not been demonstrated by direct measurements.
To compare the localization of electroporation by msEP and nsEP, we chose larger cells (50–100 μm in diameter) which would allow for better spatial resolution of Ca2+ gradients by fluorescent imaging. The non-electroporative mechanisms of Ca2+ response to electric stimuli were blocked with the drug cocktail described above. Electroporated areas of the cell membrane were recognized by the route of Ca2+ entry as monitored by a time-lapse imaging. While we did not block non-selective cation channels, they are not voltage-gated and were not expected to be activated directly by msEP or nsEP.
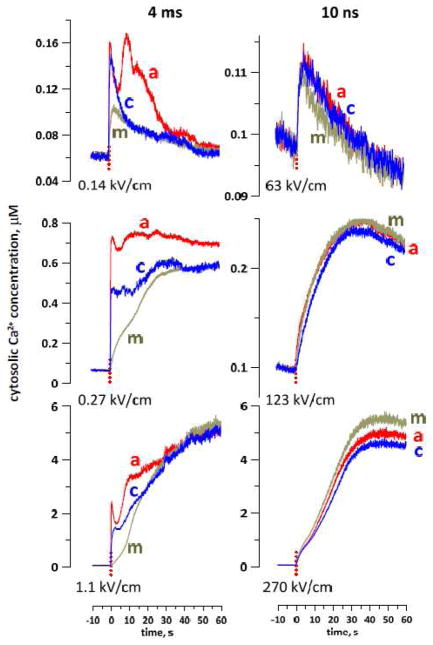
The experiments revealed a striking difference in the spatial patterns of nsEP and msEP effects (Figs. 6 and 7). With 4-ms pulses, Ca2+ entered from the poles (more from the anodic pole) and diffused to the center of the cell for seconds after the pulse. In Fig 7, this pattern of entry is manifested by the reduced and delayed Ca2+ increase in the center of the cell compared to the electrode-facing poles. The early Ca2+ entry at the anodic pole could be assisted by electrophoresis during the pulse, which explains a brief dip in the course of Ca2+ increase. In contrast to msEP, 10-ns pulses caused a gradual, slow increase of Ca2+ in the entire volume of the cell, without any specific localization and showing only modest differences between the center and the poles. This distinction between msEP and nsEP was consistently observed in all treated cells and within a wide range of amplitudes of the stimuli (Fig. 7). To our knowledge, this is the first experimental observation of non-localized “supra-electroporation” pattern after nsEP treatment.
Fig. 6.
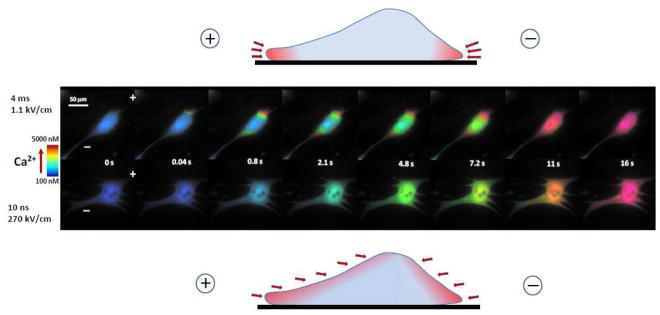
The difference between conventional electroporation (top) and supra-electroporation (bottom) is visualized by different patterns of Ca2+ entry. Cardiomyocytes were incubated with the same inhibitors as in Fig. 4. Cells were permeabilized to Ca2+ by a single 4-ms pulse (top) or a 10-ns pulse (bottom). Shown are representative images at indicated time points after the electric shock. Ca2+ concentration is coded by intensity-modulated pseudocolor. The positions of anode and cathode stimulating electrodes are designated in the first panel by “+” and “−”. Note Ca2+entry from the cell poles after 4-ms pulse, and entry without apparent localization after the 10-ns pulse. See text for more details. Drawings above and below the cell images show a vertical cross-section of a cell in the plane between two electrodes; arrows point to sites of Ca2+ entry after msEP and nsEP, respectively.
Fig. 7.
Different patterns of cytosolic Ca2+ increase after electroporation by msEP (left panels) and nsEP (right panels). Each panel shows data for one representative cell stimulated by a single pulse (dotted vertical line, at 0 s) at the indicated electric field. In each cell, Ca2+ level was monitored in three regions selected at the anode-facing pole of the cell (a), at the cathode-facing pole (c), or in the middle of the cell (m). With 4-ms pulses, Ca2+ entry starts from the poles followed by slow diffusion to the center. With 10-ns pulses, Ca2+ increased synchronously in all measured regions.
Conclusions
At near-threshold intensities, both nsEP and msEP triggered Ca2+ transients in rat embryonic cardiomyocytes, apparently by activating voltage-gated channels without electroporation. The electroporation threshold for both stimuli was at just 150–230% of the stimulation threshold (200–500% when comparing the dose). Such similarity was unexpected from stimuli which differ by almost six orders of magnitude in duration. At the same time, we experimentally established two distinguishing features of electroporation by nsEP, namely the reduced formation of larger-size pores and non-polar, diffuse distribution of electropores over the cell body. These distinguishing features may be beneficial for medical applications such as defibrillation (by reducing the harmful side effects from electroporation and by enabling more uniform tissue penetration) and warrant more focused studies at tissue and organ levels.
Highlights.
Ca2+ transients evoked by 10-ns and 4-ms stimuli are similar to spontaneous ones
Electroporation occurs at 150–230% of the stimulation threshold for both stimuli
Electroporation by 10-ns pulses opens fewer larger pores than by 4-ms pulses
Electroporation by 10-ns pulses is not restricted to cell poles
Acknowledgments
This work was supported by R01GM088303 from the National Institute of General Medical Sciences (to AGP) and by ODU Office of Research Multidisciplinary Seed Funding (to CZ).
Abbreviations
- CPA
cyclopiazonic acid
- msEP
millisecond electric pulses
- nsEP
nanosecond electric pulses
- Pr
propidium
- TMP
transmembrane potential
Footnotes
Publisher's Disclaimer: This is a PDF file of an unedited manuscript that has been accepted for publication. As a service to our customers we are providing this early version of the manuscript. The manuscript will undergo copyediting, typesetting, and review of the resulting proof before it is published in its final citable form. Please note that during the production process errors may be discovered which could affect the content, and all legal disclaimers that apply to the journal pertain.
References
- 1.Ibey BL, Pakhomov AG, Gregory BW, Khorokhorina VA, Roth CC, Rassokhin MA, Bernhard JA, Wilmink GJ, Pakhomova ON. Selective cytotoxicity of intense nanosecond-duration electric pulses in mammalian cells. Biochim Biophys Acta. 2010;1800:1210–1219. doi: 10.1016/j.bbagen.2010.07.008. [DOI] [PMC free article] [PubMed] [Google Scholar]
- 2.Pakhomova ON, Gregory B, Semenov I, Pakhomov AG. Calcium-mediated pore expansion and cell death following nanoelectroporation. Biochim Biophys Acta. 2014;1838:2547–2554. doi: 10.1016/j.bbamem.2014.06.015. [DOI] [PMC free article] [PubMed] [Google Scholar]
- 3.Morotomi-Yano K, Akiyama H, Yano K. Nanosecond pulsed electric fields activate MAPK pathways in human cells. Archives of Biochemistry and Biophysics. 2011;515:99–106. doi: 10.1016/j.abb.2011.09.002. [DOI] [PubMed] [Google Scholar]
- 4.Pakhomov AG, Semenov I, Xiao S, Pakhomova ON, Gregory B, Schoenbach KH, Ullery JC, Beier HT, Rajulapati SR, Ibey BL. Cancellation of cellular responses to nanoelectroporation by reversing the stimulus polarity. Cell Mol Life Sci. 2014;71:4431–4441. doi: 10.1007/s00018-014-1626-z. [DOI] [PMC free article] [PubMed] [Google Scholar]
- 5.Pakhomova ON, Gregory BW, Semenov I, Pakhomov AG. Two modes of cell death caused by exposure to nanosecond pulsed electric field. PLoS One. 2013;8:e70278. doi: 10.1371/journal.pone.0070278. [DOI] [PMC free article] [PubMed] [Google Scholar]
- 6.Ren W, Beebe SJ. An apoptosis targeted stimulus with nanosecond pulsed electric fields (nsPEFs) in E4 squamous cell carcinoma. Apoptosis. 2011;16:382–393. doi: 10.1007/s10495-010-0572-y. [DOI] [PMC free article] [PubMed] [Google Scholar]
- 7.Nuccitelli R, Chen X, Pakhomov AG, Baldwin WH, Sheikh S, Pomicter JL, Ren W, Osgood C, Swanson RJ, Kolb JF, Beebe SJ, Schoenbach KH. A new pulsed electric field therapy for melanoma disrupts the tumor’s blood supply and causes complete remission without recurrence. Int J Cancer. 2009;125:438–445. doi: 10.1002/ijc.24345. [DOI] [PMC free article] [PubMed] [Google Scholar]
- 8.Chen X, Zhuang J, Kolb JF, Schoenbach KH, Beebe SJ. Long term survival of mice with hepatocellular carcinoma after pulse power ablation with nanosecond pulsed electric fields. Technology in cancer research & treatment. 2012;11:83–93. doi: 10.7785/tcrt.2012.500237. [DOI] [PubMed] [Google Scholar]
- 9.Schoenbach KS, Hargrave B, Joshi RP, Kolb J, Osgood C, Nuccitelli R, Pakhomov AG, Swanson J, Stacey M, White JA, Xiao S, Zhang J, Beebe SJ, Blackmore PF, Buescher ES. Bioelectric Effects of Nanosecond Pulses. IEEE Transactions on Dielectrics and Electrical Insulation. 2007;14:1088–1109. [Google Scholar]
- 10.Nuccitelli R, Huynh J, Lui K, Wood R, Kreis M, Athos B, Nuccitelli P. Nanoelectroablation of human pancreatic carcinoma in a murine xenograft model without recurrence. Int J Cancer. 2013;132:1933–1939. doi: 10.1002/ijc.27860. [DOI] [PMC free article] [PubMed] [Google Scholar]
- 11.Breton M, Mir LM. Microsecond and nanosecond electric pulses in cancer treatments. Bioelectromagnetics. 2012;33:106–123. doi: 10.1002/bem.20692. [DOI] [PubMed] [Google Scholar]
- 12.Pakhomov AG, Pakhomova ON. Nanopores: A distinct transmembrane passageway in electroporated cells. In: Pakhomov AG, Miklavcic D, Markov MS, editors. Advanced Electroporation Techniques in Biology in Medicine. CRC Press; Boca Raton: 2010. pp. 178–194. [Google Scholar]
- 13.Semenov I, Xiao S, Pakhomova ON, Pakhomov AG. Recruitment of the intracellular Ca by ultrashort electric stimuli: The impact of pulse duration. Cell Calcium. 2013;54:145–150. doi: 10.1016/j.ceca.2013.05.008. [DOI] [PMC free article] [PubMed] [Google Scholar]
- 14.Nesin OM, Pakhomova ON, Xiao S, Pakhomov AG. Manipulation of cell volume and membrane pore comparison following single cell permeabilization with 60- and 600-ns electric pulses. Biochim Biophys Acta. 2011;1808:792–801. doi: 10.1016/j.bbamem.2010.12.012. [DOI] [PMC free article] [PubMed] [Google Scholar]
- 15.Pakhomov AG, Gianulis E, Vernier PT, Semenov I, Xiao S, Pakhomova ON. Multiple nanosecond electric pulses increase the number but not the size of long-lived nanopores in the cell membrane. Biochim Biophys Acta. 2015;1848:958–966. doi: 10.1016/j.bbamem.2014.12.026. [DOI] [PMC free article] [PubMed] [Google Scholar]
- 16.Pakhomov AG, Xiao S, Pakhomova ON, Semenov I, Kuipers MA, Ibey BL. Disassembly of actin structures by nanosecond pulsed electric field is a downstream effect of cell swelling. Bioelectrochemistry. 2014;100:88–95. doi: 10.1016/j.bioelechem.2014.01.004. [DOI] [PMC free article] [PubMed] [Google Scholar]
- 17.Wang S, Chen J, Chen MT, Vernier PT, Gundersen MA, Valderrabano M. Cardiac myocyte excitation by ultrashort high-field pulses. Biophysical journal. 2009;96:1640–1648. doi: 10.1016/j.bpj.2008.11.011. [DOI] [PMC free article] [PubMed] [Google Scholar]
- 18.Craviso GL, Choe S, Chatterjee I, Vernier PT. Modulation of intracellular Ca(2+) levels in chromaffin cells by nanoelectropulses. Bioelectrochemistry. 2012;87:244–252. doi: 10.1016/j.bioelechem.2011.11.016. [DOI] [PubMed] [Google Scholar]
- 19.Craviso GL, Choe S, Chatterjee P, Chatterjee I, Vernier PT. Nanosecond electric pulses: a novel stimulus for triggering Ca2+ influx into chromaffin cells via voltage-gated Ca2+ channels. Cell Mol Neurobiol. 2010;30:1259–1265. doi: 10.1007/s10571-010-9573-1. [DOI] [PMC free article] [PubMed] [Google Scholar]
- 20.Semenov I, Xiao S, Pakhomov AG. Primary pathways of intracellular Ca(2+) mobilization by nanosecond pulsed electric field. Biochim Biophys Acta. 2013;1828:981–989. doi: 10.1016/j.bbamem.2012.11.032. [DOI] [PMC free article] [PubMed] [Google Scholar]
- 21.Tolstykh GP, Beier HT, Roth CC, Thompson GL, Payne JA, Kuipers MA, Ibey BL. Activation of intracellular phosphoinositide signaling after a single 600 nanosecond electric pulse. Bioelectrochemistry. 2013;94:23–29. doi: 10.1016/j.bioelechem.2013.05.002. [DOI] [PubMed] [Google Scholar]
- 22.Kotnik T, Miklavcic D. Second-order model of membrane electric field induced by alternating external electric fields. Ieee T Bio-Med Eng. 2000;47:1074–1081. doi: 10.1109/10.855935. [DOI] [PubMed] [Google Scholar]
- 23.Saviz M, Faraji-Dana R. Simplified estimation of membrane potentials induced by high-frequency electric signals. Journal of Electrical Bioimpedance. 2014;5:9–13. [Google Scholar]
- 24.Son RS, Smith KC, Gowrishankar TR, Vernier PT, Weaver JC. Basic Features of a Cell Electroporation Model: Illustrative Behavior for Two Very Different Pulses. J Membr Biol. 2014 doi: 10.1007/s00232-014-9699-z. [DOI] [PMC free article] [PubMed] [Google Scholar]
- 25.Pakhomov AG, Miklavcic D, Markov MS. Advanced Electroporation Techniques in Biology in Medicine. CRC Press; Boca Raton: 2010. p. 528. [Google Scholar]
- 26.Beier HT, Roth CC, Tolstykh GP, Ibey BL. Resolving the spatial kinetics of electric pulse-induced ion release. Biochem Biophys Res Commun. 2012;423:863–866. doi: 10.1016/j.bbrc.2012.06.055. [DOI] [PubMed] [Google Scholar]
- 27.Tekle E, Astumian RD, Chock PB. Selective and asymmetric molecular transport across electroporated cell membranes. Proc Natl Acad Sci U S A. 1994;91:11512–11516. doi: 10.1073/pnas.91.24.11512. [DOI] [PMC free article] [PubMed] [Google Scholar]
- 28.Kotnik T, Pucihar G, Miklavcic D. Induced Transmembrane Voltage and Its Correlation with Electroporation-Mediated Molecular Transport. J Membr Biol. 2010 doi: 10.1007/s00232-010-9279-9. [DOI] [PubMed] [Google Scholar]
- 29.Vernier PT, Sun Y, Gundersen MA. Nanoelectropulse-driven membrane perturbation and small molecule permeabilization. BMC Cell Biol. 2006;7:37. doi: 10.1186/1471-2121-7-37. [DOI] [PMC free article] [PubMed] [Google Scholar]
- 30.Gowrishankar TR, Weaver JC. Electrical behavior and pore accumulation in a multicellular model for conventional and supra-electroporation. Biochem Biophys Res Commun. 2006;349:643–653. doi: 10.1016/j.bbrc.2006.08.097. [DOI] [PMC free article] [PubMed] [Google Scholar]
- 31.Vernier PT. Nanoscale Restructuring of Lipid Bilayers in Nanosecond Electric Fields. In: Pakhomov AG, Miklavcic D, Markov M, editors. Advanced Elecroporation techniques in Medicine and Biology. CRC Press; Boca Raton, FL: 2010. pp. 161–176. [Google Scholar]
- 32.Gowrishankar TR, Weaver JC. An approach to electrical modeling of single and multiple cells. P Natl Acad Sci USA. 2003;100:3203–3208. doi: 10.1073/pnas.0636434100. [DOI] [PMC free article] [PubMed] [Google Scholar]
- 33.Hille B. Ionic Channels of Excitable Membranes. 3. Sinauer Associates; Sunderland, MA: 2001. [Google Scholar]
- 34.Jiang N, Cooper BY. Frequency-dependent interaction of ultrashort E-fields with nociceptor membranes and proteins. Bioelectromagnetics. 2011;32:148–163. doi: 10.1002/bem.20620. [DOI] [PubMed] [Google Scholar]
- 35.Rogers WR, Merritt JH, Comeaux JA, Kuhnel CT, Moreland DF, Teltschik DG, Lucas JH, Murphy MR. Strength-duration curve for an electrically excitable tissue extended down to near 1 nanosecond. Ieee Transactions on Plasma Science. 2004;32:1587–1599. [Google Scholar]
- 36.Saulis G, Saule R. Size of the pores created by an electric pulse: Microsecond vs millisecond pulses. Bba-Biomembranes. 2012;1818:3032–3039. doi: 10.1016/j.bbamem.2012.06.018. [DOI] [PubMed] [Google Scholar]
- 37.Smith KC, Weaver JC. Transmembrane molecular transport during versus after extremely large, nanosecond electric pulses. Biochem Biophys Res Commun. 2011;412:8–12. doi: 10.1016/j.bbrc.2011.06.171. [DOI] [PMC free article] [PubMed] [Google Scholar]
- 38.Gowrishankar TR, Esser AT, Vasilkoski Z, Smith KC, Weaver JC. Microdosimetry for conventional and supra-electroporation in cells with organelles. Biochem Biophys Res Commun. 2006;341:1266–1276. doi: 10.1016/j.bbrc.2006.01.094. [DOI] [PubMed] [Google Scholar]
- 39.Schoenbach KH, Beebe SJ, Buescher ES. Intracellular effect of ultrashort electrical pulses. Bioelectromagnetics. 2001;22:440–448. doi: 10.1002/bem.71. [DOI] [PubMed] [Google Scholar]
- 40.Napotnik TB, Wu YH, Gundersen MA, Miklavcic D, Vernier PT. Nanosecond electric pulses cause mitochondrial membrane permeabilization in Jurkat cells. Bioelectromagnetics. 2012;33:257–264. doi: 10.1002/bem.20707. [DOI] [PubMed] [Google Scholar]
- 41.Pakhomov AG, Bowman AM, Ibey BL, Andre FM, Pakhomova ON, Schoenbach KH. Lipid nanopores can form a stable, ion channel-like conduction pathway in cell membrane. Biochem Biophys Res Commun. 2009;385:181–186. doi: 10.1016/j.bbrc.2009.05.035. [DOI] [PMC free article] [PubMed] [Google Scholar]
- 42.Dosdall DJ, Fast VG, Ideker RE. Mechanisms of Defibrillation. Annu Rev Biomed Eng. 2010;12:233–258. doi: 10.1146/annurev-bioeng-070909-105305. [DOI] [PMC free article] [PubMed] [Google Scholar]
- 43.Al-Khadra A, Nikolski V, Efimov IR. The role of electroporation in defibrillation. Circ Res. 2000;87:797–804. doi: 10.1161/01.res.87.9.797. [DOI] [PubMed] [Google Scholar]
- 44.Nikolski VP, Efimov IR. Electroporation of the heart, Europace: European pacing, arrhythmias, and cardiac electrophysiology: journal of the working groups on cardiac pacing, arrhythmias, and cardiac cellular electrophysiology of the. European Society of Cardiology. 2005;7(Suppl 2):146–154. doi: 10.1016/j.eupc.2005.04.011. [DOI] [PubMed] [Google Scholar]
- 45.Wang YT, Efimov IR, Cheng YN. Electroporation induced by internal defibrillation shock with and without recovery in intact rabbit hearts. Am J Physiol-Heart C. 2012;303:H439–H449. doi: 10.1152/ajpheart.01121.2011. [DOI] [PMC free article] [PubMed] [Google Scholar]
- 46.Tung L. Detrimental effects of electrical fields on cardiac muscle. P Ieee. 1996;84:366–378. [Google Scholar]
- 47.Ross JW, Whyte JJ, Zhao J, Samuel M, Wells KD, Prather RS. Optimization of square-wave electroporation for transfection of porcine fetal fibroblasts. Transgenic research. 2010;19:611–620. doi: 10.1007/s11248-009-9345-1. [DOI] [PMC free article] [PubMed] [Google Scholar]
- 48.Kotnik T, Pucihar G, Rebersek M, Miklavcic D, Mir LM. Role of pulse shape in cell membrane electropermeabilization. Biochim Biophys Acta. 2003;1614:193–200. doi: 10.1016/s0005-2736(03)00173-1. [DOI] [PubMed] [Google Scholar]
- 49.Krassowska W, Filev PD. Modeling electroporation in a single cell. Biophys J. 2007;92:404–417. doi: 10.1529/biophysj.106.094235. [DOI] [PMC free article] [PubMed] [Google Scholar]
- 50.Ibey BL, Xiao S, Schoenbach KH, Murphy MR, Pakhomov AG. Plasma membrane permeabilization by 60- and 600-ns electric pulses is determined by the absorbed dose. Bioelectromagnetics. 2009;30:92–99. doi: 10.1002/bem.20451. [DOI] [PMC free article] [PubMed] [Google Scholar]
- 51.Pakhomov AG. Practical Guide to High-Resolution Thermometry and Microdosimetry in Pulsed Electromagnetic Fields. In: Roach WP, editor. Radiofrequency Radiation Dosimetry Handbook. 5. Directed Energy Bioeffects Division, Radio Frequency Radiation Branch; 2009. pp. 69–100. www.dtic.mil/get-tr-doc/pdf?AD=ADA536009. [Google Scholar]
- 52.Pakhomova ON, Gregory BW, Pakhomov AG. Facilitation of electroporative drug uptake and cell killing by electrosensitization. Journal of cellular and molecular medicine. 2013;17:154–159. doi: 10.1111/j.1582-4934.2012.01658.x. [DOI] [PMC free article] [PubMed] [Google Scholar]
- 53.Wang YT, Efimov IR, Cheng Y. Electroporation induced by internal defibrillation shock with and without recovery in intact rabbit hearts. American journal of physiology Heart and circulatory physiology. 2012;303:H439–449. doi: 10.1152/ajpheart.01121.2011. [DOI] [PMC free article] [PubMed] [Google Scholar]
- 54.Bowman AM, Nesin OM, Pakhomova ON, Pakhomov AG. Analysis of plasma membrane integrity by fluorescent detection of Tl(+) uptake. J Membr Biol. 2010;236:15–26. doi: 10.1007/s00232-010-9269-y. [DOI] [PMC free article] [PubMed] [Google Scholar]
- 55.Gianulis EC, Pakhomov AG. Gadolinium modifies the cell membrane to inhibit permeabilization by nanosecond electric pulses. Arch Biochem Biophys. 2015;570:1–7. doi: 10.1016/j.abb.2015.02.013. [DOI] [PMC free article] [PubMed] [Google Scholar]


