

Abstract
Functional magnetic resonance imaging (fMRI) studies have revealed the existence of robust, interconnected brain networks exhibiting correlated low frequency fluctuations during rest, which can be derived by examining inherent spatio-temporal patterns in functional scans independent of any a priori model. In order to explore the electrophysiological underpinnings of these networks, analogous techniques have recently been applied to magnetoencephalography (MEG) data, revealing similar networks that exhibit correlated low frequency fluctuations in the power envelope of beta band (14–30Hz) power. However, studies to date using this technique have concentrated on healthy subjects, and no method has yet been presented for group comparisons. We extended the ICA resting state MEG method to enable group comparisons, and demonstrate the technique in a sample of subjects with major depressive disorder (MDD). We found that the intrinsic resting state networks evident in fMRI appeared to be disrupted in individuals with MDD compared to healthy participants, particularly in the subgenual cingulate, although the electrophysiological correlates of this are unknown. Networks extracted from a combined group of healthy and MDD participants were examined for differences between groups. Individuals with MDD showed reduced correlations between the subgenual anterior cingulate (sgACC) and hippocampus in a network with primary nodes in the precentral and middle frontal gyri. Individuals with MDD also showed increased correlations between insulo-temporal nodes and amygdala compared to healthy controls. To further support our methods and findings, we present test/re-test reliability on independent recordings acquired within the same session. Our results demonstrate that group analyses are possible with the resting state MEG-independent components analysis (ICA) technique, highlighting a new pathway for analysis and discovery. This study also provides the first evidence of altered sgACC connectivity with a motor network. This finding, reliable across multiple sessions, suggests that the sgACC may partially mediate the psychomotor symptoms of MDD via synchronized changes in beta-band power, and expands the idea of the sgACC as a hub region mediating cognitive and emotional symptomatic domains in MDD. Findings of increased connectivity between the amygdala and cortical nodes further supports the role of amygdalar networks in mediated depressive symptomatology.
Keywords: Magnetoencephalography (MEG), Depression, Network
1. Introduction
Within the field of neuroimaging, increased interest has recently been directed at studying functional connectivity during a resting state that is, in the absence of any imposed tasks or stimuli. The study of the resting state involves only subject-driven cognition, and may thus reflect fundamental neural processes as well as their dysfunction in neurological and psychiatric disorders. Functional magnetic resonance imaging (fMRI) acquired during rest has revealed distinct, robust resting state networks (RSNs) of regions displaying correlated low frequency fluctuations in the blood oxygen level dependent (BOLD) signal. The “default mode” network (DMN), which consists of regions showing the greatest metabolic activity at rest, may reflect the brain’s intrinsic default state (Raichle et al., 2001). Although the DMN is the best characterized of these RSNs, model-free connectivity analysis methods have identified a diverse array of such networks (Allen et al., 2011; Beckmann et al., 2005; Damoiseaux et al., 2006; De Luca et al., 2006; Kiviniemi et al., 2009; Pendse et al., 2011; Zuo et al., 2010) that have also been shown to interact with each other (Allen et al., 2012a; Doucet et al., 2011), revealing the brain to be a complex, highly interconnected neural system.
Multiple strategies have been used to determine the neurophysiological processes underlying fMRI RSNs. The hemodynamic response measured by fMRI and the amplitude of the Hilbert envelope of band-limited electroencephalography (EEG) or magnetoencephalography (MEG) power may reflect the same underlying neural processes, given that the power spectrum of the band limits signal peaks below 0.1 Hz (Leopold et al., 2003; Liu et al., 2010; Scholvinck et al., 2010). Using seed-based connectivity of Hilbert envelope data, Hipp and colleagues (Hipp et al., 2012) found large scale networks and activity hubs specific to the underlying frequency. Brookes and colleagues recently combined source localization, Hilbert envelope calculation, and model-free independent components analysis (ICA) to band-pass filtered resting state MEG data; they reported robust, reliable networks in healthy participants similar to those observed with fMRI (Brookes et al., 2011b). These networks were also evident across multiple frequency bands, although they reached peak coherence in the beta band (Brookes et al., 2012). Thus, the low frequency fluctuations evident in fMRI-derived RSNs may reflect underlying electrophysiological processes.
MDD is a common, chronic, recurrent mood disorder characterized by depressed mood, anhedonia, and guilt, as well as cognitive impairment, fatigue, psychomotor agitation or retardation, changes in weight or sleeping habits, and functional impairment. Treatment is often inadequate, and exact mechanisms of the disease are poorly understood. Notably, neuroimaging studies have implicated network dysfunction in MDD. In MDD, increased connectivity between the DMN and both the subgenual anterior cingulate cortex (sgACC) and thalamus has been observed (Davey et al., 2012; Greicius et al., 2007; Li et al., 2013; Posner et al., 2013). Decreased connectivity between the DMN and the cerebellum and prefrontal cortex, and increased connectivity between the DMN and the visual system and parahippocampal gyrus (Guo et al., 2013) have also been noted. Outside the DMN, corticolimbic connectivity may be impaired (Cao et al., 2012; Wang et al., 2012), and inter-hemispheric connectivity may be reduced (Guo et al., 2013; Wang et al., 2013).
To date, many group comparison studies using ICA of resting state fMRI data have been published across a wide array of fields and pathologies. In contrast, studies applying the ICA technique to resting state MEG data have investigated only healthy control subjects (Brookes et al., 2011b; Hall et al., 2013). Here, we present and demonstrate a technique that extends these methods and enables us to perform group comparisons in a sample of healthy subjects as well as individuals with major depressive disorder (MDD) as a proof of concept of our method. Because this is the first study to apply ICA on Hilbert envelope MEG data to a depressed patient group, specific a priori hypotheses were difficult to formulate. We did, however, expect to see alterations in connectivity in the regions most frequently associated with depression, specifically the sgACC and amygdala; finding results in these areas would further support the validity of our methodological approach.
2. Materials and Methods
2.1 Study Participants
Twenty-five psychiatrically healthy participants (15 male; 10 female) and 49 participants (30 male; 19 female) meeting DSM-IV-TR criteria for MDD were initially included in this analysis. The mental health of both subject groups was assessed using the Structured Clinical Interview for DSM-IV-TR (SCID) as well as an unstructured interview with a psychiatrist. In addition, a comprehensive family history was taken for the healthy subjects to ensure there was no family history (in first degree relatives) of any DSM-IV-TR Axis I disorder. The study was approved by the NIMH combined CNS IRB, and all participants gave written informed consent. All participants (MDD patients and controls) were unmedicated and free of major medical or neurological illnesses, as determined by medical history, physical exam, blood tests, electrocardiogram, and urinalysis. All MDD patients were administered the Montgomery Asberg Depression Rating Scale (MADRS). Additional exclusion criteria for both subject groups included pregnancy, breastfeeding, meeting DSM-IV-TR criteria for substance abuse/dependence within the past three months, and contraindications to magnetic resonance imaging (MRI). All participants had been free of medications that could potentially affect neurological function for at least two weeks (four weeks for fluoxetine).
2.2 Data Acquisition
Either one or two 250-second MEG recordings were acquired in a single session during a rest condition in which participants were asked to relax with their eyes closed, presented with no stimuli, and asked to remain still for the duration of the scan. Subjects were monitored continuously via both camera and microphone. All scans were acquired on a 275-channel CTF system at 1200Hz. Background environmental magnetic noise was attenuated by synthetic third gradient balancing. Head position was monitored throughout the scan using three fiducial head coils placed at the nasion and left and right preauricular points. T1 weighted MRI scans were acquired on a 3T GE scanner for co-registration.
2.3 Data Preprocessing
Of the 74 participants initially included in the analysis, two control datasets and nine MDD datasets were excluded due to the presence of significant artefacts in the MEG recordings, excessive motion (greater than 5mm), or problems with head localization. In addition, three healthy control datasets and seven MDD datasets were excluded in order to achieve adequate matching on gender and age (there was an unusually large cohort of individuals with MDD over 55).
This study used the high-performance computational capabilities of the Biowulf Linux cluster at the National Institutes of Health, Bethesda, MD (http://biowulf.nih.gov). MRI images were preprocessed using Analysis of Functional NeuroImages ((Cox, 1996), AFNI; NIMH, NIH, Bethesda, MD) to place three fiducial points for MEG localization. Once the fiducial points were placed, the distance between the placed fiducial points on the MRI was compared to the distance between the fiducial points measured by the MEG apparatus. The position of the placed MRI fiducials was then adjusted to minimize the between-modality differences in the distances between the fiducials. Once this procedure was complete, we computed the transformation rotating the MRI so that all fiducials were in the same axial plane. The un-rotated MRI was skull-stripped to obtain an approximate surface of the brain for use in creating the headmodel, and then transformed to standard Talairach space. The transformation to the fiducial plane and the transformation to standard space were then combined to obtain the matrix to transform the MEG to standard space.
MEG data were preprocessed using CTF software (http://www.ctf.com/) and software built in-house. We ensured that head motion was below our 5mm threshold using the CTF function headMotionDetect. The headMotionDetect algorithm flags segments in the image where the current head position differs from the initial localization of the head position by more than 5mm for at least one fiducial coil; if any time points were above our threshold, we discarded the entire recording. In order to address systematic differences between groups in head motion, we extracted time series representing the distance between each of the three fiducial coils from the baseline. We then computed the root mean squared (RMS) distance over the three fiducial coils, then the total RMS distance over the entire time series. We then compared these values between the healthy and MDD groups using independent samples t-tests. Because four subjects lacked continuous head position localization, motion in these subjects was assessed by comparing the head position at the beginning and end of the recording to ensure that subjects had not moved from the baseline position by more than 5mm. Image processing methods were largely based on the original report of ICA for MEG resting state data analysis (Brookes et al., 2011b). MEG data were corrected for the direct current (DC) offset, and high pass filtered at 0.61Hz; band-stop filters were then used to remove power line noise. Each recording was then visually inspected, and scans with significant artefacts were discarded. Synthetic aperture magnetometry (SAM) analysis (Robinson and Vrba, 1999), a scalar form of linearly constrained minimum variance (LCMV) beamforming, was performed for spatial localization on a 5mm grid after filtering to the beta band (14–30Hz). We examined only beta band in this analysis; this is consistent with prior studies of ICA on band limited power (Hall et al., 2013; Luckhoo et al., 2012), as well as with the original resting state ICA investigation, which primarily presented ICs from beta band limited power envelopes, and showed that between-node connectivity was greatest in the beta band (Brookes et al., 2011b). Furthermore, beta has been shown to be the band in which most MEG resting state networks receive maximum spectral contribution when all bands are examined in a meta-ICA (Brookes et al., 2012). Notably, the use of beta band limited power was also shown to give the greatest overlap between MEG and fMRI networks (Brookes et al., 2011a). This is fully consistent with other reports in the literature noting stronger network connectivity in alpha and beta band limited power (de Pasquale et al., 2010; Hipp et al., 2012). A regularization parameter equal to a factor of four times the estimated noise at each sensor was used to calculate the beamformer weights, and the source time series was normalized by the projected noise variance, as suggested by Hall and colleagues (Hall et al., 2013). The voxel Hilbert envelope was calculated and then temporally smoothed using a Hanning window with no overlap, and down-sampled to 1Hz, consistent with the recommendation of Luckhoo and colleagues, who showed that in general, one to four seconds is the optimal sampling rate (Luckhoo et al., 2012).
For each individual dataset, the volumetric Hilbert envelope images as a function of time were transformed to Talairach space using the transformations derived from the MRI scans. Time courses were mean centered, and the data were resampled to 8mm so that the number of time samples sufficed to estimate the ICA mixing matrix given the number of voxels in the brain. A sample of the raw Hilbert envelope data from a single voxel is shown in Supplementary Figure 1.
Because this was not a standard analysis, from this point forward we performed intensive quality control at each step. This generally consisted of manually checking each image at each subsequent point in the analysis. Although we did not set out to do seed-based correlations, we used simple visual inspection of brain-wide correlations with single voxel seeds (using AFNI’s InstaCorr function) as a quality control step. We observed that some participants had widespread correlations across the entire brain, regardless of the seed voxel picked. Because this was more likely due to spurious correlations than actual brain connectivity, we sought a systematic way to evaluate images for potential exclusion. We chose a single voxel in the motor cortex (Talairach coordinate 28, 18, 40) and obtained mean correlations for that voxel with every other voxel in the brain across all the participants. The single voxel was chosen arbitrarily, given that problematic participants showed increased correlations regardless of the seed voxel. A histogram of the resulting mean correlations is shown in Supplementary Figure 2. The mean correlations across subjects were 0.32, with a standard deviation of 0.095. A value of 0.604 for the mean correlation corresponded to three standard deviations above the mean, and a threshold of 0.6 also appeared to be reasonable given the histogram of values. As a result of this threshold we discarded one recording from a control participant, and used the second recording in the session for an MDD participant (leaving 19 control datasets and 33 MDD datasets in the final analysis).
2.4 ICA
Data from all participants were temporally concatenated, then processed using ICA (fastICA (Hyvarinen, 1999)), implemented in MATLAB (Mathworks, Natick MA). Temporal concatenation in the context of group ICA makes no assumption of temporal consistency across subjects; the assumption required is that all subjects share the same mixing matrix in the spatial dimension (Beckmann et al., 2005). The issue of a spatial consistency assumption in the presence of inter-subject differences has been addressed in the literature (Allen et al., 2012b), and we discuss this further below (see Discussion). Temporal ICA was performed after an initial principal components analysis (PCA) data reduction (on the concatenated dataset) to 25 principal components, and 25 ICs were estimated (L=25, consistent with (Brookes et al., 2011b)). Temporal ICA explicitly assumes that the recovered temporal ICs will be independent, with no requirement of spatial independence. We specifically chose a relatively low order ICA model in order to examine alterations in connectivity to large-scale resting state networks (Abou Elseoud et al., 2011). The PCA reduction ensured that only the signals with the greatest contribution to the overall variance of the data would be retained, and the ICA algorithm essentially extracted temporally independent time series (the independent components (ICs)) from the reduced data. Thus, each network or node was an independent activity source explaining a measurable portion of variance of the overall signal. Because estimating ICs is not deterministic and relies on random initialization, small but quantifiable variations in the resultant ICs can exist. In preliminary analyses we observed that these variations could result in slight differences in group results. To assess this, we used a well characterized tool, Icasso (Himberg and Hyvarinen, 2003). We chose to use Icasso out of an abundance of caution, as Icasso was developed specifically to obtain more accurate ICA estimates than any single ICA run.
The basic Icasso method involves repeating runs of fastICA (generally at least 100 iterations, though we used 500 iterations, or M=500) on the PCA reduced data. At each iteration, the data can be bootstrapped, and/or a new random initialization of the algorithm can be performed, and new ICs are generated. This results in a total of L*M IC estimates, which are clustered using average-link agglomerative clustering, with one minus the correlation coefficient between estimates used as the dissimilarity matrix. A quality parameter can then be calculated reflecting the compactness of the clusters. For each cluster C:
In the preceding equation, σij is equal to the absolute value of the correlation coefficients of the ith and jth estimate, C−l represents all clusters excluding cluster Cl, and |Cl| is the number of estimates in cluster l. In matrix terms, for all estimates Cl in cluster l, there is a Cl x Cl matrix of intra-cluster correlation coefficients. The first term represents the sum of all elements in the Cl x Cl matrix, divided by the number of elements. For all estimates Cl in cluster l, and all estimates C−l not in cluster Cl, there is a Cl x C−l matrix of inter-cluster correlation coefficients. The second term is the sum of elements in that matrix, divided by the number of elements. Thus, the Iq is an intuitively simple parameter, essentially the mean intra-cluster correlation coefficient minus the mean inter-cluster correlation coefficient. The quality index Iq varies from 1 to 0, with an ideal cluster having an Iq=1. The final ICs are calculated as centrotypes of the clusters, which should better estimate the true ICs than those derived from a single iteration of fastICA. We first used the default implementation of Icasso, and then evaluated our results and made changes as necessary, as described in the Results below. In addition to reporting the quality index defined above, the Supplementary Materials highlight our further exploration of the stability of estimates.
Because this was a temporal ICA, the resulting ICs are time course vectors. In order to obtain the group spatial components, a simple linear regression was performed (using AFNI’s 3dDeconvolve) for each component on the original 5mm Hilbert envelope datasets, concatenated in time across all participants. For presentation and simple visual inspection, we display all ICs at an empirically chosen regression coefficient value of 0.25 to reveal the most prominent nodes; please note that this threshold is irrelevant to further statistical analyses and was only used for visualization purposes. In some cases, the regression of the temporal IC on the concatenated dataset produced a t-map where the areas of maximal correlation were negative. In these cases the t-maps were inverted, such that each IC represented the true rather than the inverted time series of the primary nodes.
In order to estimate individual dataset IC maps, the IC time courses were divided into 52 segments, each corresponding to a single participant. Single subject maps were then derived using linear regression (again with AFNI’s 3dDeconvolve) for each IC. Throughout the manuscript, the terms “connectivity” or “correlation” are used to reflect the magnitude of the regression coefficient for the linear regression of the individual datasets onto the IC time courses; caution should be taken to not interpret this as a finding of literal anatomic connectivity.
For the group analysis, the spatial maps for each IC (the beta weights from the regressions of component time courses) corresponding to each individual were entered into a two-sample t-test to determine group differences, with age and gender used as covariates. This procedure parallels that used in fMRI, where it is standard procedure to compare individual subject beta weight maps using t-tests. The statistical tests were performed using the 3dttest++ function in the AFNI toolbox. The resultant t-statistic images were initially thresholded at an uncorrected p-value of 0.01 (the cluster defining threshold), and cluster-level family-wise error corrected p-values were then determined using Monte-Carlo simulations (implemented in 3dClustSim) given estimations of smoothness of the de-trended Hilbert envelope images (derived using 3dFWHMx). Although the cluster-defining threshold is somewhat arbitrary, the corrected p-values returned by 3dClustSim are valid for a wide range of cluster defining thresholds. The resulting statistical maps can be interpreted as areas where groups exhibited differences in connectivity with the primary nodes of the IC.
2.5 Post-hoc region of interest (ROI) estimates of effect size
Given the importance of the sgACC and amygdala to the pathophysiology of depression, we wanted to obtain a measure of the effect size in the group differences found in these regions; we also sought to facilitate tests of reliability. Because using the mean over the functional region would inflate the calculated effect size (Kriegeskorte et al., 2009), we used anatomically defined regions of interest (ROIs) to obtain these estimates. It should be noted that we are not suggesting that these represent a priori specified hypotheses (we used the functional results to guide which IC comparisons we applied the regions to); they are unbiased only in the sense that they can be used to obtain valid estimates of effect size. In order to demonstrate the reliability of our technique in this proof of concept analysis, we applied our ROIs to matching ICs in both the final dataset and in an independent replication dataset (described in section 2.6, below). We obtained ROIs for the left and right amygdala from the Eickhoff-Zilles cytoarchitechtonic atlas available within AFNI, and an sgACC ROI was manually drawn on the TT_N27 atlas. Mean regression weights within the ROIs were compared between groups using independent sample t-tests. We also performed t-tests to determine if the variance differed between groups for each ROI; where the variance was found to differ we applied Welch’s correction to the reported t and p values for the difference in means. We also report Cohen’s D as a measure of effect size.
2.6 Reliability data
Demonstrating reliability can significantly enhance a proof-of-concept study. Our original group of participants with useable data (before datasets were removed to achieve adequate matching between groups on age and gender) contained a subset of participants who had a second recording in the same session free of motion or substantial artifacts (Acquisition 2, n=26). Because the healthy and MDD groups in this second acquisition were not well matched by age and gender, we were concerned that this added variance would obscure the group differences presented here. Thus, in order to facilitate comparison with this group we also analyzed data from a larger group (Acquisition 1, n=57) overlapping the participants presented herein. Again, please note that every recording in the “Acquisition 2” dataset was entirely distinct from every recording in the “Acquisition 1” dataset, as well as the age/gender matched sample presented herein. Detailed methods and results for this analysis are presented in the Supplementary Materials, with only the most important results highlighted here. Results are reported specifically for the ICs that correspond to the carefully matched dataset presented herein, in order to demonstrate the reliability of the technique. It should be noted here that because the MDD and healthy groups in the replication set were poorly balanced for age, the findings may not entirely replicate those presented here. The purpose of this analysis was instead to show the consistency of the results between two independent data acquisitions and ICA analyses.
3. Results
3.1 Study Participants
The final dataset used to demonstrate the group analysis technique comprised 19 healthy participants (39.3±6.5; 8 female) and 33 participants with MDD (42.8±9.9; 11 female). The groups did not differ in age or gender distribution (p>0.1). We did not match groups based on socioeconomic factors, but did assess levels of education. Although the groups differed, this was mainly due to increased levels of post-graduate education in the control group: 100% of controls and 82% of MDD participants had at least some college education. Mean MADRS scores for depressed patients were in the high moderate range (33.2±5.6, N=31). Of the 33 MDD participants, 21 had a history of at least one comorbid anxiety disorder, three had a history of eating disorders, and one had a history of somatoform disorder. In all subjects, MDD was the primary diagnosis. Mean age of onset for those subjects in which an age could be established (n=30) was 20.0±11.5. The RMS distance from the initial head position over the entire recording for the three fiducial coils did not differ between subjects with MDD and healthy controls (t46=0.67, p>0.5)
3.2 Methodological Considerations
As described in the Methods, we initially performed Icasso using the default implementation of the software, which uses both random initialization with every iteration, and bootstrap resampling. Using this method, we obtained clusters of very low clustering quality (mean=0.438, stdev=0.156). Nevertheless, we observed that repeated single runs of fastICA reliably produced the same components. It is important to note here that single runs of fastICA were used to generate the MEG-ICA previously published results, for example, (Brookes et al., 2012; Brookes et al., 2011b). Given that the only difference between simple repeated runs of fastICA and repeated runs of fastICA within the default configuration of Icasso is the bootstrap resampling, we suspected that this caused the lack of convergence of the individual fastICA runs onto discrete components clusters. Given that random initialization alone is a valid method within the framework of Icasso, we next evaluated that option. We found that the cluster quality metrics were much improved, with a mean of 0.713 (stdev=0.171, range 0.370 to 0.947), as shown in Supplementary Figure 3.
Unfortunately, there is no established criterion upon which to base a threshold for cluster quality. Given the preliminary nature of this investigation, we elected to use a liberal threshold of Iq=0.5. We believe that this is justifiable for two reasons. First, we examined the clusters produced by the Icasso run using bootstrap resampling. Although these clusters exhibited far lower Iq values, the recovered ICs were highly correlated with those recovered using a randomization only approach (mean correlation r = 0.875). This indicates that the centroid estimations of the clusters were quite reliable, regardless of the compactness of the cluster. Second, as we demonstrate in our reliability section, the results we present from our replication dataset demonstrate that even clusters with a relatively low Iq (0.5 < Iq < 0.75) were reproducible across datasets.
3.3 ICA Group Results
Of the 25 ICs derived from the combined group, seven have frequently been reported in ICA studies of resting state fMRI, as well as MEG; these include the lateral visual, medial visual, sensorimotor, fronto-parietal, ventral stream, and executive control networks (all 25 components are illustrated in Supplementary Figure 4). Eleven ICs comprised a single primary node (at our threshold for visualization) rather than distributed networks, although in two cases the node crossed the midline, potentially indicating bilateral loci of activation indistinguishable at the level of resolution. Two ICs were distributed networks not typically reported in the fMRI resting state literature. Finally, the four remaining ICs each contained two distinct, anti-correlated nodes, the functional significance of which is unknown. Because these networks may be artefactual, they were omitted from further analysis. As noted above, ICs with Iq<0.5 were not assessed further. Thus, twenty ICs were retained for further analysis. Qualitatively, individual participant maps for each IC were highly consistent across individuals (see Figure 1), supporting the feasibility of group comparisons using this technique. Furthermore, the IC estimates were quite consistent across individual iterations of fastICA within ICASSO, as demonstrated in Supplementary Figures 5 and 6 and the accompanying text.
Figure 1.

Illustration of consistency among single participant independent component (IC) maps for two example networks: (A) Sensorimotor (Iq=0.72) and (B) Fronto-parietal, left lateralized (Iq=0.52). The group IC map is given on the left, while individual maps are shown for four arbitrarily chosen participants (the same four subjects are used to illustrate both networks). The sensorimotor network was highly robust across all participants. The fronto-parietal network was less robust in individual participants, although elements were visible in most datasets. All images are thresholded at a regression coefficient of 0.25.
3.4 Group Comparisons of IC Maps
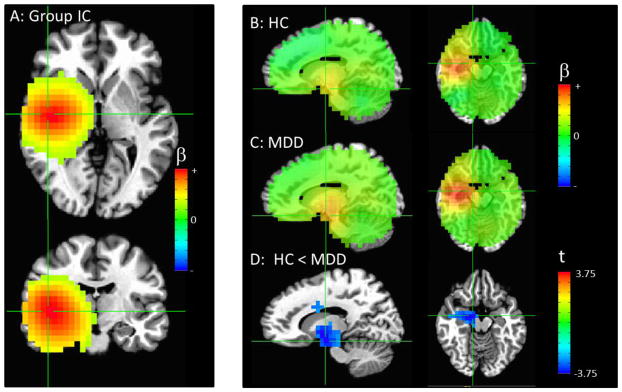
Figures 2, 3, and 4 illustrate the three networks showing group differences. While these network maps appear rather more diffuse than typical resting state networks in fMRI, this is consistent with prior reports (Brookes et al., 2011b), and resulted from the lower spatial resolution and signal leakage inherent in MEG. All p-values given are family-wise error (FWE) corrected for multiple corrections at the cluster level over the entire brain. Connectivity with a precentral gyrus IC was significantly reduced in participants with MDD relative to controls in the sgACC and ventrolateral prefrontal cortex (VLPFC) (p<0.001) and hippocampus (p<0.001) (Figure 2D). Although the primary node in the IC was in the right precentral gyrus, additional smaller nodes were apparent in the precuneus and contralateral precentral gyrus (Figure 2A).
Figure 2.

(A) The combined group independent component (IC) with the primary node in the right precentral gyrus (crosshairs at peak in upper frame), with additional smaller nodes in left precentral gyrus and precuneus (crosshairs at peak in lower frame). (B) Image showing the IC map for all healthy controls and (C) patients, un-thresholded, with the crosshairs centered at the areas of significant differences between groups. (D) Areas of significantly decreased connectivity in MDD compared to control participants, thresholded at puncorrected <0.01, with only clusters significant at pcorr<0.05 shown. There is a cluster primarily in the subgenual cingulate cortex extending into the ventrolateral prefrontal cortex (pcorr<0.001, crosshairs centered on peak in left column), as well as a cluster in the hippocampus/parahippocampal gyrus (pcorr<0.001, crosshairs centered on peak in right column). Please note that the extrema of the color scales represent the approximate maximum value in the image.
Figure 3.
(A) The combined group independent component (IC) with the primary node in the right insula/temporal cortex (crosshairs at peak in both frames). (B) Image showing the IC map for all healthy controls and (C) patients, un-thresholded, with the crosshairs centered at the areas of significant difference between groups. (D) Areas of significantly increased connectivity in MDD compared to control participants, thresholded at puncorrected <0.01, with only clusters significant at pcorr<0.05 shown. Crosshairs are centered at the peak of the large cluster that encompassed the right amygdala, thalamus, and dorsal cingulate (pcorr<0.001, both left and right columns). Please note that the extrema of the color scales represent the approximate maximum value in the image.
Figure 4.

(A) The combined group independent component (IC) with the primary node in the left insula/temporal cortex (crosshairs at peak in both frames). (B) Image showing the IC map for all healthy controls and (C) patients, un-thresholded, with the crosshairs centered at the area of significant difference between groups (left column) and the peak in the vicinity of the amygdala (right column). (D) Image showing areas of significantly decreased connectivity in MDD compared to control participants, thresholded at puncorrected<0.01. The crosshairs are centered on the significant cluster in the left precentral and angular gyrus, shown in the left panel (pcorr<0.03). Note that we thresholded this image to additionally show the cluster containing the highest t-values in the left amygdala, although this cluster did not survive correction for multiple comparisons. Crosshairs are centered on this peak in the right column. Please note that the extrema of the color scales represent the approximate maximum value in the image.
Connectivity with a right temporal component centered in the insula was increased in MDD participants compared with healthy controls in a large cluster encompassing the right amygdala, thalamus, and dorsal cingulate (p<0.001, Figure 3D).
Connectivity with a left temporal IC centered in the insula was increased in MDD participants compared with healthy controls in a cluster encompassing the left precentral gyrus and left angular gyrus (p<0.03). Notably, we also observed that the highest t-values were localized to the left amygdala, similar to the finding for the right temporal IC, although the cluster did not survive correction for multiple comparisons (Figure 4D). As presented, these results are not corrected for multiple comparisons over the 20 ICs examined. Nevertheless, even after applying a stringent Bonferroni correction, which would require an uncorrected p<0.0025, the findings of reduced connectivity between the precentral IC and clusters in the sgACC and hippocampus remained significant. Additionally, the finding of reduced connectivity between the right temporal IC and right amygdala would also remain significant. We also assessed the stability of our sgACC result across each of the 500 fastICA iterations performed by Icasso (Supplementary Figure 7).
3.5 Post-hoc ROI estimates of effect size
Group differences within anatomically defined ROIs are shown in Figure 5, with both the ROIs and the ICs shown in each plot. The group differences in connectivity between the sgACC and the precentral IC were significant (t=2.82, p=0.007, Figure 5A) within an anatomical ROI, with Cohen’s D of 0.8 indicating a large effect. For the left and right temporal ICs, we examined connectivity within both the left and right amygdalae, to assess whether contralateral connectivity was disrupted. The group difference in connectivity between the right temporal IC and the right amygdala was significant (t=3.40, p=0.001, Figure 5B) within an anatomical ROI, with a Cohen’s D of 1.0, indicating a large effect. The exploratory test for contralateral amygdala connectivity revealed a significant group difference (t=2.0, p=0.05, Figure 5C) and a Cohen’s D of 0.5, indicating a medium effect. The group difference in connectivity between the left temporal IC and the left amygdala was significant in the anatomical ROI (t=3.77, p<0.0005, Figure 5E), with a large effect size (D=1.1). No significant connectivity was observed between the left temporal IC and the right amygdala (p>0.1).
Figure 5.

Scatterplots showing connectivity between anatomically defined regions of interest (ROIs) and independent components (ICs) within regions known to be involved in the pathophysiology of MDD. (A) Connectivity between the precentral/precuneus IC and subgenual anterior cingulate (sgACC). (B) and (C) Connectivity between a right insulo-temporal IC and the right and left amygdala, respectively. (D) and (E) Connectivity between a left insulo-temporal IC and the right and left amygdala, respectively. All IC images are thresholded at β=0.25, with color scale maximum set to β=0.75.
3.6 Reliability
Full results from the reliability analyses appear in the Supplementary Materials. The results between the Acquisition 1 group (overlapping with the primary group) were extremely consistent with those found in the fully independent Acquisition 2 group. First, all three ICs shown in Figures 2, 3, and 4 were recovered from our overlapping Acquisition 1 and independent reliability Acquisition 2 dataset (Supplementary Figure 8). The regression coefficients derived from the same ROIs described above exhibited overlapping values for both Acquisitions 1 and 2 (Supplementary Figure 9). Because our Acquisition 2 group was small and underpowered (only six healthy controls), we report Cohen’s D in addition to p-values. Our Acquisition 2 data showed a medium between group effect for the correlation of sgACC with the precentral IC (D=0.63, p=0.16), a large between group effect for the correlation of right amygdala with the right insulo-temporal IC (D=1.31, p=0.006), and a large between group effect for the correlation of the left amygdala with the right insulo-temporal IC (D=0.89, p=0.051). This is particularly notable given that the Acquisition 2 healthy and MDD groups were poorly matched by age and gender. Supplementary Figure 10 also shows correlations between regression coefficients derived from the Acquisition 1 and 2 analyses. Finally, spatial maps showing connectivity to the precentral IC and right insulo-temporal IC were highly consistent with those shown herein (Figure 6). Furthermore, a cluster encompassing bilateral amygdala showed a significant connectivity with the right insulo-temporal IC (pcorr<0.01).
Figure 6.

Illustration of the concordance between voxel-wise group difference maps for Acquisition 1 (age/gender unbalanced sample overlapping with main study sample) and Acquisition 2 (fully independent recordings from similarly unbalanced sample). (A) Reduced connectivity to the precentral IC in MDD subjects was evident in both acquisitions. Two views (sagittal and axial) are shown to facilitate comparison of both the sgACC and hippocampus/parahippocampal gyrus clusters. Of particular note, compare the independent Acquisition 2 sample to the main finding in Figure 2D. (B) Image shows increased connectivity in the MDD subjects evident at identical statistical thresholds in both samples, analogous to the results in amygdala in Figure 3D. Please note that the extrema of the color scales represent the approximate maximum value in the image.
4. Discussion
This study is the first to demonstrate the feasibility of a between-groups analysis using the resting state MEG ICA techniques first demonstrated by Brookes and colleagues (Brookes et al., 2011b); all previous MEG ICA studies have been conducted on a single, healthy group of participants. Although the techniques largely parallel techniques used in the fMRI literature, some additional steps were necessary to obtain reliable results. Notably, additional quality control steps were required, the use of Icasso was required to ensure stability of the results, and modifications to the default behavior of Icasso were needed to ensure high quality estimates of the final ICs. Some of these steps merit further comment.
Specifically, the technique used here to remove scans that appeared to be free from artifacts but exhibited spurious correlations is potentially applicable to all functional imaging studies (and all modalities) that use connectivity measures. The method will need to be further characterized to ascertain whether there is a globally appropriate threshold, or if the threshold should be deduced from the distribution of global correlation values for each particular study. Our application of Icasso to resting state MEG Hilbert envelope data also merits comment. The original papers describing the Icasso method used MEG data to illustrate the utility of the algorithm; however, these were raw MEG data and not a source space Hilbert envelope signal, which has quite different spatio-temporal properties. Here, we demonstrated that the compactness of clusters produced by Icasso could be improved by using random initialization at every fastICA run, without bootstrap resampling of the data. Remes and colleagues (Remes et al., 2011) previously performed a detailed evaluation of Icasso applied to spatial ICA on fMRI data and found that bootstrapping produced undesirable effects under certain conditions, and altered spectral characteristics of the recovered sources. A closer examination of the bootstrapping algorithm implemented in Icasso revealed that the resampling procedure excludes up to 40% of the data points from each iteration. We hypothesize that the magnitude of under-sampling of the data may have resulted in less accurate estimation of the components, especially given that our sources tend to be quite Gaussian, and that ICA is already somewhat insensitive to separation of Gaussian sources. Resampling algorithms which include more samples may be more accurate; in addition, it may be advantageous to investigate other blind source separation methods that may be better suited to separating correlated Gaussian sources, such as those present in neuroimaging data (see, for example, (Wheland and Pantazis, 2014)).
We would like to briefly comment on the consistency images between individual spatial maps of each component (Figure 1). There are two separate points to be made here. First, our temporal concatenation algorithm imposed a degree of spatial consistency due to the shared mixing matrix in the spatial dimension. Thus, it is not necessarily surprising that the individual maps were quite consistent. Nevertheless, inter-subject variability was present. A recent study by Allen and colleagues (Allen et al., 2012b) specifically explored whether the imposition of spatial consistency imposed by a temporal concatenation ICA approach allowed the recovery of sources that were spatially variable across subjects. Through exhaustive simulations, the authors concluded that alterations in individual subjects’ patterns of activity could be captured with a high degree of accuracy. This supports the use of the temporal concatenation method in examining group differences. Nevertheless, we can never be precisely certain that individual spatial differences have been ideally captured by this model without performing individual subject ICAs, an approach not feasible due to the relatively short recordings acquired from each participant. Thus, this remains a limitation of group ICA methods.
One of the most important aspects of this manuscript is the replication analysis. Although our replication set was not ideal (it was poorly matched for age between groups, necessitating comparison with a similarly unmatched group rather than our final dataset), the results are nonetheless striking. Both the voxel-wise group comparisons as well as the absolute values of the beta weights were in good agreement. The correspondence between the results is especially remarkable given the much smaller sample size used to derive the ICs. Taken together, the replication results indicate that this technique is robust, and thus could potentially be applied to a wide array of disorders or characteristics.
In order to demonstrate proof of concept, we applied our methods to a group of subjects with MDD, where we observed decreased connectivity between the sgACC and a network with primary nodes in precentral motor cortex and precuneus, and increased connectivity in limbic and temporal areas. While the reported findings extend the clinical literature by expanding abnormalities to the electrophysiological domain, the localization of findings in the sgACC and amygdala further support the validity of the technique, given the known relationship between these areas and MDD.
It should be noted that diverse studies have established the role of the sgACC in MDD. PET studies have unequivocally shown increased glucose metabolism in the sgACC, structural studies have shown reduced grey matter volume, and the postmortem literature has implicated glial abnormalities (reviewed in (Drevets et al., 2008)). Connectomic diffusion tensor imaging studies also found alterations in sgACC connectivity (Korgaonkar et al., 2014). Deep brain stimulation targeting the sgACC resulted in robust relief from depressive symptoms (Mayberg et al., 2005), and vagus nerve stimulation (Pardo et al., 2008) and antidepressant treatment also normalized sgACC metabolism (Drevets et al., 2002a; Kennedy et al., 2007). Since our group IC map did not contain an sgACC node, we view this group difference as somewhat analogous to group differences in inter-network connectivity, although sgACC is visible in the unthresholded maps shown in Figure 2 B and C. Thus, the present finding of aberrant sgACC connectivity within a precentral motor network expands the notion that the sgACC functions as a hub region modulating a wide array of other networks responsible for the diverse symptoms associated with MDD (Mayberg, 2003). Connectivity between the sgACC and motor areas may suggest that that sgACC is involved in modulating psychomotor retardation in MDD in addition to its established role in mediating other symptom clusters (Drevets et al., 2008), although further studies are required to test this potential hypothesis. Notably, however, studies of psychomotor retardation in the context of both MDD and bipolar disorder have associated blood flow in the adjacent supra- and pregenual anterior cingulate with level of motor dysfunction (Dunn et al., 2002; Mayberg et al., 1994). Abnormalities in motor cortical function in MDD have also been reported; for example, a meta-analysis of eight PET studies found hypoactivity in the precentral gyrus (Alcaro et al., 2010). Also relevant to our primary result is the finding that beta oscillations are associated with multiple aspects of motor control potentially underlying the resting “idling rhythm” of the motor system; additional evidence suggests that beta band activity mediates interactions between the motor system and higher cognitive systems (reviewed in (Engel and Fries, 2010)). Our results support the extant literature characterizing the sgACC as a hub region whose modulation affects diverse depressive symptoms, but also extends these findings by implicating beta band oscillations in the sgACC regulation of motor control.
We also noted robust increases in connectivity in MDD participants between the temporal cortical ICs, both of which were centered in the insular cortex but extended throughout neighboring temporal areas, as well as the thalamus, dorsal cingulate, and precentral and angular gyri. MDD participants showed increased connectivity between the right insular-temporal IC and the bilateral amygdala, thalamus, and dorsal cingulate, as well as between the left insular-temporal IC and left precentral and angular gyri and potentially the left amygdala. Increased connectivity between insular cortices and the amygdala specifically in the dorsomedial insula was recently reported in an fMRI resting state study of MDD (Avery et al., 2014). Collectively, these regions are also notable for their high degree of connectivity with both the DMN and the extended visceromotor network (Price and Drevets, 2010). The finding of increased connectivity among these regions is consistent with a general hypothesis of aberrant cortico-limbic connectivity in MDD (de Kwaasteniet et al., 2013). Studies examining brain-wide changes in resting state functional connectivity also found aberrant connectivity within and between the hippocampus, amygdala, parahippocampal gyrus, and posterior cingulate (Zeng et al., 2012); prominent alterations in hippocampal nodes were also evident in graph theory analyses (Zhang et al., 2011). Our findings are also consistent with structural connectivity results that reported increased connectivity between the inferior and middle temporal gyrus and hippocampus in depressed participants compared with healthy controls (Fang et al., 2012), and increased structural connectivity between the lingual gyrus and superior temporal gyrus (Korgaonkar et al., 2012).
It should be noted that although we have reviewed findings from the fMRI resting state literature here, we do not mean to imply that our results demonstrate dysfunction in any resting state fMRI network. Rather, we believe our results are unique to resting state MEG, in part due to their specificity to beta oscillatory power, although they are consistent with those reported in the resting state fMRI literature. Although the amygdala area in which we found altered connectivity overlaps with our group IC map, there is no reason to suspect that the phenomenon of signal leakage would differ between subject groups, and our findings likely reflect alterations in within-network connectivity. One potential caveat is that the findings in the amygdala are in deep areas that are of relatively lower signal to noise compared to cortical regions. Previous studies from our group (Salvadore et al., 2009; Salvadore et al., 2010) demonstrated robust amygdala activity detectable via MEG, and simulation studies found that even weak deep sources could be accurately localized (Papadelis et al., 2009). Although our study was conducted in the resting state rather than during an emotional task designed to activate the amygdala, evidence suggests that resting state cognition frequently includes an affective component (Delamillieure et al., 2010); in addition, strong evidence exists for greater activation in the amygdala at rest in subjects with MDD compared to healthy control subjects (Drevets, 1999; Drevets et al., 2002b).
The underlying etiology of the observed alterations in connectivity is unknown, although evidence suggests that the glutamatergic system may be involved. Animal studies suggest that the sgACC hyperactivity in glutamate metabolism observed in humans (Drevets et al., 2008) may be due to up-regulation of N-methyl-D-aspartate (NMDA) receptors and down-regulation of α-Amino-3-hydroxy-5-methyl-4-isoxazolepropionic acid) (AMPA) receptors (reviewed in (Alcaro et al., 2010)). Glutamate levels in the medial prefrontal cortex have been associated with connectivity to subcortical regions (Duncan et al., 2013) and levels of glutamate and glutamine (Glx) in the same region predicted connectivity to the anterior insula (Horn et al., 2010). The NMDA receptor antagonist ketamine has also been shown to acutely increase global connectivity (Driesen et al., 2013), supporting the hypothesis that the alterations in connectivity present in MDD are partly due to altered glutamatergic signaling. Other authors have proposed using ketamine to study resting state functional connectivity, particularly in the sgACC (Dutta et al., 2014). These results are particularly salient given that ketamine also rapidly ameliorates depressive symptoms in MDD (Zarate et al., 2006).
This study possesses several strengths. First, we believe that the homogeneity of our sample is a particular strength. All of our subjects had been unmedicated for at least two weeks (four for fluoxetine) at the time of scanning. Many prior studies on resting state connectivity included subjects receiving a variety of agents with varying degrees of individual efficacy. Results of those studies could thus not be unequivocally attributed to the underlying disease rather than the concomitant drug regimen. Most of the unmedicated subjects with MDD in the present study went on to complete treatment studies. Future studies from our group will observe the effects of treatment on networks found to be aberrant in unmedicated depressed states. Second, we believe that the use of MEG, rather than the more commonly employed (and better characterized) fMRI particularly strengthens this work. In our opinion MEG can provide unique insights not possible with fMRI, given that it directly measures neuronal activity with a hemodynamic response function and without convolution (Engel et al., 2013; Scholvinck et al., 2013). Although we removed some temporal information during the calculation of the Hilbert envelope and subsequent downsampling, our results are still specific to beta band (14–30Hz) neural activity, a conclusion not possible with fMRI. Furthermore, although we did not specifically address the issue in the present study, substantial evidence suggests that resting state functional connectivity is inherently dynamic, and the higher temporal resolution of electrophysiological techniques are necessary to capture the non-stationarity of connectivity and the multi-scale coupling modes present on neuronal, rather than hemodynamic, time scales (Engel et al., 2013; Meyer et al., 2013). The present study is an initial investigation into group differences in MEG connectivity that can be expanded to other time scales and spectral domains. Although the quality of enhanced temporal resolution is also a feature of the more readily accessible EEG, MEG offers greater spatial resolution.
Our study is also associated with several weaknesses that limitations. Although we provide some discussion of these issues and how they limit, but do not invalidate our conclusions, we do not intend to imply that these are not true weaknesses. Given the proof of concept nature of this study, we felt that a more focused analysis was appropriate for this initial investigation. Nevertheless, the extant literature suggests differences in connectivity across the spectrum of electrophysiological activity (de Pasquale et al., 2010; Hipp et al., 2012), and we are currently pursing interactions between group effects and frequency band. A statistical limitation on our group analysis was our examination of all the ICs between groups. Again, we felt that this was appropriate for a preliminary hypothesis-generating analysis; notably, our significant findings were in areas with known functions in the pathophysiology of depression, and the primary findings survived correction for multiple comparisons over the 20 ICs examined. Another statistical limitation was the fact that our MDD group was slightly larger than our control group. While the impact of this on an ICA is difficult to predict, we believe that this would most likely result in a better “fit” of the ICs to the MDD group, potentially resulting in a relative increase in the variance of the regression coefficients in the healthy group. Although we did not account for alterations in variance between groups in the voxel-wise analysis, we did correct for differences in variance in the post-hoc ROI analysis. A methodological limitation was the use of the multisphere head model over a more realistic model; this was done in part to parallel prior studies (Brookes et al., 2011b), although some recent connectivity reports do use realistic head models (Hipp et al., 2012). In addition, coregistration using a more advanced 3d digitizer system and measurement of the head shape would have been preferable over our registration of MRI and MEG scans using only the fiducial placements. Finally, an overall limitation of the temporal ICA approach is that the recovered ICs are independent, and thus uncorrelated (although the ICs from an Icasso analysis may violate this constraint; since cluster centroids are used, valid correlations between components are still of questionable validity). Because of this, we cannot use the ICs to examine between-network connectivity (i.e. by correlating the IC estimates).
In conclusion, this study explored the use of ICA and Hilbert Envelope resting state MEG data to demonstrate that reliable, robust group differences can be measured. Our proof of concept demonstration, which used a group of healthy participants and those with MDD, found altered connectivity of the sgACC with a precentral motor network in MDD, and increased connectivity with insulo-temporal nodes, particularly the amygdala. These findings are fully consistent with the extant literature on MDD, supporting the validity of the analysis techniques. Extending the literature, this finding suggests that the sgACC may play a role in modulating the motor symptoms of MDD, and extends findings of aberrant cortico-limbic connectivity by specifically implicating beta band oscillatory power. Elucidation of the electrophysiological underpinnings of dysfunctional connectivity in MDD (and indeed, other psychiatric and neurological disorders) may lead to the identification of new targets for treatment and facilitate drug development. We anticipate that the techniques explored and presented in this study will be applicable to a wide range of investigations.
Supplementary Material
Highlights.
A model-free Independent Components Analysis was used to extract networks
A methodology for determining group differences was formulated and applied to MDD
MDD patients had decreased connectivity between motor cortex and subgenual cingulate
Increased connectivity was seen between unilateral temporal ICs & bilateral amygdala
Acknowledgments
Funding for this work was supported by the Intramural Research Program at the National Institute of Mental Health, National Institutes of Health (IRP-NIMH-NIH), by a NARSAD Independent Investigator to CAZ, and by the Brain & Behavior Mood Disorders Research Award to CAZ. The authors thank the 7SE research unit and staff for their support. Ioline Henter, MA (NIMH) provided invaluable editorial assistance. We are also grateful to Matthew Brookes for many helpful conversations regarding the techniques implemented herein.
Footnotes
5. Conflict of Interest and Financial Disclosures
Funding for this work was supported by the Intramural Research Program of the National Institute of Mental Health, National Institutes of Health (IRP-NIMH-NIH; Clinical Trials Identifier: NCT00024635 (ZIA-MH002927-04), by a NARSAD Independent Investigator to CAZ, and by the Brain & Behavior Mood Disorders Research Award to CAZ. CAZ is listed as a co-inventor on a patent application for the use of ketamine and its metabolites in major depression; he has assigned his rights in the patent to the US Government but will share a percentage of any royalties that may be received by the Government. MLF is listed as a co-inventor on a patent application for the use of scopolamine to treat depression; she has assigned all rights to the US Government but will benefit financially from any royalties received by the US Government. The remaining authors declare no competing financial interests.
Publisher's Disclaimer: This is a PDF file of an unedited manuscript that has been accepted for publication. As a service to our customers we are providing this early version of the manuscript. The manuscript will undergo copyediting, typesetting, and review of the resulting proof before it is published in its final citable form. Please note that during the production process errors may be discovered which could affect the content, and all legal disclaimers that apply to the journal pertain.
Clinical Trials Identifier
NCT00024635 (ZIA-MH002927-04)
References
- Abou Elseoud A, Littow H, Remes J, Starck T, Nikkinen J, Nissila J, Timonen M, Tervonen O, Kiviniemi V. Group-ICA Model Order Highlights Patterns of Functional Brain Connectivity. Front Syst Neurosci. 2011;5:37. doi: 10.3389/fnsys.2011.00037. [DOI] [PMC free article] [PubMed] [Google Scholar]
- Alcaro A, Panksepp J, Witczak J, Hayes DJ, Northoff G. Is subcortical-cortical midline activity in depression mediated by glutamate and GABA? A cross-species translational approach. Neurosci Biobehav Rev. 2010;34:592–605. doi: 10.1016/j.neubiorev.2009.11.023. [DOI] [PubMed] [Google Scholar]
- Allen EA, Damaraju E, Plis SM, Erhardt EB, Eichele T, Calhoun VD. Tracking Whole-Brain Connectivity Dynamics in the Resting State. Cereb Cortex. 2012a doi: 10.1093/cercor/bhs352. [DOI] [PMC free article] [PubMed] [Google Scholar]
- Allen EA, Erhardt EB, Damaraju E, Gruner W, Segall JM, Silva RF, Havlicek M, Rachakonda S, Fries J, Kalyanam R, Michael AM, Caprihan A, Turner JA, Eichele T, Adelsheim S, Bryan AD, Bustillo J, Clark VP, Feldstein Ewing SW, Filbey F, Ford CC, Hutchison K, Jung RE, Kiehl KA, Kodituwakku P, Komesu YM, Mayer AR, Pearlson GD, Phillips JP, Sadek JR, Stevens M, Teuscher U, Thoma RJ, Calhoun VD. A baseline for the multivariate comparison of resting-state networks. Front Syst Neurosci. 2011;5:2. doi: 10.3389/fnsys.2011.00002. [DOI] [PMC free article] [PubMed] [Google Scholar]
- Allen EA, Erhardt EB, Wei Y, Eichele T, Calhoun VD. Capturing inter-subject variability with group independent component analysis of fMRI data: a simulation study. Neuroimage. 2012b;59:4141–4159. doi: 10.1016/j.neuroimage.2011.10.010. [DOI] [PMC free article] [PubMed] [Google Scholar]
- Avery JA, Drevets WC, Moseman SE, Bodurka J, Barcalow JC, Simmons WK. Major depressive disorder is associated with abnormal interoceptive activity and functional connectivity in the insula. Biol Psychiatry. 2014;76:258–266. doi: 10.1016/j.biopsych.2013.11.027. [DOI] [PMC free article] [PubMed] [Google Scholar]
- Beckmann CF, DeLuca M, Devlin JT, Smith SM. Investigations into resting-state connectivity using independent component analysis. Philos Trans R Soc Lond B Biol Sci. 2005;360:1001–1013. doi: 10.1098/rstb.2005.1634. [DOI] [PMC free article] [PubMed] [Google Scholar]
- Brookes MJ, Hale JR, Zumer JM, Stevenson CM, Francis ST, Barnes GR, Owen JP, Morris PG, Nagarajan SS. Measuring functional connectivity using MEG: methodology and comparison with fcMRI. Neuroimage. 2011a;56:1082–1104. doi: 10.1016/j.neuroimage.2011.02.054. [DOI] [PMC free article] [PubMed] [Google Scholar]
- Brookes MJ, Liddle EB, Hale JR, Woolrich MW, Luckhoo H, Liddle PF, Morris PG. Task induced modulation of neural oscillations in electrophysiological brain networks. Neuroimage. 2012;63:1918–1930. doi: 10.1016/j.neuroimage.2012.08.012. [DOI] [PubMed] [Google Scholar]
- Brookes MJ, Woolrich M, Luckhoo H, Price D, Hale JR, Stephenson MC, Barnes GR, Smith SM, Morris PG. Investigating the electrophysiological basis of resting state networks using magnetoencephalography. Proc Natl Acad Sci U S A. 2011b;108:16783–16788. doi: 10.1073/pnas.1112685108. [DOI] [PMC free article] [PubMed] [Google Scholar]
- Cao X, Liu Z, Xu C, Li J, Gao Q, Sun N, Xu Y, Ren Y, Yang C, Zhang K. Disrupted resting-state functional connectivity of the hippocampus in medication-naive patients with major depressive disorder. J Affect Disord. 2012;141:194–203. doi: 10.1016/j.jad.2012.03.002. [DOI] [PubMed] [Google Scholar]
- Cox RW. AFNI: software for analysis and visualization of functional magnetic resonance neuroimages. Comput Biomed Res. 1996;29:162–173. doi: 10.1006/cbmr.1996.0014. [DOI] [PubMed] [Google Scholar]
- Damoiseaux JS, Rombouts SA, Barkhof F, Scheltens P, Stam CJ, Smith SM, Beckmann CF. Consistent resting-state networks across healthy subjects. Proc Natl Acad Sci U S A. 2006;103:13848–13853. doi: 10.1073/pnas.0601417103. [DOI] [PMC free article] [PubMed] [Google Scholar]
- Davey CG, Harrison BJ, Yucel M, Allen NB. Regionally specific alterations in functional connectivity of the anterior cingulate cortex in major depressive disorder. Psychol Med. 2012;42:2071–2081. doi: 10.1017/S0033291712000323. [DOI] [PubMed] [Google Scholar]
- de Kwaasteniet B, Ruhe E, Caan M, Rive M, Olabarriaga S, Groefsema M, Heesink L, van Wingen G, Denys D. Relation between structural and functional connectivity in major depressive disorder. Biol Psychiatry. 2013;74:40–47. doi: 10.1016/j.biopsych.2012.12.024. [DOI] [PubMed] [Google Scholar]
- De Luca M, Beckmann CF, De Stefano N, Matthews PM, Smith SM. fMRI resting state networks define distinct modes of long-distance interactions in the human brain. Neuroimage. 2006;29:1359–1367. doi: 10.1016/j.neuroimage.2005.08.035. [DOI] [PubMed] [Google Scholar]
- de Pasquale F, Della Penna S, Snyder AZ, Lewis C, Mantini D, Marzetti L, Belardinelli P, Ciancetta L, Pizzella V, Romani GL, Corbetta M. Temporal dynamics of spontaneous MEG activity in brain networks. Proc Natl Acad Sci U S A. 2010;107:6040–6045. doi: 10.1073/pnas.0913863107. [DOI] [PMC free article] [PubMed] [Google Scholar]
- Delamillieure P, Doucet G, Mazoyer B, Turbelin MR, Delcroix N, Mellet E, Zago L, Crivello F, Petit L, Tzourio-Mazoyer N, Joliot M. The resting state questionnaire: An introspective questionnaire for evaluation of inner experience during the conscious resting state. Brain Res Bull. 2010;81:565–573. doi: 10.1016/j.brainresbull.2009.11.014. [DOI] [PubMed] [Google Scholar]
- Doucet G, Naveau M, Petit L, Delcroix N, Zago L, Crivello F, Jobard G, Tzourio-Mazoyer N, Mazoyer B, Mellet E, Joliot M. Brain activity at rest: a multiscale hierarchical functional organization. J Neurophysiol. 2011;105:2753–2763. doi: 10.1152/jn.00895.2010. [DOI] [PubMed] [Google Scholar]
- Drevets WC. Prefrontal cortical-amygdalar metabolism in major depression. Annals of the New York Academy of Science. 1999;877:614–637. doi: 10.1111/j.1749-6632.1999.tb09292.x. [DOI] [PubMed] [Google Scholar]
- Drevets WC, Bogers W, Raichle ME. Functional anatomical correlates of antidepressant drug treatment assessed using PET measures of regional glucose metabolism. European Neuropsychopharmacology. 2002a;12:527–544. doi: 10.1016/s0924-977x(02)00102-5. [DOI] [PubMed] [Google Scholar]
- Drevets WC, Price JL, Bardgett ME, Reich T, Todd RD, Raichle ME. Glucose metabolism in the amygdala in depression: relationship to diagnostic subtype and plasma cortisol levels. Pharmacol Biochem Behav. 2002b;71:431–447. doi: 10.1016/s0091-3057(01)00687-6. [DOI] [PubMed] [Google Scholar]
- Drevets WC, Savitz J, Trimble M. The subgenual anterior cingulate cortex in mood disorders. CNS Spectr. 2008;13:663–681. doi: 10.1017/s1092852900013754. [DOI] [PMC free article] [PubMed] [Google Scholar]
- Driesen NR, McCarthy G, Bhagwagar Z, Bloch M, Calhoun V, D'Souza DC, Gueorguieva R, He G, Ramachandran R, Suckow RF, Anticevic A, Morgan PT, Krystal JH. Relationship of resting brain hyperconnectivity and schizophrenia-like symptoms produced by the NMDA receptor antagonist ketamine in humans. Mol Psychiatry. 2013 doi: 10.1038/mp.2012.194. [DOI] [PMC free article] [PubMed] [Google Scholar]
- Duncan NW, Wiebking C, Tiret B, Marjanska M, Hayes DJ, Lyttleton O, Doyon J, Northoff G. Glutamate concentration in the medial prefrontal cortex predicts resting-state cortical-subcortical functional connectivity in humans. PLoS One. 2013;8:e60312. doi: 10.1371/journal.pone.0060312. [DOI] [PMC free article] [PubMed] [Google Scholar]
- Dunn RT, Kimbrell TA, Ketter TA, Frye MA, Willis MW, Luckenbaugh DA, Post RM. Principal components of the Beck Depression Inventory and regional cerebral metabolism in unipolar and bipolar depression. Biol Psychiatry. 2002;51:387–399. doi: 10.1016/s0006-3223(01)01244-6. [DOI] [PubMed] [Google Scholar]
- Dutta A, McKie S, Deakin JF. Resting state networks in major depressive disorder. Psychiatry Res. 2014;224:139–151. doi: 10.1016/j.pscychresns.2014.10.003. [DOI] [PubMed] [Google Scholar]
- Engel AK, Fries P. Beta-band oscillations--signalling the status quo? Curr Opin Neurobiol. 2010;20:156–165. doi: 10.1016/j.conb.2010.02.015. [DOI] [PubMed] [Google Scholar]
- Engel AK, Gerloff C, Hilgetag CC, Nolte G. Intrinsic coupling modes: multiscale interactions in ongoing brain activity. Neuron. 2013;80:867–886. doi: 10.1016/j.neuron.2013.09.038. [DOI] [PubMed] [Google Scholar]
- Fang P, Zeng LL, Shen H, Wang L, Li B, Liu L, Hu D. Increased cortical-limbic anatomical network connectivity in major depression revealed by diffusion tensor imaging. PLoS One. 2012;7:e45972. doi: 10.1371/journal.pone.0045972. [DOI] [PMC free article] [PubMed] [Google Scholar]
- Greicius MD, Flores BH, Menon V, Glover GH, Solvason HB, Kenna H, Reiss AL, Schatzberg AF. Resting-state functional connectivity in major depression: abnormally increased contributions from subgenual cingulate cortex and thalamus. Biol Psychiatry. 2007;62:429–437. doi: 10.1016/j.biopsych.2006.09.020. [DOI] [PMC free article] [PubMed] [Google Scholar]
- Guo W, Liu F, Xue Z, Gao K, Liu Z, Xiao C, Chen H, Zhao J. Abnormal resting-state cerebellar-cerebral functional connectivity in treatment-resistant depression and treatment sensitive depression. Prog Neuropsychopharmacol Biol Psychiatry. 2013;44:51–57. doi: 10.1016/j.pnpbp.2013.01.010. [DOI] [PubMed] [Google Scholar]
- Hall EL, Woolrich MW, Thomaz CE, Morris PG, Brookes MJ. Using variance information in magnetoencephalography measures of functional connectivity. Neuroimage. 2013;67:203–212. doi: 10.1016/j.neuroimage.2012.11.011. [DOI] [PubMed] [Google Scholar]
- Himberg J, Hyvarinen A. Icasso: software for investigating the reliability of ICA estimates by clustering and visualization. IEEE Workshop on Neural Networks for Signal Processing; Toulouse, France. 2003. pp. 259–268. [Google Scholar]
- Hipp JF, Hawellek DJ, Corbetta M, Siegel M, Engel AK. Large-scale cortical correlation structure of spontaneous oscillatory activity. Nat Neurosci. 2012;15:884–890. doi: 10.1038/nn.3101. [DOI] [PMC free article] [PubMed] [Google Scholar]
- Horn DI, Yu C, Steiner J, Buchmann J, Kaufmann J, Osoba A, Eckert U, Zierhut KC, Schiltz K, He H, Biswal B, Bogerts B, Walter M. Glutamatergic and resting-state functional connectivity correlates of severity in major depression - the role of pregenual anterior cingulate cortex and anterior insula. Front Syst Neurosci. 2010:4. doi: 10.3389/fnsys.2010.00033. [DOI] [PMC free article] [PubMed] [Google Scholar]
- Hyvarinen A. Fast and robust fixed-point algorithms for independent component analysis. IEEE Trans Neural Netw. 1999;10:626–634. doi: 10.1109/72.761722. [DOI] [PubMed] [Google Scholar]
- Kennedy SH, Konarski JZ, Segal ZV, Lau MA, Bieling PJ, McIntyre RS, Mayberg HS. Differences in brain glucose metabolism between responders to CBT and venlafaxine in a 16-week randomized controlled trial. Am J Psychiatry. 2007;164:778–788. doi: 10.1176/ajp.2007.164.5.778. [DOI] [PubMed] [Google Scholar]
- Kiviniemi V, Starck T, Remes J, Long X, Nikkinen J, Haapea M, Veijola J, Moilanen I, Isohanni M, Zang YF, Tervonen O. Functional segmentation of the brain cortex using high model order group PICA. Hum Brain Mapp. 2009;30:3865–3886. doi: 10.1002/hbm.20813. [DOI] [PMC free article] [PubMed] [Google Scholar]
- Korgaonkar MS, Cooper NJ, Williams LM, Grieve SM. Mapping inter-regional connectivity of the entire cortex to characterize major depressive disorder: a whole-brain diffusion tensor imaging tractography study. Neuroreport. 2012;23:566–571. doi: 10.1097/WNR.0b013e3283546264. [DOI] [PubMed] [Google Scholar]
- Korgaonkar MS, Fornito A, Williams LM, Grieve SM. Abnormal structural networks characterize major depressive disorder: a connectome analysis. Biol Psychiatry. 2014;76:567–574. doi: 10.1016/j.biopsych.2014.02.018. [DOI] [PubMed] [Google Scholar]
- Kriegeskorte N, Simmons WK, Bellgowan PS, Baker CI. Circular analysis in systems neuroscience: the dangers of double dipping. Nat Neurosci. 2009;12:535–540. doi: 10.1038/nn.2303. [DOI] [PMC free article] [PubMed] [Google Scholar]
- Leopold DA, Murayama Y, Logothetis NK. Very slow activity fluctuations in monkey visual cortex: implications for functional brain imaging. Cereb Cortex. 2003;13:422–433. doi: 10.1093/cercor/13.4.422. [DOI] [PubMed] [Google Scholar]
- Li B, Liu L, Friston KJ, Shen H, Wang L, Zeng LL, Hu D. A treatment-resistant default mode subnetwork in major depression. Biol Psychiatry. 2013;74:48–54. doi: 10.1016/j.biopsych.2012.11.007. [DOI] [PubMed] [Google Scholar]
- Liu Z, Fukunaga M, de Zwart JA, Duyn JH. Large-scale spontaneous fluctuations and correlations in brain electrical activity observed with magnetoencephalography. Neuroimage. 2010;51:102–111. doi: 10.1016/j.neuroimage.2010.01.092. [DOI] [PMC free article] [PubMed] [Google Scholar]
- Luckhoo H, Hale JR, Stokes MG, Nobre AC, Morris PG, Brookes MJ, Woolrich MW. Inferring task-related networks using independent component analysis in magnetoencephalography. Neuroimage. 2012;62:530–541. doi: 10.1016/j.neuroimage.2012.04.046. [DOI] [PMC free article] [PubMed] [Google Scholar]
- Mayberg HS. Modulating dysfunctional limbic-cortical circuits in depression: towards development of brain-based algorithms for diagnosis and optimised treatment. Br Med Bull. 2003;65:193–207. doi: 10.1093/bmb/65.1.193. [DOI] [PubMed] [Google Scholar]
- Mayberg HS, Lewis PJ, Regenold W, Wagner HN., Jr Paralimbic hypoperfusion in unipolar depression. J Nucl Med. 1994;35:929–934. [PubMed] [Google Scholar]
- Mayberg HS, Lozano AM, Voon V, McNeely HE, Seminowicz D, Hamani C, Schwalb JM, Kennedy SH. Deep brain stimulation for treatment-resistant depression. Neuron. 2005;45:651–660. doi: 10.1016/j.neuron.2005.02.014. [DOI] [PubMed] [Google Scholar]
- Meyer MC, Janssen RJ, Van Oort ES, Beckmann CF, Barth M. The Quest for EEG Power Band Correlation with ICA Derived fMRI Resting State Networks. Front Hum Neurosci. 2013;7:315. doi: 10.3389/fnhum.2013.00315. [DOI] [PMC free article] [PubMed] [Google Scholar]
- Papadelis C, Poghosyan V, Fenwick PB, Ioannides AA. MEG's ability to localise accurately weak transient neural sources. Clin Neurophysiol. 2009;120:1958–1970. doi: 10.1016/j.clinph.2009.08.018. [DOI] [PubMed] [Google Scholar]
- Pardo JV, Sheikh SA, Schwindt GC, Lee JT, Kuskowski MA, Surerus C, Lewis SM, Abuzzahab FS, Adson DE, Rittberg BR. Chronic vagus nerve stimulation for treatment-resistant depression decreases resting ventromedial prefrontal glucose metabolism. Neuroimage. 2008;42:879–889. doi: 10.1016/j.neuroimage.2008.04.267. [DOI] [PMC free article] [PubMed] [Google Scholar]
- Pendse GV, Borsook D, Becerra L. A simple and objective method for reproducible resting state network (RSN) detection in fMRI. PLoS One. 2011;6:e27594. doi: 10.1371/journal.pone.0027594. [DOI] [PMC free article] [PubMed] [Google Scholar]
- Posner J, Hellerstein DJ, Gat I, Mechling A, Klahr K, Wang Z, McGrath PJ, Stewart JW, Peterson BS. Antidepressants normalize the default mode network in patients with dysthymia. JAMA Psychiatry. 2013;70:373–382. doi: 10.1001/jamapsychiatry.2013.455. [DOI] [PMC free article] [PubMed] [Google Scholar]
- Price JL, Drevets WC. Neurocircuitry of mood disorders. Neuropsychopharmacology. 2010;35:192–216. doi: 10.1038/npp.2009.104. [DOI] [PMC free article] [PubMed] [Google Scholar]
- Raichle ME, MacLeod AM, Snyder AZ, Powers WJ, Gusnard DA, Shulman GL. A default mode of brain function. Proc Natl Acad Sci U S A. 2001;98:676–682. doi: 10.1073/pnas.98.2.676. [DOI] [PMC free article] [PubMed] [Google Scholar]
- Remes JJ, Starck T, Nikkinen J, Ollila E, Beckmann CF, Tervonen O, Kiviniemi V, Silven O. Effects of repeatability measures on results of fMRI sICA: a study on simulated and real resting-state effects. Neuroimage. 2011;56:554–569. doi: 10.1016/j.neuroimage.2010.04.268. [DOI] [PubMed] [Google Scholar]
- Robinson SE, Vrba J. Biomag. Tohoku University Press; Sendai: 1999. Functional neuroimaging by synthetic aperture magnetometry (SAM) pp. 302–305. [Google Scholar]
- Salvadore G, Cornwell BR, Colon-Rosario V, Coppola R, Grillon C, Zarate CA, Jr, Manji HK. Increased anterior cingulate cortical activity in response to fearful faces: a neurophysiological biomarker that predicts rapid antidepressant response to ketamine. Biol Psychiatry. 2009;65:289–295. doi: 10.1016/j.biopsych.2008.08.014. [DOI] [PMC free article] [PubMed] [Google Scholar]
- Salvadore G, Cornwell BR, Sambataro F, Latov D, Colon-Rosario V, Carver F, Holroyd T, DiazGranados N, Machado-Vieira R, Grillon C, Drevets WC, Zarate CA., Jr Anterior cingulate desynchronization and functional connectivity with the amygdala during a working memory task predict rapid antidepressant response to ketamine. Neuropsychopharmacology. 2010;35:1415–1422. doi: 10.1038/npp.2010.24. [DOI] [PMC free article] [PubMed] [Google Scholar]
- Scholvinck ML, Leopold DA, Brookes MJ, Khader PH. The contribution of electrophysiology to functional connectivity mapping. Neuroimage. 2013;80:297–306. doi: 10.1016/j.neuroimage.2013.04.010. [DOI] [PMC free article] [PubMed] [Google Scholar]
- Scholvinck ML, Maier A, Ye FQ, Duyn JH, Leopold DA. Neural basis of global resting-state fMRI activity. Proc Natl Acad Sci U S A. 2010;107:10238–10243. doi: 10.1073/pnas.0913110107. [DOI] [PMC free article] [PubMed] [Google Scholar]
- Wang L, Hermens DF, Hickie IB, Lagopoulos J. A systematic review of resting-state functional-MRI studies in major depression. J Affect Disord. 2012;142:6–12. doi: 10.1016/j.jad.2012.04.013. [DOI] [PubMed] [Google Scholar]
- Wang L, Li K, Zhang QE, Zeng YW, Jin Z, Dai WJ, Su YA, Wang G, Tan YL, Yu X, Si TM. Interhemispheric functional connectivity and its relationships with clinical characteristics in major depressive disorder: a resting state fMRI study. PLoS One. 2013;8:e60191. doi: 10.1371/journal.pone.0060191. [DOI] [PMC free article] [PubMed] [Google Scholar]
- Wheland D, Pantazis D. Second order blind identification on the cerebral cortex. J Neurosci Methods. 2014;223:40–49. doi: 10.1016/j.jneumeth.2013.11.023. [DOI] [PubMed] [Google Scholar]
- Zarate CA, Jr, Singh JB, Carlson PJ, Brutsche NE, Ameli R, Luckenbaugh DA, Charney DS, Manji HK. A randomized trial of an N-methyl-D-aspartate antagonist in treatment-resistant major depression. Arch Gen Psychiatry. 2006;63:856–864. doi: 10.1001/archpsyc.63.8.856. [DOI] [PubMed] [Google Scholar]
- Zeng LL, Shen H, Liu L, Wang L, Li B, Fang P, Zhou Z, Li Y, Hu D. Identifying major depression using whole-brain functional connectivity: a multivariate pattern analysis. Brain. 2012;135:1498–1507. doi: 10.1093/brain/aws059. [DOI] [PubMed] [Google Scholar]
- Zhang J, Wang J, Wu Q, Kuang W, Huang X, He Y, Gong Q. Disrupted brain connectivity networks in drug-naive, first-episode major depressive disorder. Biol Psychiatry. 2011;70:334–342. doi: 10.1016/j.biopsych.2011.05.018. [DOI] [PubMed] [Google Scholar]
- Zuo XN, Di Martino A, Kelly C, Shehzad ZE, Gee DG, Klein DF, Castellanos FX, Biswal BB, Milham MP. The oscillating brain: complex and reliable. Neuroimage. 2010;49:1432–1445. doi: 10.1016/j.neuroimage.2009.09.037. [DOI] [PMC free article] [PubMed] [Google Scholar]
Associated Data
This section collects any data citations, data availability statements, or supplementary materials included in this article.