

Abstract
Understanding how changes in the cardiovascular system contribute to cerebral blood flow (CBF) and volume (CBV) increases is critical for interpreting hemodynamic signals. Here we investigated how systemic cardiovascular changes affect the cortical hemodynamic response during voluntary locomotion. In the mouse, voluntary locomotion drives an increase in cortical CBF and arterial CBV that is localized to the forelimb/hindlimb representation in the somatosensory cortex, as well as a diffuse venous CBV increase. To determine if the heart rate increases that accompany locomotion contribute to locomotion-induced CBV and CBF increases, we occluded heart rate increases with the muscarinic cholinergic receptor antagonist glycopyrrolate, and reduced heart rate with the β1-adrenergic receptor antagonist atenolol. We quantified the effects of these cardiovascular manipulations on CBV and CBF dynamics by comparing the hemodynamic response functions (HRF) to locomotion across these conditions. Neither the CBF HRF nor the arterial component of the CBV HRF was significantly affected by pharmacological disruption of the heart rate. In contrast, the amplitude and spatial extent of the venous component of the CBV HRF was decreased by atenolol. These results suggest that the increase in venous CBV during locomotion was partially driven by peripheral cardiovascular changes, whereas CBF and arterial CBV increases associated with locomotion reflect central processes.
Keywords: Neurovascular coupling, locomotion, imaging, frontal cortex, somatosensory cortex
Introduction
Local cerebral blood flow is controlled centrally by local neural activity via neurovascular coupling (Attwell et al., 2010; Hillman, 2014; Logothetis, 2008), but also can be affected by peripheral cardiovascular changes, which are buffered to varying degrees by cerebral autoregulation (Lassen, 1959; Lucas et al., 2010; Tzeng and Ainslie, 2013). Understanding the relative balance of central and peripheral contributions to the cerebral hemodynamic response is critical for drawing inferences from hemodynamic signals across behavioral states and comparing healthy versus diseased populations (D'esposito et al., 2003; Iadecola, 2004; 2013). However, there is an incomplete understanding of how systemic cardiovascular changes impact cerebral blood flow (CBF) and volume (CBV) increases.
Sensory evoked hemodynamic changes are typically thought of as a linear convolution of the stimulus with a hemodynamic response function (HRF) (Boynton et al., 1996; Glover, 1999; Vazquez and Noll, 1998). It is important to determine if the HRF reflects purely central processes, such as neural and/or astrocytic control (Attwell et al., 2010; Hamel, 2006; Hillman, 2014; Petzold and Murthy, 2011), or if the HRF is affected by changes in the cardiovascular system, such as increases or decreases in heart rate (Chang et al., 2009). Because CBV increases are generated by the dilation of both arteries and veins (Drew et al., 2011; Kim et al., 2007; Kim and Kim, 2011; Lee et al., 2001; Silva 2005; Zong et al., 2012), in order to interpret CBV signals it is essential to understand how cardiovascular state affects both types of vessels. Arteries and veins will be affected by blood pressure differentially, as arteries have active autoregulatory responses (Faraci and Heistad, 1990; Harder, 1984), while veins passively change their diameters in response to pressure changes (Boas et al., 2008; Buxton et al., 1998; Edvinsson et al., 1983; Mandeville et al., 1999; Zheng and Mayhew, 2009). Consistent with these observations, measurements of the responses of individual cerebral arteries and veins in anesthetized mice, where the heart rate is lowered relative to the awake animal, have shown that anesthesia completely blocked the dilation of cerebral veins to sensory stimulation that was normally present in the awake animal (Drew et al., 2011). Fluctuations in cardiovascular and respiratory processes can affect resting and sensory-evoked cerebral hemodynamic signals (Birn et al., 2009; 2008; Chang et al., 2009; Shmueli et al., 2007), and blood pressure can affect BOLD (blood-oxygen level dependent) signals (Kalisch et al., 2001; Wang et al., 2006). Imaging modalities that permit subject motion, such as near-infrared spectroscopy (NiRS) (Ferrari & Quaresima, 2012; Piper et al., 2014) may also be sensitive to cardiovascular changes accompanying movement. These results suggest that in addition to changes in blood vessel diameter evoked by central processes, changes in cardiovascular state may also contribute to the hemodynamic response.
The largest, normal physiological perturbations in the cardiovascular system take place during exercise, making exercise a natural test case for investigating the significance of cardiovascular changes in affecting cerebral hemodynamic signals. Exercise increases heart rate, cardiac output and systemic blood pressure (Mitchell, 1985; Yancey and Overton, 1993). While there is a large, but contradictory, body of literature on the effects of exercise on CBF in humans (Ogoh and Ainslie, 2009), the imaging techniques available in animal models have allowed a better understanding of the cerebral hemodynamic changes during exercise, as well as their microvascular basis. During voluntary locomotion in mice, increases in CBV and CBF are largely localized to the forelimb/hindlimb (FL/HL) representations in the primary somatosensory cortex (SI), with little change in the frontal cortex (FC) (Huo et al., 2014). The increases in CBV and CBF are linearly related to locomotion, and are well-captured by HRFs (Huo et al., 2015) similar to the one used in BOLD-based fMRI (Boynton et al., 1996; Glover, 1999). The CBV HRF can be decomposed into arterial and venous components (Huo et al., 2015; Silva et al., 2007). The locomotion-evoked arterial component of the CBV HRF is largest in the cortical FL/HL representation, while the spatial distribution of venous component of the CBV HRF is more uniform across frontal and parietal cortical surface (Huo et al., 2015). Because average neural activity and hemodynamic signals in FC decouple during locomotion (Huo et al., 2014), it is conceivable that other physiological processes, such as cardiovascular changes, contribute to locomotion-evoked CBV and CBF changes.
Here, we tested if the disruption of normal cardiovascular changes accompanying voluntary locomotion affected locomotion-evoked CBV and CBF HRFs. If pharmacological occlusion or reduction of the heart rate increases during locomotion altered the locomotion-evoked HRFs, then systemic cardiovascular processes contribute to the observed changes in CBV and CBF, and thus any evoked changes in cerebral hemodynamic signals cannot be entirely attributed to central (neural and astrocytic) processes. We blocked muscarinic acetylcholine receptors with glycopyrrolate, which increases heart rate and cardiac output (Seifert et al., 2010), elevates resting blood pressure (Hamner et al., 2012), and blocks parasympathetic outflow. In humans, glycopyrrolate can block exercise-induced CBF increases (Seifert et al., 2010) (but see (Rokamp et al., 2014)). We blocked β1-adrenergic receptors with atenolol, which reduces heart rate and blood pressure (Fitzgerald et al., 1978; Joyner et al., 1986) and decreases cardiovascular output (Joho et al., 2006). Neither glycopyrrolate nor atenolol crosses the blood-brain barrier (Franko et al., 1962; Neil Dwyer et al., 2012). Using laser Doppler flowmetry (LDF) and intrinsic optical signal (IOS) imaging, we found that the CBF HRF and the arterial component of the CBV HRF to locomotion were not significantly affected by these pharmacological disruptions of normal cardiovascular fluctuations. In contrast, the amplitude of the venous component of the locomotion-evoked CBV HRF was significantly decreased under the influence of atenolol. Our findings indicate that during normal behavior, a substantial amount of the venous component of the CBV HRF could be driven by cardiovascular changes.
Methods
Animals
All experimental procedures were performed in accordance with the Institutional Animal Care and Use Committee of the Pennsylvania State University, University Park and NIH guidelines. A total of 13 male C57BL/6J mice (Jackson Laboratory) were used. Mice were housed individually and kept on a 12-hour light/dark cycle.
Surgery
Mice were 4-10 months old (23 – 33g) at the time of surgery. All surgical procedures were performed under isoflurane anesthesia. Mice were implanted with head bolts, and either bilateral or unilateral reinforced thinned-skull windows for IOS and LDF measurements. Detailed surgical procedures for creating reinforced thinned-skull windows have been described previously (Drew et al., 2010; Huo et al., 2014; Huo et al. 2015; Shih et al., 2012). We attached a custom-machined titanium head bolt to the dorsal aspect of the exposed skull, posterior to lambda. We then installed chronic, coverslip-reinforced thinned-skull windows spanning both frontal and parietal cortices, bilaterally in 10 mice, and unilaterally in 3 others. Black dental acrylic was used to minimize reflected light. In the three mice with unilateral thinned-skull windows, self-tapping 3/32” #000 screws were placed into the skull contralateral to the windows over the frontal (+2.0 mm A-P and 1.0 mm M-L from bregma) and parietal (−0.5 mm A-P and 2.0 mm M-L from bregma) cortices for use as electrocortogram (ECoG) electrodes. The screws were connected via stainless steel wires (A-M Systems, #793600) to an electrical connector for differential ECoG measurements.
Experiments
Mice were head-fixed on top of a spherical treadmill (60-mm diameter) covered with anti-slip tape. The treadmill had one rotational degree of freedom. The animal’s velocity was recorded using an optical rotary encoder (Gao and Drew, 2014) (US Digital, E7PD-720-118) attached to the axle of the treadmill. All data were collected using custom-written software in LabView 8.6 (National Instruments). For CBV measurements (n=13), four 530 nm LEDs (Thorlabs, M530L2-C1) (Bouchard et al., 2009), with ±10 nm filters (Thorlabs, FB530-10), uniformly illuminated the area of the thinned skull window(s). Because 530 nm is an isobestic point of hemoglobin (Prahl, 2006), CBV increases due to arterial and venous dilations cause a decrease in reflectance (Huo et al., 2015). Intrinsic images (256×256 pixels, 27-43 μm/pixel) were captured using a CCD camera (Dalsa, Pantera 1M60)(Huo et al., 2014, 2015) at an acquisition frequency of 30 frames/s (for ~ 3 minutes) for heart rate measurements (Fig. 1), or at 3 frames/s (for ~ 33 minutes) for locomotion-driven CBV HRF measurements. A camera (Microsoft, LifeCam Cinema) was used to monitor the animal’s behavior. In this experimental setup, instrumentation noise in measures of reflectance has a root-mean square (RMS) amplitude of ~0.01% (Huo et al. 2014), which is ~100× smaller than the spontaneous ongoing fluctuations in hemodynamic signals that are found in awake rodents (Huo et al. 2014; 2015) and ~1000× smaller than the locomotion evoked signals measured here (Huo et al. 2014; 2015). For CBF measurements, a laser Doppler flowmeter (LDF) (Oxford Optronix, OxyFlo) probe was positioned at a 30-degree angle over the frontal or parietal cortex of the left hemisphere (n=7) of animals with bilateral thinned-skull windows. CBF was only measured in one location per trial. For simultaneous LDF and IOS measurements, a 530 ± 5 nm filter was attached to the CCD camera to block light emitted by the LDF probe. Because the LDF probe partially obscured the window over the left hemisphere, on trials where CBF measurements were made, only the right hemisphere was included in calculating the spatial spread of the arterial and venous signals. ECoG was recorded differentially from screws in the frontal and parietal cortex, amplified (DAM80, WPI Inc.), and band-pass filtered between 0.1 Hz and 200 Hz (Brownlee Precision, Model 440). The measured CBF and CBV signals report fractional, not absolute, changes in cerebral blood flow and volume, respectively.
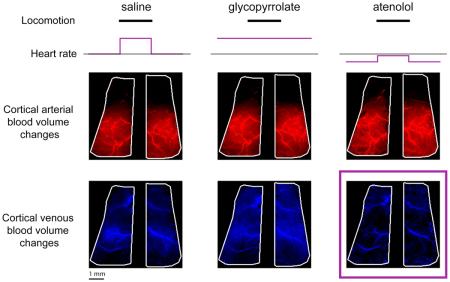
Figure 1. Effects of pharmacological perturbations on heart rate, cortical activity, and behavior.

(A) Example trials showing the spectrograms of the IOS and ECoG after injections of saline, glycopyrrolate, or atenolol, respectively. Locomotion events are denoted by gray dots (top row). In the spectrograms of IOS (middle row), the heart rate-related oscillation is visible as the frequency corresponding to the peak power in the 5-15 Hz band (purple line). In the spectrograms of ECoG (bottom row), locomotion-related increases in gamma-band power (defined as 40 – 100 Hz, excluding 55 – 65 Hz) are visible. Superimposed on the ECoG spectrogram is the gamma-band power gain (in dB APγ, cyan line, right axis). (B) At rest (left) and during locomotion (right), the mean heart rate was significantly affected by the injection of glycopyrrolate or atenolol compared to saline injection. After saline or atenolol injection, locomotion significantly increased heart rate during locomotion compared to at rest. Glycopyrrolate increased heart rate such that there was no significant difference between the resting heart rate and heart rate during locomotion. Pairwise two-sample t-tests: N.S., not significant; *p<0.05; ** p< 0.01; *** p<0.001. (C) Gamma-band power gain during locomotion, as compared to at rest (APγ) was unaffected by glycopyrrolate or atenolol. (D) Fraction of time spent locomoting after the injection of saline, glycopyrrolate, or atenolol were not significantly different. One-way ANOVA: N.S., not significant.
Sterile saline (Teknova), glycopyrrolate (50 μg/kg in saline, Sigma-Aldrich), and atenolol (2 mg/kg in saline, Sigma-Aldrich) were intraperitoneally injected into all of the 13 mice. The animal was allowed to acclimate to the treadmill for at least 30 minutes prior to the injection. Only one injection was made for each animal per day. The interval between any two consecutive injections was at least 24 hours. Injections were interleaved such that no two consecutive injections were the same drug and the order of the drug/saline injections was randomized such that no two animals received the injections in the same order. The heart rate was monitored from the IOS immediately before and after injection. Heart rate changes were used as a marker of drug efficacy. We found that the changes in heart rate induced by glycopyrrolate and atenolol lasted for more than 40 minutes and 1 hour, respectively (data not shown). Based on these measurements, we recorded the IOS at 30 frames/s for 3 – 7 minutes after drug/saline injection to verify that the drug had an effect, and then recorded the IOS for ~33 minutes at 3 frames/s. These 33-minute trials were used to fit the locomotion-evoked CBV and/or CBF HRFs under the influence of either drug or saline. In each mouse, 1 to 4 trials were taken under each condition. In one mouse, there was no detectable increase in CBF in the frontal cortex (FC) during locomotion after glycopyrrolate injection. This animal was excluded from the glycopyrrloate CBF HRF estimations.
At the conclusion of experiments, mice were deeply anesthetized and transcardially perfused. Tangential slices of the cortex were processed for cytochrome oxidase staining (Drew and Feldman, 2007) to reconstruct the forelimb (FL) and hindlimb (HL) representations in the primary sensory cortex (SI). We aligned the histological images with the IOS images using a combination of vascular morphology and fiduciary marks (Drew and Feldman, 2009; Huo et al., 2014; Huo et al. 2015). In each hemisphere, a polygon of interest enclosing the FL/HL representation was selected based on cytochrome oxidase staining (Fig. 5) (Huo et al., 2014; Huo et al. 2015). One animal with a unilateral reinforced thinned-skull window, whose FL/HL representation we were not able to reconstruct histologically, was excluded from IOS analyses that required identification of the FL/HL region. The position of the LDF probe was histologically verified to be within the FL/HL region for parietal cortex measurements.
Figure 5. Pharmacological manipulations of locomotion-induced heart rate changes did not affect the arterial component of the CBV HRF.

(A) Images showing the spatial variation in magnitudes of the fitted arterial components, ai, of the CBV HRF across the dorsal cortex after injections in an example mouse. Brighter red indicates larger magnitude of the fitted arterial component. Window extents are outlined in white. Yellow polygons denote the histologically determined FL/HL area in SI. Left and right vertical plots show the average fitted arterial response ai along the rostral-caudal axis in the left and right hemispheres, respectively. Bottom horizontal plots show average arterial responses ai along the medial-lateral axis of each hemisphere. Black lines show averages of ai after saline injection, red lines show average ai after glycopyrrolate or atenolol injection. Scale bar: 1 mm. (B) Within SI FL/HL areas, mean pixel-wise regression coefficients of the amplitudes of arterial responses ai after drug injection against saline injection for the same animal. A regression coefficient of one implies no change relative to saline injection (n=12 mice, t-tests compared to unity). (C) The ratio between the arterial active area after glycopyrrolate or atenolol injection, Idrug, and the arterial activated area after saline injection, Isaline, showing no significant differences between the spatial spread of the arterial response across conditions. A ratio of one implies no change in the activated area. The height of the bar plot shows the mean of the ratio Idrug/Isaline (n=13 mice, t-tests compared to unity).
Data analysis
All analyses were performed in Matlab (MathWorks). The velocity from the optical rotary encoder was binarized into locomotion events and downsampled to the IOS frame rate (Huo et al., 2015). For each animal, a baseline IOS image was calculated for each day of imaging as the average during a ~10-s period of rest. The baseline, R0, was taken from a time period after the animal had been on the treadmill for >30 minutes, but before any injection was made. The baseline period was chosen such that it was not preceded by a long locomotion bout (Huo et al., 2015). IOS images from all trials within the same day were normalized against this baseline. The fractional change of reflectance ΔR/R0 was calculated for each pixel in the IOS image as (R-R0)/R0. To monitor heart rate, we calcuated the multi-taper power spectrogram of the spatial average of ΔR/R0 across the entire window using the Chronux toolbox (Mitra and Bokil, 2008), with a 3.33-s moving window at steps of 1 s and frequency resolution of 0.23 Hz. The heart rate in each time bin was determined by finding the peak frequency within the 5-15 Hz band. LDF signals measuring CBF were down-sampled to 3 Hz by averaging within each 0.33-s time bin. Similar to the IOS baseline, the baseline CBF, Q0, was determined as the average CBF, Q, over a period of ~10 s when the animal was stationary and no visible behavior was observed, and prior to any injection. Only one baseline per day was used for all the trials on a given day. The fractional change of CBF, ΔQ/Q0, was given by: (Q-Q0)/Q0. We calculated the power spectrogram of ECoG data using a sliding 1-s window, with a step size of 0.3 s, and frequency resolution of 0.9 Hz. The power gain was calculated by dividing the instantaneous power spectrum by the baseline power spectrum. The baseline ECoG power spectrum was averaged over a manually selected ~10-s period when the animal was stationary. The baseline was taken during a time period after the animal had been on the treadmill for >30 minutes, before any injection was made, and when the heart rate was within the normal resting heart rate range. The power gain was calculated by dividing the instantaneous power spectrum by the baseline power spectrum. The gamma-band power gain, APγ, was the average power gain within gamma-band (40 – 100 Hz, excluding 55 – 65 Hz) in decibels (dB).
To compare the effects of saline, glycopyrrolate and atenolol on locomotion-evoked CBV and CBF HRFs, we quantified the CBV-related ΔR/R0 and CBF-related ΔQ/Q0 using a linear convolution model (Boynton et al., 1996; Huo et al., 2015; Silva, 2005) with binarized locomotion events as inputs (Huo et al., 2015). This model is schematically illustrated in Figure 2. This simple model accurately captured the essential dynamics of individual vessels under normal physiological conditions, and allowed us to visualize the differences in the spatial spread of arterial and venous blood volume responses (Huo et al., 2015). The CBV HRF at each pixel was fitted by the sum of two decaying exponentials with zero delay: a fast (arterial) component with a time constant of 4 s (ai), and a slow (venous) component with a time constant of 40 s, (vi), and a constant (DC) term. The DC term accounted for any trial-to-trial fluctuations in baseline. Fitted values of ai and vi for each pixel within the same animal and condition were averaged across trials after registration of the IOS images. It should be noted that while direct measurements of venous diameters in awake mice have shown that the venous diameters return to baseline over tens of seconds after stimulation (Drew et al., 2011; Gao and Drew 2014; Huo et al., 2015), there is evidence that the dynamics of veins are faster in humans (Dechent et al., 2011; Hua et al., 2011; van Zij et al., 2012). Because previous work has shown that fitted HRF parameters were very stable across multiple measurements separated by days to weeks (Huo et al., 2015), we averaged across trials to reduce the variability of the HRF estimates.
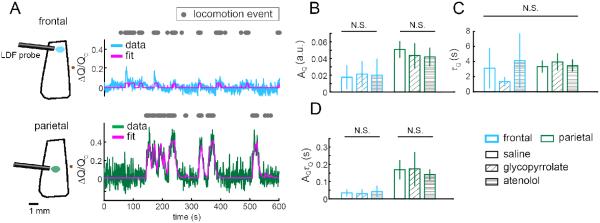
Figure 2. Linear model reliably quantifies CBV and CBF responses to locomotion after drug or saline injections.

(A) Left: Schematic illustrating the linear model of the CBV HRF in response to locomotion. The fractional change in the IOS, ΔR/R0, which mirrors changes in CBV, is composed of an arterial component (red), which is localized to the FL/HL area of SI, and a venous component (blue), which is more diffuse. For clarity, the DC component is not shown. Middle: A single locomotion event (top), or impulse, drives a slight change in the arterial component in the frontal cortex (FC, center, red), a large and brief arterial CBV increase in the FL/HL area (bottom, red), and small increase in venous CBV in both regions (blue). Right: A sustained locomotion bout saturates the arterial CBV increases (red), and drives a substantial venous CBV increase (blue) in both FC (center) and FL/HL area (bottom), with the venous CBV increase in the FL/HL area being somewhat larger. The sum of the arterial and venous components is shown in magenta. (B) Schematic illustrating the CBF HRF and dynamics in response to locomotion. Left: LDF measured CBF within a small area in the FC (blue) or FL/HL area (green). Middle: In response to a single locomotion event, the amplitude of the CBF HRF in FC (center row) was smaller than in the FL/HL area (bottom row). Right: Similarly, in response to sustained locomotion, the HRF was substantially smaller in FC than in the FL/HL area, mimicking the arterial component of CBV response in A. (C) Comparison of Pearson’s correlation coefficient (r) between the CBV model fitting and measured ΔR/R0 for all the pixels in the FL/HL area after saline, glycopyrrolate, and atenolol injections. There was no significant difference in the fitting quality between the saline and drug injected trials, showing the validity of the CBV model across the different cardiovascular conditions. n=12 mice. (D) Comparison of Pearson’s correlation coefficient between the CBF fitted with the model and measured ΔQ/Q0 in FC (blue boxes) or FL/HL area (green boxes) after saline, glycopyrrolate, and atenolol injections, demonstrating that the HRF model was valid across different conditions. n=7 mice, except for frontal cortex after glycopyrrolate injection, where n=6 mice.
The root-mean-square (RMS) of difference between the fit and the CBV data, averaged over the FL/HL representation, was calculated for every animal after each injection. The ‘rest state’ was defined as when the animal was not moving, where the absolute value of the change in the fit was <1×10⁻⁶, that is, when the fitted response was very close to constant. All other periods were defined as the locomotion state for RMS difference comparisons.
The CBF HRF was characterized as a decaying exponential with two free parameters, the amplitude, AQ, and the time constant; τQ (Huo et al., 2015). The total change of ΔQ/Q0 following a locomotion event was the integrated area of the CBF HRF, AQτQ. We fit AQ and τQ to minimize the mean-squared error between the model-estimated ΔQ/Q0 and the actual measurement. We fit the CBF with a single time constant for two reasons. First, direct two-photon microscopy measurements of blood velocity through capillaries in awake mice have shown that flow increases and decreases rapidly with the onset and offset of stimulation, closely tracking arterial diameter response to the same stimulus (Drew et al., 2011). Thus, we would expect under normal physiological conditions that the change in CBF should track arterial dilation, which have time constants of a few seconds (Huo et al., 2015). Secondly, a single exponential kernel matches the CBF dynamics very well. If the CBF response had similar dynamics as the CBV response, that is a mixture of fast and slow processes, the fit by the single time constant would yield an intermediate time constant between the arterial and venous time constants. Our CBF HRF fits consistently give time constants very close to those of the arterial dynamics (Huo et al., 2015), matching the observed response (Fig. 3), and indicating that locomotion-induced CBF increases are best fit with a single time constant.
Figure 3. Locomotion-induced changes in CBF in the frontal cortex and FL/HL representation were unaffected by pharmacological manipulations of heart rate.
(A) Example trials showing locomotion-evoked increases in CBF in the frontal cortex (FC, blue line) and FL/HL representation (green line) of somatosensory cortex, and their respective fits with the CBF HRF model (magenta line). The area sampled by the LDF probe is illustrated as an oval in either FC (blue) or FL/HL area (green). Bregma is denoted by a brown dot. Using locomotion events (gray dots) as the stimulus, the model well fit the observed changes of CBF (r = 0.50 in FC; r = 0.85 in FL/HL area). (B-D) Comparing fitted parameters of the CBF HRF, including the amplitude AQ (B), the time constant τQ (C), and integrated response, AQτQ (D), in FC (blue boxes) and FL/HL area (green boxes) after saline, glycopyrrolate, or atenolol injection. n=7 mice for all measures, except for FC after glycopyrrolate injection, where n=6.
To quantify the effects of different drugs, we compared averages using one-way ANOVA for comparisons across all injections, and multi-way ANOVA for comparison between injections in addition to other conditions. Two-sample t-tests were used for between-injection comparisons. We used the modified Bonferroni method to correct for all multiple comparisons. To compare the spatial extent of the arterial and venous CBV changes after drug injections, we regressed the arterial or venous amplitudes of CBV HRF (ai or vi) of all pixels within the FL/HL area after drug injection against the fitted ai or vi of the same pixels after saline injection, fixing the intercept at the origin. A regression coefficient differing from unity meant the drug had altered the overall amplitude of the arterial and/or venous component of the hemodynamic response to locomotion. The spatial spread of the active arterial or venous responses was defined as the area of pixels within the window with ai or vi greater than half of the 99-percentile of the peak response.
All reported numbers are mean +/- standard deviation unless otherwise indicated. Statistical power was computed post hoc using G*power (Faul et al., 2007)
Results
Glycopyrrolate and atenolol affect heart rate, but did not detectably alter cortical neural activity or behavior
We first validated that glycopyrrolate and atenolol altered heart rate, but not neural activity or behavior. We did this to establish that any effects that they had on relative changes in CBF and CBV were not due to changes in neural activity. Using high-speed (30 frames/s) (Bouchard et al., 2009; Chen et al., 2011; Huo et al., 2015) IOS imaging of head-fixed mice voluntarily moving on a spherical treadmill, we measured heart rates (Fig. 1A) during voluntary locomotion after the injection of saline, glycopyrrolate, or atenolol. After saline injection, the heart rate was 9.7±1.2 Hz at rest (n=13). Glycopyrrolate significantly increased resting heart rate to 11.1±0.8 Hz (t-test: p=0.0011), while atenolol significantly decreased the resting heart rate to 7.4±0.8 Hz (t-test: p=1.5×10⁻⁵). During locomotion in saline injected mice, heart rates increased to 10.5±0.8 Hz. Glycopyrrolate increased heart rate during locomotion to 11.4±0.5 Hz (t-test: p=0.0024), while atenolol decreased the heart rate to 8.4±0.7 Hz (t-test: p=4.3×10⁻⁷), compared to saline injection (Fig. 1B). Glycopyrrolate raised resting heart rate such that heart rate during locomotion was not significantly higher than at rest (t-test: p=0.22, power = 0.89).
To test if increases in neural activity accompanying locomotion (Huo et al., 2014; Niell and Stryker, 2010; Paukert et al., 2014; Polack et al., 2013) were affected by glycopyrrolate or atenolol, we quantified the locomotion-driven gamma-band power gain compared to rest, APγ, in the ECoG signal. Increases in gamma-band power are correlated with increases in blood flow (Logothetis et al., 2001; Niessing et al., 2005; Siero et al., 2013). The ECoG was recorded differentially from screws in the frontal and parietal cortex, so it will reflect the neural activity over the entire hemisphere. The gain in gamma-band power during locomotion, APγ was significantly greater than zero after saline injection (1.31±0.39 dB, n=3, t-test: p=0.03) (Fig. 1A). Neither glycopyrrolate (1.54±0.31 dB) nor atenolol (1.58±0.39 dB) significantly altered APγ compared to saline injection (one-way ANOVA: F(2,6)=0.43, p=0.67) (Fig. 1C), showing that these drugs did not detectably alter cortical neural activity. Finally, the fraction of time spent locomoting was not affected by drug injections (15%±8.2% for saline, 16%±8.8% for glycopyrrolate, 17%±8.2% for atenolol; n=13, one-way ANOVA: F(2,36) =0.39, p=0.68) (Fig. 1D). Neither drug produced any visible gross alteration of behavior (grooming, movement, posture, etc.) in the mice. Consistent with their inability to cross the blood-brain barrier (Franko et al., 1962; Neil Dwyer et al., 2012), neither glycopyrrolate nor atenolol detectably altered the cortical neural activity evoked by voluntary locomotion, or the fraction of time the mouse spent locomoting, but they did cause significant changes in heart rate at rest and/or during locomotion.
Changes in locomotion-driven CBV and CBF were reliably quantified by a linear model after glycopyrrolate or atenolol injection
We then asked if alterations of the normal locomotion-driven heart rate increases by glycopyrrolate or atenolol would affect the spatial pattern and amplitudes of relative changes in CBV and CBF in response to voluntary locomotion. Like other forms of stimulation, voluntary locomotion drives a cerebral hemodynamic response that can be quantitatively described as the convolution of the stimulus (in this case locomotion) with a hemodynamic response function (HRF), or impulse response. If the arterial, venous, and/or flow changes accompanying locomotion are partially or entirely driven by cardiovascular processes, then disrupting the heart rate increases which accompany locomotion should cause changes in the CBV and/or CBF HRFs.
Because of the large changes in heart rate induced by glycopyrrolate and atenolol, we first validated that these HRF models accurately captured the CBV and CBF responses in animals injected with glycopyrrolate or atenolol. We quantified the fitting quality as the Pearson’s correlation coefficient (r) between the model’s estimates and the actual measurement. The average r of CBV HRF fitting within the histologically defined FL/HL area was calculated for each animal, under each of the three conditions (saline, glycopyrrolate and atenolol injections) (Fig. 2C). We found that the correlation between the model-estimated ΔR/R0 and the measured responses after saline injection (r = 0.63±0.18) were not significantly different from those obtained following glycopyrrolate (r=0.73±0.11; n=12, t-test: p=0.26), or atenolol injections (r=0.54±0.13; n=12, t-test: p=0.16) (Fig. 2C). For CBF HRFs, we calculated r values of the model fits for the frontal cortex (FC) (Fig. 2D, cyan) and the FL/HL area (Fig. 2D, green) separately. In FC, the r values were 0.38±0.19 after saline injection (n=7), 0.40±0.23 after glycopyrrolate injection (n=6), and 0.37±0.26 after atenolol injection (n=7). Neither glycopyrrolate nor atenolol caused significant changes in the fitting quality of CBF HRF for FC (one-way ANOVA: F(2,17)=0.02, p=0.98). Similarly, in FL/HL area, the r values were 0.70±0.13, 0.79±0.10, and 0.64±0.13 after saline, glycopyrrolate, and atenolol injections, respectively, which were not significantly different from each other (one-way ANOVA: F(2,18)=2.8, p=0.18). These results show that the CBV and CBF HRF models captured the locomotion-driven hemodynamic responses even with pharmacological disruptions of the cardiovascular dynamics. In subsequent analyses, we used the fit parameters of the HRFs to evaluate the contribution of peripheral cardiovascular processes to voluntary locomotion-induced changes in CBV and CBF.
We also compared the root-mean squared (RMS) noise between our fit and the actual response in the anatomically defined FL/HL representation across behavioral conditions. Changes in RMS difference between rest and locomotion will reflect the sum of error in the fit and physiological noise amplitudes. If the fit were doing a good job in capturing the hemodynamic response to locomotion, and physiological noise is stationary, the RMS noise between the fit and data should be comparable across behavioral states. However, that amplitude and frequency of physiological noise (spontaneous oscillations of arterial diameters) depends on blood pressure and modulation, with the oscillations in arterial diameter typically, but not always, increasing with pressure (Achakri et al, 1995; Fairfax et al, 2014; Gustafsson et al, 1994; Osol and Halpern, 1988; Oude Vrielink el al, 1989). This means that the physiological noise will not be stationary across behavioral or pharmacological conditions which involve changes in blood pressure. This non-stationary in physiological noise will affect the RMS difference between the fit and data independent of fit quality. We found that there was no significant difference between the RMS differences during rest and locomotion after saline or glycopyrrolate injections (saline rest: 0.018±0.011, locomotion 0.015±0.002; two-sample t-test: p=0.30; glycopyrrolate rest: 0.017±0.009, locomotion: 0.014±0.002; two-sample t-test: p=0.55). After atenolol injection, the RMS difference between the fit and data was larger during locomotion (0.019±0.002) than at rest (0.013±0.005; two-sample t-test: p=0.006). However, there was no significant difference between the saline rest RMS and the atenolol locomotion (F(1,21)=0.06, p=0.80), indicating that this difference was likely due to atenolol decreasing the physiological noise during rest, consistent with atenolol’s blood pressure reducing effects and the fact that the resting heart rate in the saline condition was close to, but slightly higher than the heart rate during locomotion under atenolol (Figure 1). There was no significant difference of RMS of fitting error across behavioural states, or across different injections (two-way ANOVA: behavioural state: F(1,65)=0.01, p=0.92; injections: F(2,65)=0.16, p=0.85). One should bear in mind that dichotomizing continuous data (in our case separating the RMS noise out by locomotion and non-locomotion conditions) can cause statistical artifacts, both false positive and false negatives (MacCallum et al, 2002), so care is needed in interpreting the RMS differences across conditions. However under all conditions, RMS error between the fit and the data was substantially smaller than the locomotion evoked responses (<2% vs. ~10%, Figure 4), consistent with the correlation between fit and data not being statistically different across conditions (Figure 2).
Figure 4. Arterial and venous components of CBV response to locomotion after injections of saline, glycopyrrolate, or atenolol.

(A) Example trial starting 20 minutes after saline injection showing locomotion-induced changes in reflectance and model fit. The black line shows the fractional change of IOS, ΔR/R0, averaged within a ~0.1mm2 area within the parietal cortex (small magenta box in C). Grey dots show locomotion events. The magenta line shows the fitted ΔR/R0 changes. The red line shows the arterial component of the fitted ΔR/R0 response, and the blue line shows the venous component of the fitted ΔR/R0 response, both from the model illustrated in Fig. 2. For clarity, the DC component is not shown. The r between the fitted response and the measured ΔR/R0 was 0.84. (B) The HRF model used in (A). The red line is the arterial component of the HRF, and the blue line is the venous component of the HRF. The magenta line shows the total HRF, which is the sum of the arterial and venous components. (C) Correlation coefficients (r) of all pixels between the measured ΔR/R0 response and the fitted data. The average r over both windows was 0.65. (D) Example trial starting 20 minutes after glycopyrrolate injection showing locomotion-induced changes in reflectance and model fit. The ΔR/R0 was the average over the same area as in (A), enclosed by the magenta box in (F). The average r was 0.89 within this area. (E) Arterial (red) and venous (blue) components of the HRF (magenta) used to fit the data in (D). (F) Map of values of r for all pixels within the windows under glycopyrrolate. The average r over the entire window was 0.66. (G) Example trial showing locomotion-induced changes in reflectance and model fit starting 20 minutes after atenolol injection, averaged over the same area as in (A), shown as the enclosed area by the magenta box in (I). The average r was 0.71 within this area. (H) HRFs of the fitted ΔR/R0 and its arterial and venous components. (I) Map of r values for all pixels within the windows under atenolol. The r averaged over both windows was 0.48.
CBF increases following voluntary locomotion were not detectably affected by pharmacological disruptions of the heart rate
We tested whether cardiovascular perturbations would affect the amplitude and regional localization of CBF increases associated with voluntary locomotion. If either glycopyrrolate or atenolol caused changes in locomotion-induced CBF, this would imply that CBF is at least partially regulated by peripheral cardiovascular factors. Conversely, if there were no difference in CBF dynamics evoked by locomotion between the drug conditions and saline, this would imply that CBF is controlled by central factors. The time constant of the CBF HRF fit under different pharmacological conditions was compared to determine if any of the drug injections altered the temporal dynamics of locomotion-induced flow increases.
Voluntary locomotion after saline injections drove large increases in CBF in the FL/HL area, but negligible CBF increases in FC (Fig. 3A). In both cortical regions, compared with saline, the amplitude of the CBF HRF, AQ, was not significantly affected by glycopyrrolate or atenolol injection (two-way ANOVA: F(2,37)=1.37, p=0.27) (Fig. 3B). Specifically within FC, AQ was 0.018±0.015 for saline injection (n=7), 0.021±0.016 for glycopyrrolate (n=6), and 0.020±0.020 for atenolol (n=7) (one-way ANOVA: F(2,17)=0.08, p=0.92). Within FL/HL area, AQ was 0.051±0.010, 0.044±0.015, and 0.042±0.011 for saline, glycopyrrolate, and atenolol injections, respectively (n=7, one-way ANOVA: F(2,18)=1.01, p=0.76). The time constant of the CBF HRF, τQ, was not significantly different in either cortical area after any injection (two-way ANOVA: F(2,37)=0.55, p=0.58) (Fig. 3C). Specifically, within FC, τQ was 3.11±2.70 s after saline injection (n=7), 1.32±0.62 s after glycopyrrolate injection (n=6), and 4.10±3.64 s after atenolol injection (n=7), not significantly different from each other (one-way ANOVA: F(2,17)=1.72, p=0.42), though the locomotion-induced increase in CBF was miniscule in FC. Within the FL/HL area, τQ was 3.33±0.82 s after saline injection, 3.93±1.17 s after glycopyrrolate injection, and 3.47±0.83 s after atenolol injection, not significantly different from each other (n=7, one-way ANOVA: F(2,18)=0.77, p=0.48). Finally, the integrated CBF increase, AQτQ, was not significantly different from saline injection after glycopyrrolate or atenolol injection in either cortical region (two-way ANOVA: F(2,37)=2.63, p=0.09) (Fig. 3D). Specifically, within FC, AQτQ was 0.03±0.02 s, 0.03±0.03 s, and 0.04±0.03 s after saline, glycopyrrolate and atenolol injections, respectively (one-way ANOVA: F(2,17)=0.35, p=0.71); while within the FL/HL area, AQτQ was 0.17±0.06 s, 0.17±0.10 s, and 0.14±0.03 s after saline, glycopyrrolate, and atenolol injections, respectively (one-way ANOVA: F(2,18)=0.47, p=1). These results show that the large cardiovascular changes caused by glycopyrrolate and atenolol were not accompanied by detectable changes in the locomotion-evoked CBF HRFs, consistent with the hypothesis that CBF increases associated with locomotion were centrally controlled.
Locomotion-driven arterial CBV responses were not detectably affected by pharmacological disruptions of the heart rate
We tested whether the disruption of normal cardiovascular dynamics associated with locomotion would alter the amplitude or spatial extent of the locomotion-evoked CBV HRF (Huo et al., 2015) (Fig. 2A). Examples of CBV time courses during voluntary locomotion after saline, glycopyrrolate or atenolol injections are shown in Figure 4.
We first determined if the arterial component of the CBV HRF was affected by cardiovascular manipulations. The amplitude of the fitted arterial component of the CBV HRF for each pixel ai in an example mouse is shown in Figure 5A. The network of large arteries on the cortical surface was clearly visible, due to the large magnitudes of their fitted arterial component, verifying that the fitting procedure captured the arterial dynamics. To show systematic spatial variations in the amplitude of the arterial CBV response to locomotion, we calculated the average of ai across the medial-lateral axis within each hemisphere, and the rostral-caudal average of ai in both hemispheres. After saline injection, the average magnitude of ai was largest within the parietal cortex, but small or negative in the frontal cortex, consistent with previous measurements made under normal physiological conditions (Huo et al., 2015). A very similar spatial distribution and amplitude in the fitted values of ai were seen after glycopyrrolate or atenolol injection, indicating that these drugs had no effect on the arterial component of the CBV HRF. To quantify any drug effects on the amplitude of the arterial component of the CBV HRF in the FL/HL area, we performed pixel-wise regression between the values of ai obtained under saline and drug-injected conditions within the same mouse. We restricted this quantification of fit amplitudes to the anatomically defined FL/HL representation because the FL/HL representation responds strongly to locomotion, as measured by increases in CBF and CBV. This will ensure that the correlation between the fits and the hemodynamic response was high, ensuring an accurate quantification of the individual components of the hemodynamic response. We found that the coefficient of regression against the saline control was not significantly different from unity for glycopyrrolate (1.04±0.35, t-test: p=0.70) or atenolol (0.93±0.25, t-test: p=0.70) injections (n=12) (Fig. 5B). This lack of a difference indicated that neither drug significantly affected the arterial component of the CBV HRF. To quantify the spatial spread of arterial component of the CBV response, we defined the arterial activated area as the area with magnitudes of ai greater than half of the 99%tile response (Huo et al., 2014). We first evaluated the arterial activated area changes over the entire window after glycopyrrolate or atenolol injection by taking the ratio of the activated area after drug injection to the activated area after saline injection within the same animal. We used this metric because window size and position varied across animals. This ratio was not significantly different from 1 for either glycopyrrolate (0.98±0.22, t-test: p=0.78; n=13) or atenolol (1.11±0.30, t-test: p=0.41; n=13) (Fig. 5C). When we restricted the activated area analysis to the pixels in the anatomically-defined FL/HL area, the arterial activated area was not significantly different from saline controls in the glycopyrrolate. (0.89±0.18, t-test: p=0.06; n=12), or atenolol (1.03±0.24, t-test: p=0.63; n=12) conditions. These results showed that the amplitude and spatial distribution of the arterial component of the CBV HRF were not detectably affected by cardiovascular manipulations.
Venous CBV increases accompanying locomotion were significantly attenuated by atenolol, but not by glycopyrrolate
We then investigated the effects of pharmacologically induced cardiovascular perturbations on the venous component of the CBV HRF. An example of the venous component fit amplitudes for a saline injected mouse is shown in Figure 6A. In contrast to arterial component of the CBV HRF, the distribution of the pixels with large magnitudes of venous component, vi, was spatially diffuse, with large draining veins clearly visible across the entire cortex (Fig. 6A, left). The amplitudes and spatial patterns of the vi were similar between glycopyrrolate and saline injection conditions (Fig. 6A, middle). However, the spatial distribution and magnitudes of vi after atenolol injection were noticeably decreased compared to saline controls (Fig. 6A, right).
Figure 6. Atenolol decreased the magnitude and spatial extent of the venous component of the CBV HRF.

(A) Images showing the spatial variation in amplitudes of the fitted venous components, vi, of the CBV HRF across the dorsal cortex after injections in an example mouse. Brighter blue indicates larger magnitudes of vi. Left and right vertical plots show the vi averaged along the rostral-caudal axis of the left and right hemispheres, respectively. Horizontal plot show the average vi along the medial-lateral axis of each hemisphere. Black lines show the average vi after saline injection, while blue lines show average vi after glycopyrrolate or atenolol injection. Scale bar: 1 mm. (B) Within SI FL/HL areas, mean pixel-wise regression coefficients of the amplitudes of vi after drug injection against saline injection for the same animal. Atenolol, but not glycopyrrolate, significantly decreased the amplitudes of the venous component of the CBV HRF in the FL/HL representation (n=12 mice, t-tests compared to unity) *, p<0.05. (C) The mean ratio between the venous activated area after glycopyrrolate or atenolol injection, Idrug, and the venous activated area after saline injection, Isaline shows a decrease in the venous activated area after injection of atenolol (n=13 mice, t-tests compared to unity) *, p<0.05.
To quantify the effects of glycopyrrolate and atenolol on the venous component of CBV HRF, we regressed the fitted values of vi after glycopyrrolate or atenolol injection against the fitted vi after saline injection for pixels in the SI FL/HL representation. As with the arterial component of the response, we restricted this quantification to the anatomically defined FL/HL representation to ensure that only pixels that were robustly driven by locomotion were used to quantify the venous response. We found that atenolol significantly decreased the magnitude of the venous component of the CBV HRF within the FL/HL area (0.44±0.68, t-test: p=0.033; n=12; power=0.85), but glycopyrrolate did not (0.71±0.59, t-test: p=0.12; n=12) (Fig. 6B). We also quantified the effects of glycopyrrolate and atenolol on the spatial spread of the venous component of the CBV HRF induced by locomotion. We found that the venous activated area was significantly reduced by atenolol (0.57±0.47, t-test: p=0.013; n=13; power=0.93), but was not significantly changed by glycopyrrolate (1.03±0.53, t-test: p=0.86; n=13) (Fig. 6C). The same results held true when we restricted the venous activated area analysis to the FL/HL area, where the venous activated area was significantly reduced by atenolol (0.63±0.57, t-test: p=0.045; n=12), but was not significantly changed by glycopyrrolate injection (1.24±0.88, t-test: p=0.38; n=12). These results showed that the magnitude and spatial spread of the venous component of the locomotion-evoked CBV HRF were significantly decreased by atenolol, but not glycopyrrolate, indicating that the normal venous CBV response to locomotion was at least partially due to cardiovascular changes associated with locomotion.
Discussion
Studying cerebral hemodynamics during normal physiological functions is important for understanding the robustness of neurovascular coupling. The present study tested the hypothesis that increases in CBF and CBV associated with locomotion are controlled solely by central processes, rather than by peripheral cardiovascular changes. We found that glycopyrrolate occluded a significant component of the normal heart rate increase during locomotion (Wray et al., 2001), but it did not detectably alter locomotion-induced CBV or CBF changes. While atenolol decreased heart rate by ~20%, it had no detectable effects on locomotion-induced changes in CBF or arterial CBV. However, atenolol drastically reduced the venous component of the CBV response to locomotion. This suggests that the normal venous distension accompanying locomotion requires normal heart rate modulations, implying that both cardiovascular and central processes (dilation of nearby arteries and potentially other vessels by neurons and/or astrocytes) (Huo et al., 2014; Vazquez et al., 2014) drive the CBV increase in response to locomotion. Our results suggest that stimulus-locked cardiovascular changes normally are a component of the hemodynamic response. Because tasks can modulate physiological processes such as breathing (Birn et al., 2009), it is possible that cardiovascular-driven changes contribute to global hemodynamic signals (Gonzalez-Castillo et al., 2012). Although atenolol did not cause any significant changes in the amount of time spent locomoting or in modulations of the gamma-band power ECoG during locomotion relative to saline injections, we cannot completely rule out any subtle neural or behavioral changes that might contribute to its effects on locomotion-induced venous CBV changes.
Although the arterial CBV and CBF responses to locomotion were robust to cardiovascular perturbations, the attenuation of the venous CBV response after atenolol injection could be explained by a limited ability of upstream arteries to autoregulate (Lassen, 1959; Lucas et al., 2010; Tzeng and Ainslie, 2013). Between the heart and the surface vessels of the brain from which we measured flow and volume signals (Blinder et al., 2010; 2013; Chen et al., 2011) are the large arteries in the circle of Willis (Vrselja et al., 2014), and the initial segments of the large cerebral arteries. These large vessels at the base of the brain contribute a substantial amount to the resistance of the cerebral vascular network (Faraci and Heistad, 1990), allowing them to exert a strong regulatory influence on pressures experienced by downstream vessels in the dorsal cortex. If these vessels have a limited ability to buffer blood pressures at the low end of the autoregulatory range, this would explain the marked reduction in the venous response to locomotion under atenolol. The loss of cerebral venous dilation to sensory stimulation at low heart rates is similar to results from anesthetized mice, where the heart rate is decreased to a similar extent as atenolol, and veins do not dilate in response to sensory stimulation (Drew et al., 2011).
There are several caveats to our results. First, intrinsic optical signal imaging only captures relative changes in hemodynamic signals from the upper layers of the cortex (Tian et al., 2011), so we cannot comment on the hemodynamic responses in deeper layers or absolute changes. Secondly, we do not know the exact pressures experienced by the blood vessels on the surface of the cortex. The pressure in the small cortical vessels that control local blood flow is likely to not to be tightly linked to the systemic blood pressure. The amplitude of dilations of cerebral vessels will not only depend on blood pressure, but also on intracranial pressure (Ursino and Lodi, 1997). Dilation of cerebral blood vessels will cause increases in intracranial pressure (Risberg et al., 1969), which will oppose further increase in vascular volume.
One potential concern is that the effects of atenolol we see here could be due to change in the dynamics, that is a speedup or slow down of the venous CBV response, rather than a decrease in the amplitude. There was no detectable change in the dynamics of the fast component of the locomotion induced CBV increase (Figure 4). If the venous response were sped up (had a smaller time constant), then the fast component of the linear fit would increase, and the large veins would become visible in the map of the fast (arterial) component of the fit amplitudes (Figure 5). Veins in the dorsal cortex are easily distinguishable from arteries, as veins drain into the sagittal sinus, and do not show the anastomoses seen in the arterial network (Blinder et al, 2010), which are visible in the maps of the fast components (Figure 5A), thus any ‘cross-talk’ would be recognizable. Since we see no veins in the arterial maps, and the amplitude of the arterial component does not change, this indicates that the venous dynamics were not accelerated by atenolol. If the venous response was slowed by atenolol, this would tend to increase the overall integrated response of the slow component to locomotion, which is the opposite of the effect we see here, suggesting that slowing was not taking place. The decrease in the slow component could not be explained by a change in the arterial dynamics, because atenolol did not alter the time constant of the CBF response (Figure 3C), and flow increases in the parenchyma closely follow arterial dynamics (Drew et al, 2011; Huo et al, 2015). Another potential concern would be that the increase in RMS noise during locomotion under atenolol might obscure any true venous signals or be due to poor fitting of the venous signal. This seems unlikely, because venous responses are slow, lasting for tens of seconds (Kim and Kim, 2010, 2011; Drew et al, 2011; Huo et al, 2015), while the physiological ‘noise’, due to spontaneous fluctuations in arterial diameter, happens on a faster times scale than the venous response (Drew et al, 2011; Huo et al, 2015; Figure 4), which means that the RMS noise was in a distinct frequency band from where our significant change in response was observed. If anything, the increase in RMS noise should be associated with changes in arterial responses, which we did not observe (Figures 4 and 5).
What physiological processes, other than changes in cardiovascular state, could explain the decreased venous response and unchanged arterial responses to locomotion we observed under atenolol? One possibility that we cannot rule out is that there was a change in the neural activity during locomotion, indirectly mediated by atenolol, that is not reflected in the ECoG, and that only affected the venous response. ECoG is a coarse measure of neural activity, as it will only measure the average activity of many neurons. It is possible that a small subset of neurons, whose activity was not detectable in the ECoG, could exert a disproportionate influence on the vascular response (Cauli and Hamel, 2004). However, we do not know of a physiological mechanism that could link changes in the local neural activity during locomotion to venous distention alone. Because the dilation of cerebral vessels will depend on the difference between the blood pressure and the intracranial pressure, another possibility would be that raised intracranial pressure (in addition to cardiovascular changes) opposes the venous dilation during locomotion. The choroid plexus, where cerebral spinal fluid (CSF) is produced, is innervated by sympathetic adrenergic nerves, and activation of these fibers decreases cerebral spinal fluid production (Lindvall et al, 1978; Edvinsson and Lindvall, 1978). Blocking adrenergic receptors could possibly increase CSF production, and raise intracranial pressure, which might have the effect of opposing venous dilation. However, this possibility is speculative, especially since beta-blockers do not change intracranial pressure (Auer et al, 1983), and intracranial pressure changes due to CSF production changes are thought to happen on much longer times scales than the changes we observed.
Our observation that cerebral venous blood volume changes reflect peripheral cardiovascular changes in addition to central processes aligns well with previous reports that BOLD fMRI signals, which primarily report oxygenation and volume of venous blood (Kim and Ogawa, 2012), can be affected by physiological fluctuations (Birn et al., 2008; Birn, 2012; Birn et al., 2008; Chang et al., 2009; Chang and Glover, 2009; Chang et al., 2013). Our results suggest that cerebral blood flow and arterial volume changes were not detectably affected by large changes in the cardiovascular dynamics, and thus are probably driven by central signals. However, venous volume changes are at least partially driven by cardiovascular changes accompanying the functional activation. The implication of this result is that in functional imaging studies, where comparisons are drawn across groups with potentially different cardiovascular states, as in aging and disease studies (D'esposito et al., 2003; Iadecola, 2013; 2010), or use stimuli that might drive heart rate changes (such as emotionally charged images or aversive stimuli) (Straube et al., 2007; LaBar et al., 1998), or pharmacological fMRI studies with compounds that affect the cardiovascular system (Jenkins, 2012), or during resting state studies during which the heart-rate and other cardiovascular processes naturally fluctuate (Chang et al, 2013; Goldberger et al., 2002), the measured hemodynamic signals are likely to be contaminated by cardiovascular effects. Under conditions where there might be large cardiovascular changes, it may be preferable to use hemodynamic measures that are less dependent on fluctuations in venous blood volume (such as arterial spin labeling and other techniques (Calamante et al., 1999; Cavusoglu et al., 2012)), or use brief stimuli, which do not cause significant increases in venous volume (Drew et al., 2011; Hillman et al., 2007; Kim et al., 2007; Kim and Kim, 2010; Zong et al., 2012).
Acknowledgments
This work was supported by an award from the American Heart Association, a Scholar Award from the McKnight Endowment Fund for Neuroscience, NS078168 and NS079737 from the NIH to PJD, and ARRA stimulus funds through NS070701. The authors would like to thank M. Nguyen, M. Sedigh-Sarvestani, A. Vazquez, and N. Zhang for comments on the manuscript, and Y.-R. Gao for assistance with data processing.
Footnotes
Publisher's Disclaimer: This is a PDF file of an unedited manuscript that has been accepted for publication. As a service to our customers we are providing this early version of the manuscript. The manuscript will undergo copyediting, typesetting, and review of the resulting proof before it is published in its final citable form. Please note that during the production process errors may be discovered which could affect the content, and all legal disclaimers that apply to the journal pertain.
Conflict of interest: None
Bibliography
- Achakri H, Stergiopulos N, Hoogerwerf N, Hayoz D, Brunner HR, Meister JJ. Intraluminal pressure modulates the magnitude and the frequency of induced vasomotion in rat arteries. J. Vasc. Res. 1995;32:237–246. doi: 10.1159/000159098. [DOI] [PubMed] [Google Scholar]
- Attwell D, Buchan AM, Charpak S, Lauritzen M, Macvicar BA, Newman EA. Glial and neuronal control of brain blood flow. Nature. 2010;468:232–243. doi: 10.1038/nature09613. [DOI] [PMC free article] [PubMed] [Google Scholar]
- Auer LM, Edvinsson L, Johansson BB. Effect of sympathetic nerve stimulation and adrenoceptor blockade on pial arterial and venous calibre and on intracranial pressure in the cat. Acta Physiol. Scand. 1983;119:213–217. doi: 10.1111/j.1748-1716.1983.tb07330.x. [DOI] [PubMed] [Google Scholar]
- Birn R, Murphy K, Bandettini P. The effect of respiration variations on independent component analysis results of resting state functional connectivity. Hum Brain Mapp. 2008;29:740–750. doi: 10.1002/hbm.20577. [DOI] [PMC free article] [PubMed] [Google Scholar]
- Birn RM. The role of physiological noise in resting-state functional connectivity. NeuroImage. 2012;62:864–870. doi: 10.1016/j.neuroimage.2012.01.016. [DOI] [PubMed] [Google Scholar]
- Birn RM, Murphy K, Handwerker DA, Bandettini PA. fMRI in the presence of task-correlated breathing variations. NeuroImage. 2009;47:1092–1104. doi: 10.1016/j.neuroimage.2009.05.030. [DOI] [PMC free article] [PubMed] [Google Scholar]
- Birn RM, Smith MA, Jones TB, Bandettini PA. The respiration response function: the temporal dynamics of fMRI signal fluctuations related to changes in respiration. NeuroImage. 2008;40:644–654. doi: 10.1016/j.neuroimage.2007.11.059. [DOI] [PMC free article] [PubMed] [Google Scholar]
- Blinder P, Shih AY, Rafie C, Kleinfeld D. Topological basis for the robust distribution of blood to rodent neocortex. Proceedings of the National Academy of Sciences. 2010;107:12670–12675. doi: 10.1073/pnas.1007239107. [DOI] [PMC free article] [PubMed] [Google Scholar]
- Blinder P, Tsai PS, Kaufhold JP, Knutsen PM, Suhl H, Kleinfeld D. The cortical angiome: an interconnected vascular network with noncolumnar patterns of blood flow. Nat Neurosci. 2013;16:889–897. doi: 10.1038/nn.3426. [DOI] [PMC free article] [PubMed] [Google Scholar]
- Boas DA, Jones SR, Devor A, Huppert TJ, Dale AM. A vascular anatomical network model of the spatio-temporal response to brain activation. NeuroImage. 2008;40:1116–1129. doi: 10.1016/j.neuroimage.2007.12.061. [DOI] [PMC free article] [PubMed] [Google Scholar]
- Bouchard MB, Chen BR, Burgess SA, Hillman EMC. Ultra-fast multispectral optical imaging of cortical oxygenation, blood flow, and intracellular calcium dynamics. Opt Express. 2009;17:15670–15678. doi: 10.1364/OE.17.015670. [DOI] [PMC free article] [PubMed] [Google Scholar]
- Boynton GM, Engel SA, Glover GH, Heeger DJ. Linear systems analysis of functional magnetic resonance imaging in human V1. J Neurosci. 1996;16:4207–4221. doi: 10.1523/JNEUROSCI.16-13-04207.1996. [DOI] [PMC free article] [PubMed] [Google Scholar]
- Buxton R, Wong E, Frank L. Dynamics of blood flow and oxygenation changes during brain activation: the balloon model. Magn Reson Med. 1998;39:855–864. doi: 10.1002/mrm.1910390602. [DOI] [PubMed] [Google Scholar]
- Calamante F, Thomas DL, Pell GS, Wiersma J, Turner R. Measuring cerebral blood flow using magnetic resonance imaging techniques. J Cereb Blood Flow Metab. 1999;19:701–735. doi: 10.1097/00004647-199907000-00001. [DOI] [PubMed] [Google Scholar]
- Cavusoglu M, Bartels A, Yeşilyurt B, Uludağ K. Retinotopic maps and hemodynamic delays in the human visual cortex measured using arterial spin labeling. NeuroImage. 2012;59:4044–4054. doi: 10.1016/j.neuroimage.2011.10.056. [DOI] [PubMed] [Google Scholar]
- Cauli B, Hamel E. Revisiting the role of neurons in neurovascular coupling. Front. Neuroenergetics. 2010;2:1–9. doi: 10.3389/fnene.2010.00009. [DOI] [PMC free article] [PubMed] [Google Scholar]
- Chang C, Cunningham JP, Glover GH. Influence of heart rate on the BOLD signal: The cardiac response function. NeuroImage. 2009;44:857–869. doi: 10.1016/j.neuroimage.2008.09.029. [DOI] [PMC free article] [PubMed] [Google Scholar]
- Chang C, Glover GH. Relationship between respiration, end-tidal CO2, and BOLD signals in resting-state fMRI. NeuroImage. 2009;47:1381–1393. doi: 10.1016/j.neuroimage.2009.04.048. [DOI] [PMC free article] [PubMed] [Google Scholar]
- Chang C, Metzger CD, Glover GH, Duyn JH, Heinze H-J, Walter M. Association between heart rate variability and fluctuations in resting-state functional connectivity. NeuroImage. 2013;68:93–104. doi: 10.1016/j.neuroimage.2012.11.038. [DOI] [PMC free article] [PubMed] [Google Scholar]
- Chen BR, Bouchard MB, Mccaslin AFH, Burgess SA, Hillman EMC. High-speed vascular dynamics of the hemodynamic response. NeuroImage. 2011;54:1021–1030. doi: 10.1016/j.neuroimage.2010.09.036. [DOI] [PMC free article] [PubMed] [Google Scholar]
- Dechent P, Schütze G, Helms G, Merboldt KD, Frahm J. Basal cerebral blood volume during the poststimulation undershoot in BOLD MRI of the human brain. J. Cereb. Blood Flow Metab. 2011;31:82–89. doi: 10.1038/jcbfm.2010.133. [DOI] [PMC free article] [PubMed] [Google Scholar]
- D'esposito M, Deouell LY, Gazzaley A. Alterations in the BOLD fMRI signal with ageing and disease: a challenge for neuroimaging. Nat Rev Neurosci. 2003;4:863–872. doi: 10.1038/nrn1246. [DOI] [PubMed] [Google Scholar]
- Drew PJ, Feldman DE. Representation of moving wavefronts of whisker deflection in rat somatosensory cortex. J Neurophysiol. 2007;98:1566–1580. doi: 10.1152/jn.00056.2007. [DOI] [PubMed] [Google Scholar]
- Drew PJ, Feldman DE. Intrinsic signal imaging of deprivation-induced contraction of whisker representations in rat somatosensory cortex. Cerebral Cortex. 2009;19:331–348. doi: 10.1093/cercor/bhn085. [DOI] [PMC free article] [PubMed] [Google Scholar]
- Drew PJ, Shih AY, Driscoll JD, Knutsen PM, Blinder P, Davalos D, Akassoglou K, Tsai PS, Kleinfeld D. Chronic optical access through a polished and reinforced thinned skull. Nat Meth. 2010;7:981–984. doi: 10.1038/nmeth.1530. [DOI] [PMC free article] [PubMed] [Google Scholar]
- Drew PJ, Shih AY, Kleinfeld D. Fluctuating and sensory-induced vasodynamics in rodent cortex extend arteriole capacity. Proceedings of the National Academy of Sciences. 2011;108:8473–8478. doi: 10.1073/pnas.1100428108. [DOI] [PMC free article] [PubMed] [Google Scholar]
- Edvinsson L, Lindvall M. Autonomic vascular innervation and vasomotor reactivity in the choroid plexus. Exp. Neurol. 1978;62:394–404. doi: 10.1016/0014-4886(78)90063-8. [DOI] [PubMed] [Google Scholar]
- Edvinsson L, Högestätt ED, Uddman R, Auer LM. Cerebral veins: fluorescence histochemistry, electron microscopy, and in vitro reactivity. J Cereb Blood Flow Metab. 1983;3:226–230. doi: 10.1038/jcbfm.1983.30. [DOI] [PubMed] [Google Scholar]
- Fairfax ST, Mauban JRH, Hao S, Rizzo M. a., Zhang J, Wier WG. Ca2+ signaling in arterioles and small arteries of conscious, restrained, optical biosensor mice. Front. Physiol. 2014;5:1–9. doi: 10.3389/fphys.2014.00387. [DOI] [PMC free article] [PubMed] [Google Scholar]
- Faraci F, Heistad D. Regulation of large cerebral arteries and cerebral microvascular pressure. Circ Res. 1990;66:8. doi: 10.1161/01.res.66.1.8. [DOI] [PubMed] [Google Scholar]
- Faul F, Erdfelder E, Lang A-G, Buchner A. G*Power 3: A flexible statistical power analysis program for the social, behavioral, and biomedical sciences. Behavior Research Methods. 2007;39:175–191. doi: 10.3758/bf03193146. [DOI] [PubMed] [Google Scholar]
- Ferrari M, Quaresima V. A brief review on the history of human functional near-infrared spectroscopy (fNIRS) development and fields of application. NeuroImage. 2012;63:921–935. doi: 10.1016/j.neuroimage.2012.03.049. [DOI] [PubMed] [Google Scholar]
- Fitzgerald JD, Ruffin R, Smedstad KG, Roberts R, McAinsh J. Studies on the pharmacokinetics and pharmacodynamics of atenolol in man. Eur. J. Clin. Pharmacol. 1978;13:81–89. doi: 10.1007/BF00609750. [DOI] [PubMed] [Google Scholar]
- Franko BV, Alphin RS, Ward JW, Lunsford CD. Pharmacodynamic evaluation of glycopyrrolate in animals. Annals of the New York Academy of Sciences. 1962;99:131–149. doi: 10.1111/j.1749-6632.1962.tb45296.x. [DOI] [PubMed] [Google Scholar]
- Gao Y-R, Drew PJ. Determination of vessel cross-sectional area by thresholding in Radon space. J Cereb Blood Flow Metab. 2014;34:1180–1187. doi: 10.1038/jcbfm.2014.67. [DOI] [PMC free article] [PubMed] [Google Scholar]
- Glover G. Deconvolution of impulse response in event-related BOLD fMRI. NeuroImage. 1999;9:416–429. doi: 10.1006/nimg.1998.0419. [DOI] [PubMed] [Google Scholar]
- Goldberger A, Amaral L, Hausdorff J, Ivanov P, Peng C, Stanley H. Fractal dynamics in physiology: alterations with disease and aging. Proc Natl Acad Sci USA. 2002;99:2466. doi: 10.1073/pnas.012579499. [DOI] [PMC free article] [PubMed] [Google Scholar]
- Gonzalez-Castillo J, Saad ZS, Handwerker DA, Inati SJ, Brenowitz N, Bandettini PA. Whole-brain, time-locked activation with simple tasks revealed using massive averaging and model-free analysis. Proceedings of the National Academy of Sciences. 2012;109:5487–5492. doi: 10.1073/pnas.1121049109. [DOI] [PMC free article] [PubMed] [Google Scholar]
- Hamel E. Perivascular nerves and the regulation of cerebrovascular tone. Journal of Applied Physiology. 2006;100:1059. doi: 10.1152/japplphysiol.00954.2005. [DOI] [PubMed] [Google Scholar]
- Hamner JW, Tan CO, Tzeng YC, Taylor JA. Cholinergic control of the cerebral vasculature in humans. J Physiol (Lond) 2012;590:6343–6352. doi: 10.1113/jphysiol.2012.245100. [DOI] [PMC free article] [PubMed] [Google Scholar]
- Harder DR. Pressure-dependent membrane depolarization in cat middle cerebral artery. Circ Res. 1984;55:197–202. doi: 10.1161/01.res.55.2.197. [DOI] [PubMed] [Google Scholar]
- Hillman EMC. Coupling Mechanism and Significance of the BOLD Signal: A Status Report. Annu Rev Neurosci. 2014;37:161–181. doi: 10.1146/annurev-neuro-071013-014111. [DOI] [PMC free article] [PubMed] [Google Scholar]
- Hillman EMC, Devor A, Bouchard MB, Dunn AK, Krauss GW, Skoch J, Bacskai BJ, Dale AM, Boas DA. Depth-resolved optical imaging and microscopy of vascular compartment dynamics during somatosensory stimulation. NeuroImage. 2007;35:89–104. doi: 10.1016/j.neuroimage.2006.11.032. [DOI] [PMC free article] [PubMed] [Google Scholar]
- Hua J, Stevens RD, Huang AJ, Pekar JJ, van Zijl PCM. Physiological origin for the BOLD poststimulus undershoot in human brain: vascular compliance versus oxygen metabolism. J. Cereb. Blood Flow Metab. 2011;31:1599–1611. doi: 10.1038/jcbfm.2011.35. [DOI] [PMC free article] [PubMed] [Google Scholar]
- Huo B-X, Gao Y-R, Drew PJ. Quantitative separation of arterial and venous cerebral blood volume increases during voluntary locomotion. NeuroImage. 2015;105:369–379. doi: 10.1016/j.neuroimage.2014.10.030. [DOI] [PMC free article] [PubMed] [Google Scholar]
- Huo B-X, Smith JB, Drew PJ. Neurovascular Coupling and Decoupling in the Cortex during Voluntary Locomotion. Journal of Neuroscience. 2014;34:10975–10981. doi: 10.1523/JNEUROSCI.1369-14.2014. [DOI] [PMC free article] [PubMed] [Google Scholar]
- Iadecola C. Neurovascular regulation in the normal brain and in Alzheimer's disease. Nat Rev Neurosci. 2004;5:347–360. doi: 10.1038/nrn1387. [DOI] [PubMed] [Google Scholar]
- Iadecola C. The overlap between neurodegenerative and vascular factors in the pathogenesis of dementia. Acta Neuropathol. 2010;120:287–296. doi: 10.1007/s00401-010-0718-6. [DOI] [PMC free article] [PubMed] [Google Scholar]
- Iadecola C. The Pathobiology of Vascular Dementia. Neuron. 2013;80:844–866. doi: 10.1016/j.neuron.2013.10.008. [DOI] [PMC free article] [PubMed] [Google Scholar]
- Jenkins BG. Pharmacologic magnetic resonance imaging (phMRI): Imaging drug action in the brain. NeuroImage. 2012;62:1072–1085. doi: 10.1016/j.neuroimage.2012.03.075. [DOI] [PMC free article] [PubMed] [Google Scholar]
- Joho S, Ishizaka S, Sievers R, Foster E, Simpson PC, Grossman W. Left ventricular pressure-volume relationship in conscious mice. AJP: Heart and Circulatory Physiology. 2006;292:H369–H377. doi: 10.1152/ajpheart.00704.2006. [DOI] [PubMed] [Google Scholar]
- Joyner MJ, Freund BJ, Jilka SM, Hetrick GA, Martinez E, Ewy GA, Wilmore JH. Effects of beta-blockade on exercise capacity of trained and untrained men: a hemodynamic comparison. J Appl Physiol. 1986;60:1429–1434. doi: 10.1152/jappl.1986.60.4.1429. [DOI] [PubMed] [Google Scholar]
- Kalisch R, Elbel G-K, Gössl C, Czisch M, Auer DP. Blood Pressure Changes Induced by Arterial Blood Withdrawal Influence Bold Signal in Anesthesized Rats at 7 Tesla: Implications for Pharmacologic MRI. NeuroImage. 2001;14:891–898. doi: 10.1006/nimg.2001.0890. [DOI] [PubMed] [Google Scholar]
- Kim S-G, Ogawa S. Biophysical and physiological origins of blood oxygenation level-dependent fMRI signals. J Cereb Blood Flow Metab. 2012;32:1188–1206. doi: 10.1038/jcbfm.2012.23. [DOI] [PMC free article] [PubMed] [Google Scholar]
- Kim T, Hendrich KS, Masamoto K, Kim S-G. Arterial versus total blood volume changes during neural activity-induced cerebral blood flow change: implication for BOLD fMRI. J Cereb Blood Flow Metab. 2007;27:1235–1247. doi: 10.1038/sj.jcbfm.9600429. [DOI] [PubMed] [Google Scholar]
- Kim T, Kim S. Cortical layer-dependent arterial blood volume changes: improved spatial specificity relative to BOLD fMRI. NeuroImage. 2010;49:1340–1349. doi: 10.1016/j.neuroimage.2009.09.061. [DOI] [PMC free article] [PubMed] [Google Scholar]
- Kim T, Kim S-G. Temporal dynamics and spatial specificity of arterial and venous blood volume changes during visual stimulation: implication for BOLD quantification. J Cereb Blood Flow Metab. 2011;31:1211–1222. doi: 10.1038/jcbfm.2010.226. [DOI] [PMC free article] [PubMed] [Google Scholar]
- LaBar KS, Gatenby JC, Gore JC, LeDoux JE, Phelps EA. Human amygdala activation during conditioned fear acquisition and extinction: a mixed-trial fMRI study. Neuron. 1998;20:937–945. doi: 10.1016/s0896-6273(00)80475-4. [DOI] [PubMed] [Google Scholar]
- Lassen NA. Cerebral blood flow and oxygen consumption in man. 1959;39:183–238. doi: 10.1152/physrev.1959.39.2.183. [DOI] [PubMed] [Google Scholar]
- Lee S, Duong T, Yang G, Iadecola C, Kim S. Relative changes of cerebral arterial and venous blood volumes during increased cerebral blood flow: implications for BOLD fMRI. Magn Reson Med. 2001;45:791–800. doi: 10.1002/mrm.1107. [DOI] [PubMed] [Google Scholar]
- Lindvall M, Edvinsson L, Owman C. Sympathetic nervous control of cerebrospinal fluid production from the choroid plexus. Sci. (New York, NY) 1978;201:176–178. doi: 10.1126/science.663649. [DOI] [PubMed] [Google Scholar]
- Logothetis N, Pauls J, Augath M, Trinath T, Oeltermann A. Neurophysiological investigation of the basis of the fMRI signal. Nature. 2001;412:150–157. doi: 10.1038/35084005. [DOI] [PubMed] [Google Scholar]
- Logothetis NK. What we can do and what we cannot do with fMRI. Nature. 2008;453:869–878. doi: 10.1038/nature06976. [DOI] [PubMed] [Google Scholar]
- Lucas SJE, Tzeng YC, Galvin SD, Thomas KN, Ogoh S, Ainslie PN. Influence of Changes in Blood Pressure on Cerebral Perfusion and Oxygenation. Hypertension. 2010;55:698–705. doi: 10.1161/HYPERTENSIONAHA.109.146290. [DOI] [PubMed] [Google Scholar]
- Mandeville JB, Marota JJA, Ayata C, Zaharchuk G, Moskowitz MA, Rosen BR, Weisskoff RM. Evidence of a Cerebrovascular Postarteriole Windkessel With Delayed Compliance. J Cereb Blood Flow Metab. 1999:679–689. doi: 10.1097/00004647-199906000-00012. [DOI] [PubMed] [Google Scholar]
- MacCallum RC, Zhang S, Preacher KJ, Rucker DD. On the practice of dichotomization of quantitative variables. Psychol. Methods. 2002;7:19–40. doi: 10.1037/1082-989x.7.1.19. [DOI] [PubMed] [Google Scholar]
- Mitchell JH. Cardiovascular control during exercise: central and reflex neural mechanisms. Am. J. Cardiol. 1985;55:34D–41D. doi: 10.1016/0002-9149(85)91053-7. [DOI] [PubMed] [Google Scholar]
- Mitra P, Bokil H. Observed Brain Dynamics. Oxford University Press; 2008. [Google Scholar]
- Neil Dwyer G, Bartlett J, McAinsh J, Cruickshank JM. Beta-adrenoceptor blockers and the blood-brian barrier. British Journal of Clinical Pharmacology. 2012;11:549–553. doi: 10.1111/j.1365-2125.1981.tb01169.x. [DOI] [PMC free article] [PubMed] [Google Scholar]
- Niell CM, Stryker MP. Modulation of visual responses by behavioral state in mouse visual cortex. Neuron. 2010;65:472–479. doi: 10.1016/j.neuron.2010.01.033. [DOI] [PMC free article] [PubMed] [Google Scholar]
- Niessing J, Ebisch B, Schmidt KE, Niessing M, Singer W, Galuske RAW. Hemodynamic signals correlate tightly with synchronized gamma oscillations. Science. 2005;309:948–951. doi: 10.1126/science.1110948. [DOI] [PubMed] [Google Scholar]
- Ogoh S, Ainslie PN. Cerebral blood flow during exercise: mechanisms of regulation. Journal of Applied Physiology. 2009;107:1370–1380. doi: 10.1152/japplphysiol.00573.2009. [DOI] [PubMed] [Google Scholar]
- Oude Vrielink HH, Slaaf DW, Tangelder GJ, Reneman RS. Changes in vasomotion pattern and local arteriolar resistance during stepwise pressure reduction. Pflugers Arch. 1989;414:571–578. doi: 10.1007/BF00580993. [DOI] [PubMed] [Google Scholar]
- Prahl S. Optical absorption of hemoglobin. Oregon Medical Laser Center. 2006 http://omlc.org/spectra/hemoglobin/
- Paukert M, Agarwal A, Cha J, Van A Doze, Kang JU, Bergles DE. Norepinephrine Controls Astroglial Responsiveness to Local Circuit Activity. Neuron. 2014;82:1263–1270. doi: 10.1016/j.neuron.2014.04.038. [DOI] [PMC free article] [PubMed] [Google Scholar]
- Petzold GC, Murthy VN. Role of astrocytes in neurovascular coupling. Neuron. 2011;71:782–797. doi: 10.1016/j.neuron.2011.08.009. [DOI] [PubMed] [Google Scholar]
- Piper SK, Krueger A, Koch SP, Mehnert J, Habermehl C, Steinbrink J, Obrig H, Schmitz CH. A wearable multi-channel fNIRS system for brain imaging in freely moving subjects. NeuroImage. 2014;85:64–71. doi: 10.1016/j.neuroimage.2013.06.062. [DOI] [PMC free article] [PubMed] [Google Scholar]
- Polack P-O, Friedman J, Golshani P. Cellular mechanisms of brain state-dependent gain modulation in visual cortex. Nat Neurosci. 2013;16:1331–1339. doi: 10.1038/nn.3464. [DOI] [PMC free article] [PubMed] [Google Scholar]
- Risberg J, Lundberg N, Ingvar DH. Regional cerebral blood volume during acute transient rises of the intracranial pressure (plateau waves) J. Neurosurg. 1969;31:303–310. doi: 10.3171/jns.1969.31.3.0303. [DOI] [PubMed] [Google Scholar]
- Rokamp KZ, Olesen ND, Larsson HB, Hansen AE, Seifert T, Nielsen HB, Secher NH, Rostrup E. Glycopyrrolate does not influence the visual or motor-induced increase in regional cerebral perfusion. Front. Physio. 2014;5 doi: 10.3389/fphys.2014.00045. [DOI] [PMC free article] [PubMed] [Google Scholar]
- Seifert T, Fisher JP, Young CN, Hartwich D, Ogoh S, Raven PB, Fadel PJ, Secher NH. Glycopyrrolate abolishes the exercise-induced increase in cerebral perfusion in humans. Experimental Physiology. 2010;95:1016–1025. doi: 10.1113/expphysiol.2010.054346. [DOI] [PubMed] [Google Scholar]
- Shih AY, Driscoll JD, Drew PJ, Nishimura N, Schaffer CB, Kleinfeld D. Two-photon microscopy as a tool to study blood flow and neurovascular coupling in the rodent brain. J Cereb Blood Flow Metab. 2012;32:1277–1309. doi: 10.1038/jcbfm.2011.196. [DOI] [PMC free article] [PubMed] [Google Scholar]
- Shmueli K, van Gelderen P, de Zwart JA, Horovitz SG, Fukunaga M, Jansma JM, Duyn JH. Low-frequency fluctuations in the cardiac rate as a source of variance in the resting-state fMRI BOLD signal. NeuroImage. 2007;38:306–320. doi: 10.1016/j.neuroimage.2007.07.037. [DOI] [PMC free article] [PubMed] [Google Scholar]
- Siero JC, Hermes D, Hoogduin H, Luijten PR, Petridou N, Ramsey NF. BOLD consistently matches electrophysiology in humansensorimotor cortex at increasing movement rates: a combined7T fMRI and ECoG study on neurovascular coupling. J Cereb Blood Flow Metab. 2013;33:1448–1456. doi: 10.1038/jcbfm.2013.97. [DOI] [PMC free article] [PubMed] [Google Scholar]
- Silva AC. Perfusion-based fMRI: Insights from animal models. J Magn Reson Imaging. 2005;22:745–750. doi: 10.1002/jmri.20461. [DOI] [PubMed] [Google Scholar]
- Silva AC, Koretsky AP, Duyn JH. Functional MRI impulse response for BOLD and CBV contrast in rat somatosensory cortex. Magn Reson Med. 2007;57:1110–1118. doi: 10.1002/mrm.21246. [DOI] [PMC free article] [PubMed] [Google Scholar]
- Straube T, Mentzel H-J, Miltner WHR. Waiting for spiders: Brain activation during anticipatory anxiety in spider phobics. NeuroImage. 2007;37:1427–1436. doi: 10.1016/j.neuroimage.2007.06.023. [DOI] [PubMed] [Google Scholar]
- Tian P, Devor A, Sakadžić S, Dale AM, Boas DA. Monte Carlo simulation of the spatial resolution and depth sensitivity of two-dimensional optical imaging of the brain. J Biomed Opt. 2011;16:016006. doi: 10.1117/1.3533263. [DOI] [PMC free article] [PubMed] [Google Scholar]
- Tzeng Y-C, Ainslie PN. Blood pressure regulation IX: cerebral autoregulation under blood pressure challenges. Eur. J. Appl. Physiol. 2013;114:545–559. doi: 10.1007/s00421-013-2667-y. [DOI] [PMC free article] [PubMed] [Google Scholar]
- Ursino M, Lodi CA. A simple mathematical model of the interaction between intracranial pressure and cerebral hemodynamics. J Appl Physiol. 1997;82:1256–1269. doi: 10.1152/jappl.1997.82.4.1256. [DOI] [PubMed] [Google Scholar]
- van Zijl PCM, Hua J, Lu H. The BOLD post-stimulus undershoot, one of the most debated issues in fMRI. Neuroimage. 2012;62:1092–1102. doi: 10.1016/j.neuroimage.2012.01.029. [DOI] [PMC free article] [PubMed] [Google Scholar]
- Vazquez AL, Noll DC. Nonlinear aspects of the BOLD response in functional MRI. NeuroImage. 1998;7:108–118. doi: 10.1006/nimg.1997.0316. [DOI] [PubMed] [Google Scholar]
- Vazquez AL, Fukuda M, Crowley JC, Kim S-G. Neural and Hemodynamic Responses Elicited by Forelimb- and Photo-stimulation in Channelrhodopsin-2 Mice: Insights into the Hemodynamic Point Spread Function. Cereb. Cortex. 2014;24:2908–2919. doi: 10.1093/cercor/bht147. [DOI] [PMC free article] [PubMed] [Google Scholar]
- Vrselja Z, Brkic H, Mrdenovic S, Radic R, Curic G. Function of circle of Willis. J Cereb Blood Flow Metab. 2014:1–7. doi: 10.1038/jcbfm.2014.7. [DOI] [PMC free article] [PubMed] [Google Scholar]
- Wang R, Foniok T, Wamsteeker JI, Qiao M, Tomanek B, Vivanco RA, Tuor UI. Transient blood pressure changes affect the functional magnetic resonance imaging detection of cerebral activation. NeuroImage. 2006;31:1–11. doi: 10.1016/j.neuroimage.2005.12.004. [DOI] [PubMed] [Google Scholar]
- Wray DW, Formes KJ, Weiss MS, O-Yurvati AH, Raven PB, Zhang R, Shi X. Vagal cardiac function and arterial blood pressure stability. American Journal of Physiology- Heart and Circulatory Physiology. 2001;281:H1870–80. doi: 10.1152/ajpheart.2001.281.5.H1870. [DOI] [PubMed] [Google Scholar]
- Yancey SL, Overton JM. Cardiovascular responses to voluntary and treadmill exercise in rats. J Appl Physiol. 1993;75:1334–1340. doi: 10.1152/jappl.1993.75.3.1334. [DOI] [PubMed] [Google Scholar]
- Zheng Y, Mayhew J. A time-invariant visco-elastic windkessel model relating blood flow and blood volume. NeuroImage. 2009;47:1371–1380. doi: 10.1016/j.neuroimage.2009.04.022. [DOI] [PMC free article] [PubMed] [Google Scholar]
- Zong X, Kim T, Kim S-G. Contributions of dynamic venous blood volume versus oxygenation level changes to BOLD fMRI. NeuroImage. 2012;60:2238–2246. doi: 10.1016/j.neuroimage.2012.02.052. [DOI] [PMC free article] [PubMed] [Google Scholar]