

Abstract
Chemical exchange saturation transfer (CEST) MRI has been increasingly applied to detect dilute solutes and physicochemical properties, with promising in vivo applications. Whereas CEST imaging has been implemented with continuous wave (CW) radio-frequency (RF) irradiation on preclinical scanners, pulse-train irradiation is often chosen on clinical systems. Therefore, it is necessary to optimize pulse-train CEST imaging, particularly important for translational studies. Because conventional Bloch-McConnell formulas are not in the form of homogeneous differential equations, the routine simulation approach simulates the evolving magnetization step by step, which is time consuming. Herein we developed a computationally efficient numerical solution using matrix iterative analysis of homogeneous Bloch-McConnell equations. The proposed algorithm requires simulation of pulse-train CEST MRI magnetization within one irradiation repeat, with 99% computation time reduction from that of conventional approach under typical experimental conditions. The proposed solution enables determination of labile proton ratio and exchange rate from pulse-train CEST MRI experiment, within 5% from those determined from quantitative CW-CEST MRI. In addition, the structural similarity index analysis shows that the dependence of CEST contrast on saturation pulse flip angle and duration between simulation and experiment was 0.98±0.01, indicating that the proposed simulation algorithm permits fast optimization and quantification of pulse-train CEST MRI.
Keywords: Bloch–McConnell equations, Chemical exchange saturation transfer (CEST), Quantitative chemical exchange saturation transfer (qCEST), Pulse-train
1. Introduction
Chemical exchange saturation transfer (CEST) MRI is sensitive to the chemical exchange between labile and bulk water protons, providing an imaging contrast for detection of dilute solutes and physicochemical properties such as pH and temperature (Ward et al., 2000; Zhou et al., 2003; Aime et al., 2002; van Zijl et al., 2007; Sun and Sorensen, 2008; Cai et al., 2012; Longo et al., 2012). CEST MRI has been increasingly applied in disorders such as stroke, tumor, multiple sclerosis, and renal injury, augmenting routine diagnostic imaging (Yoo et al., 2007; Sun et al., 2007b; Sun et al., 2011b; Zhou et al., 2011; Sun et al., 2012; Dula et al., 2012; Liu et al., 2012; Chan et al., 2013; McVicar et al., 2014; Longo et al., 2014; Jia et al., 2011). Whereas continuous wave (CW) radio-frequency (RF) irradiation has been commonly implemented on preclinical scanners, CW irradiation is often not feasible on clinical scanners due to RF duty cycle limitation, and pulse-train RF irradiation scheme has to be utilized in translational CEST imaging.
Bloch–McConnell equations have been used to describe CEST MRI (Zhou et al., 2004a; Woessner et al., 2005; McMahon et al., 2006; Sun, 2010; Zaiss and Bachert, 2013). Routine numerical solution simulates the magnetization evolution piece-wisely for the complete RF saturation duration and is time consuming (Sun et al., 2008; Li et al., 2008; Murase and Tanki, 2011; Sun et al., 2011c). To simplify conventional numerical simulation approach, pulse-train CEST MRI has been approximated by CW-CEST MRI by finding the equivalent RF irradiation amplitude or power (Sun et al., 2008; Zu et al., 2011). Indeed, it has been shown that for dilute CEST agents undergoing slow chemical exchange, pulse-train CEST MRI provides similar CEST effect as the CW-CEST MRI. Because the typical CEST effect is only a few percent, it is important to optimize pulse-train CEST MRI for in vivo applications (Sun et al., 2011a; Wu et al., 2012; Tee et al., 2013; Yuan et al., 2013; Sun et al., 2013b; Sun et al., 2014a; Sun et al., 2014b; Zhu et al., 2010; Shah et al., 2011; Zu et al., 2013). However, because of the long computation time it takes to simulate pulse-train CEST MRI, it remains challenging to fit pulse-train CEST MRI measurements and solve the underlying CEST system. Our study aims to investigate a fast numerical algorithm for describing pulse-train CEST imaging. Briefly, we first compared the proposed matrix exponential algorithm and the conventional simulation approach, and demonstrated that the matrix exponential approach provides substantial computation speed advantage. We showed that the fast simulation algorithm enables quantification of pulse-train CEST MRI, in good agreement with quantitative CW-CEST MRI. Furthermore, due to the computation speed gain, the fast simulation approach enables multi-dimensional simulation that directly solves the optimal pulse-train CEST MRI experimental conditions, in excellent agreement with experimental findings.
2. Theory
2.1. Bloch–McConnell equations for CW-RF irradiation
CEST effect can be modeled using the Bloch-McConnell equations (Woessner et al., 2005). For a typical 2-pool model that includes bulk water and exchangeable protons, we have (Murase and Tanki, 2011)
| (1) |
where and , in which superscripts w and s denote bulk water and labile proton, respectively. In addition, and are their equilibrium spins with ksw,ws being the exchange rate from labile protons to bulk water and vice versa. Moreover,ω1(t) is the RF amplitude, and Δωw,s are the frequency difference between RF irradiation and chemical shifts of bulk water and labile proton pools. For the routine CW irradiation scheme, solution to Eq. 1 can be shown to be consistent with that of Woessner et al. (Woessner et al., 2005)
2.2. Bloch–McConnell equations for pulsed-RF irradiation
Fig. 1 shows a typical pulse-train CEST echo planar imaging (EPI) sequence. The RF pulse-train can be described using pulse shape, flip angle (Φ), duration (τp) and the inter-pulse delay (τd). Crusher gradients are applied between RF irradiation pulses to suppress transverse magnetization. Because Gaussian pulse is widely used in pulse-train CEST MRI, our study simulated Gaussian saturation pulse. Specifically, we have , where τgauss, B1 and σ are the duration, peak amplitude and standard deviation of the Gaussian pulse, respectively, and γ is the gyromagnetic ratio. In addition, τ=τgauss/m with m being the number of steps per RF pulse. The magnetization at the end of recovery time is given by
Fig. 1.
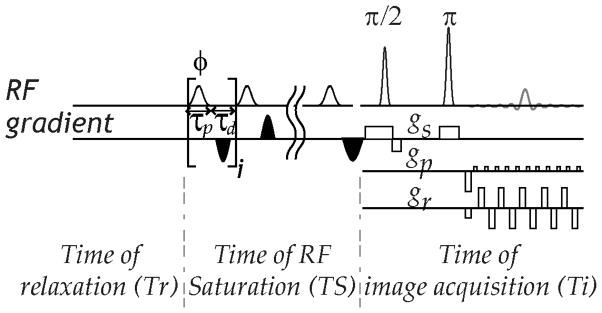
Illustration of pulse-train CEST MRI pulse sequence, including relaxation recovery, RF irradiation and image readout. The pulse train can be described by the pulse shape, duration, flip angle and inter-pulse delay.
| (2) |
where M(0) is the initial magnetization and A(0) is evolution matrix with ω1=0. At the end of each RF pulse, the effect of crusher gradient can be described by a spoiler matrix. To enhance the computation efficiency, we used the matrix iterative approach for solving pulse-train CEST MRI. Briefly, we have
| (3) |
3. Materials and methods
3.1 Phantom
A creatine and agarose CEST phantom was prepared. Briefly, 50 mM Creatine solution was added to 1.5% Agarose solution doped with 0.65 mM copper sulfate (Sigma-Aldrich, St. Louis, MO). pH was titrated to 6.0 and 6.6 at 50°C (EuTech Instrument, Singapore). The solution was then transferred into two concentric tubes and solidified under the room temperature.
3.2 MRI
Images were acquired using a 4.7 T small-bore scanner (Bruker Biospec, Billerica, MA) at room temperature. We used single-shot EPI readout (field of view = 52×52 mm, slice thickness = 10 mm, bandwidth = 227 kHz). The image matrix was 96×96; the repetition time (TR) and echo time (TE) were 10 s and 47 ms, respectively, and the RF saturation time (TS) was 5 s (number of signal average, NSA = 2). For CW-CEST MRI, the RF amplitude was varied from 0.5, 0.75 to 1 μT. For pulse-train CEST MRI, the RF pulse duration was varied from 20, 25 to 30 ms for a flip angle of 180°. In addition, T1 and T2 maps were obtained with inversion recovery (using seven inversion intervals (TI) ranging from 0.1 to 7.5 s, recovery time (Tr)/TE=10s/47ms), and spin echo (SE) EPI (TR=10 s, TE= 50, 75, 100, 150 and 200 ms). In addition, we optimized the pulse-train CEST MRI by varying the RF flip angle from 30° to 450° with intervals of 30°. For each flip angle, we varied the RF pulse duration from 10 to 30 ms with intervals of 5 ms, and from 30 to 50 ms with intervals of 10 ms.
3.3 Numerical Solution and Data Processing
Numerical simulation and experimental data were processed in Matlab (Mathworks, Natick, MA). Because the phantom was well shimmed with B0 inhomogeneity of −1.3 ± 2.0 Hz (mean ±S.D.), field inhomogeneity correction was not necessary (Sun et al., 2007a; Kim et al., 2009). The CEST effect was calculated using asymmetry analysis (CESTR), CESTR=(Iref -Ilabel)/I0, where Ilabel and Iref are saturation and reference scans at ±1.9 ppm, respectively, and I0 is the control scan without irradiation. For pulse-train CEST MRI, the RF pulse was divided into 32 steps and simulated piece-wisely. In addition, T1 and T2 were obtained using least squares fitting of the signal as functions of inversion time (I= I0⌊1−(1− η)e−TI/T1⌋), where η is the inversion efficiency, and TE (I = I0e−TE/T2), respectively. The bulk water T1 and T2 were measured to be 2.64 s and 65 ms, respectively. In addition, the creatine labile proton chemical shift is 1.9 ppm, and we assumed labile proton T1 being 1 s for numerical fittings. Three variables were determined from numerical fitting: labile proton T2 (T2s), concentration (fs) and exchange rate (ksw). Asymmetry spectra were determined from least squares fitting of two pH compartments under different RF saturation conditions (i.e. three B1 levels for CW-CEST and three τps for pulse-train CEST MRI (Φ=180°), respectively). We used interior point-constrained nonlinear multivariable function and the pH effect was modeled by using a different exchange rate for each pH compartment. For the labile proton T2s, labile proton concentration (fs) and two pH-dependent exchange rates, their lower and upper bounds were set to be [5/1000, 1/2000, 10, 50] and [30/1000, 2.6/2000, 50, 100], respectively, with the initial guesses being their mean.
To optimize the pulse-train CEST MRI, we simulated the effects of pulse duration and flip angle for maximizing CEST effect as functions of labile proton exchange rate and chemical shift. The labile proton exchange rate was varied from 10 to 510 s−1 at intervals of 20 s−1 and the chemical shift varied from 1 to 4 ppm at intervals of 0.25 ppm. The relaxation time, labile proton concentration and exchange rate were determined from numerical fitting, being T1w=2.64 s, T1s=1 s, T2w=65 ms, T2s=11 ms, M0s=1:909. We set a typical RF duty cycle of 50 % and total saturation time of 5 s. We used structural similarity index (SSIM) to compare the effect of experimental conditions on CEST measurement (Zhou et al., 2004b). This is because images are highly structured and the pixels may exhibit non-negligible dependencies with surrounding pixels. Hence, we chose SSIM to evaluate the structural similarity and take into consideration of contributions from both contrast and structure comparison functions (Zhou et al., 2004b).
4. Results
We first compared the simulation time for pulse-train CEST MRI using conventional numerical solution and the proposed fast matrix iterative simulation approach. For the conventional approach, the computation time increased linearly with the number of pulses and saturation time (data not shown). In comparison, fast simulation approach showed little change in computation time due to efficient iterative matrix calculation. For example, using a Desktop computer with Intel(R) G645 central processing unit of 2.9 GHz with 2 gigabyte random access memory, the computation time for simulating 150 saturation pulses (τp= τd= 20 ms, TS=5 s, 32 steps per RF pulse) was about 21 s for the conventional method, while the proposed fast method took only 0.14 s, a reduction of 99%. This is because the conventional Bloch-McConnell formulas are not in the form of homogeneous differential equations, the evolving magnetization has to be simulated step by step, which is time-consuming.
Because it has been shown that optimal experimental parameters have little dependence on labile proton concentration, we compared pulse-train CEST MRI with CW-CEST MRI for representative exchange rates and chemical shifts. Specifically, Figs. 2a and 2b show the maximal CW-CEST effect and the corresponding optimal RF irradiation power level, as a function of labile proton exchange rate and chemical shift. The optimal B1 level increases with exchange rate and chemical shift, resulting in higher CEST effect (Sun et al., 2005). Due to less efficient labeling efficiency and loss of contrast during the inter-pulse delay, the pulse-train CEST effect is lower than that of CW-CEST effect (Fig. 2c). The equivalent B1 level calculated based on average power (Fig. 2d) agrees more closely with that of CW-CEST MRI than that calculated using the average field (data not shown). Specifically, the average power of B1 was defined as while average field was defined as , respectively. Fig. 2e shows that the optimal flip angle was approximately 180°, despite a relatively broad range of exchange rate and chemical shift. In comparison, the optimal pulse duration decreases at high exchange rate and large chemical shift, suggesting higher average power (Fig. 2f). Because the optimal flip angle shows little change for typical exchange rate and chemical shift, the optimal pulse duration for pulse-train CEST MRI can be predicted based on the average power calculation from the optimal B1 level estimated from CW-CEST MRI and an approximate optimal flip angle of 180°.
Fig. 2.

Comparison of CW- and pulse-train CEST MRI simulation. a) Simulated maximal CW-CEST effect for representative exchange rate and chemical shift. b) Optimal B1 level for CW-CEST MRI. c) Simulated maximal pulse-train CEST effect. d) Optimal B1 level for pulse-train CEST based on average power (i.e. ) calculation. e) The optimal flip angle for pulse-train CEST MRI. f) The optimal pulse duration for pulse-train CEST MRI.
Fig. 3 compares pulse-train and CW-CEST MRI, assuming optimal experimental conditions. Fig. 3a shows the pulse-train CEST effect normalized by that of CW-CEST MRI, indicating that whereas pulse-train CEST MRI provides similar CEST effect for the case of slow exchange, it is substantially less effective to measure CEST effect udnergoing relatively fast exchange. We compared the optimal B1 values calculated from average power (Fig. 3b) and average field (Fig. 3c) with that of CW-CEST MRI. We further performed two-sample Kolmogorov-Smirnov test to compare pulse-train and CW-CEST MRI. It showed that the optimal B1 calculated from the average field is different from that of CW-CEST MRI (B1_AF and B1_CW, P value of Kolmogorov-Smirnov test < 0.05) while the optimal B1 calculated from the average power showed non-significant difference from that of CW-CEST MRI (B1_AP and B1_CW, P > 0.05). Because images are highly structured and the pixels may exhibit non-negligible dependencies, we calculated structural similarity index (SSIM) to compare the similarity between variant CEST imaging schemes (Zhou et al., 2004b). The SSIM between optimal B1 of pulse-train calculated from the average power and that of CW-CEST MRI (B1_AP and B1_CW) was 0.97±0.01, substantially higher than that of average field (0.69±0.03, P<0.01, paired-t test). This is consistent with the findings of Zu et al, who showed that average power calculation allows more accurate predication of pulse-train CEST MRI than average field estimation (Zu et al., 2011; Sun et al., 2011c).
Fig. 3.
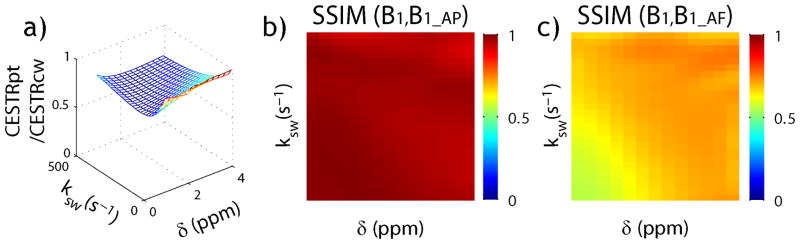
Comparison of simulated optimal CW- and pulse-train CEST MRI effects. a) Pulse-train CEST effect normalized by CW-CEST effect. b) Structural similarity index (SSIM) of optimal B1 levels between pulse-train and CW-CEST MRI, calculated from the average power. c) SSIM analysis of optimal B1 level between pulse-train and CW-CEST MRI, calculated from the average field.
Because of the substantial gain in the computation speed, we applied the fast numerical simulation algorithm to quantify the underlying CEST system. Specifically, Fig. 4a shows CW-CEST asymmetry plots for pH of 6.0 and 6.6 under three representative B1 levels of 0.5, 0.75 and 1 μT. We simultaneously fit all CEST asymmetry plots from 1 to 3 ppm, around the creatine labile proton chemical shift of 1.9 ppm. The fitting took approximately 10 s and the coefficient of determination (R2) was 0.98. We found labile proton exchange rate being 23 and 76 s−1 for pH of 6.0 and 6.6, respectively. In addition, the labile proton ratio with respect to bulk water was found to be 1:909 with T2s=11.7 ms. Fig. 4b shows numerical fitting of pulse-train CEST MRI, with pulse duration being 20, 25 and 30 ms for a flip angle of 180°. We found ksw being 23 and 84 s−1 for pH of 6.0 and 6.6, respectively. In addition, the labile proton ratio with respect to bulk water was found to be 1:909 with T2s=10.3 ms (R2=0.93). The fitting took approximately 4.6 min, significantly longer than that of CW-CEST MRI yet substantially faster than the conventional simulation approach. Importantly, the fitting results are in good agreement with those determined from CW-CEST MRI (Table 1).
Fig. 4.

Quantification of CW and pulse-train CEST MRI. (a) Numerical fitting of CW-CEST asymmetry spectra from both pH compartments obtained under three B1 levels of 0.5, 0.75 and 1 μT. (b) Numerical fitting of pulse-train asymmetry spectra from both pH compartments obtained under three representative pulse irradiation durations of 20, 25 and 30 ms, for a flip angle of 180° with an RF duty cycle of 50%. Error bars represent the standard deviation of experimental measurements for each pH compartment.
Table 1.
Numerical determination of relaxation, labile proton ratio and exchange rate from fitting CW-CEST and pulse-train CEST measurement from the Creatine-gel phantom.
| T2s (ms) | fs | ksw (pH=6.0) | ksw (pH=6.6) | R2 | |
|---|---|---|---|---|---|
| CW-CEST MRI fitting | 11.7 | 1:909 | 23 | 76 | 0.98 |
| Pulse-train CEST MRI fitting | 10.3 | 1:909 | 23 | 84 | 0.93 |
We further determined the optimal experimental parameters for creatine agarose pH phantom using the fast simulation algorithm and verified it experimentally. Fig. 5a and 5b show simulated and experimentally obtained pH-weighted contrast (ΔCESTR=CESTR(pH=6.6)-CESTR(pH=6.0)) as a function of RF flip angle and pulse duration. Both the simulation and experiment showed that ΔCESTR peaked around flip angle of 180° and pulse duration of 20 ms. The Kolmogorov-Smirnov test of the simulation and experiment results showed non-significant difference (P>0.05). In addition, SSIM was calculated to compare the dependence of ΔCESTR on RF pulse flip angle and duration from fast numerical simulation and experiment, being 0.98±0.01, indicating good agreement (Fig. 5c). This demonstrates that the proposed fast numerical simulation indeed facilitates optimization of the pulse-train CEST MRI.
Fig. 5.
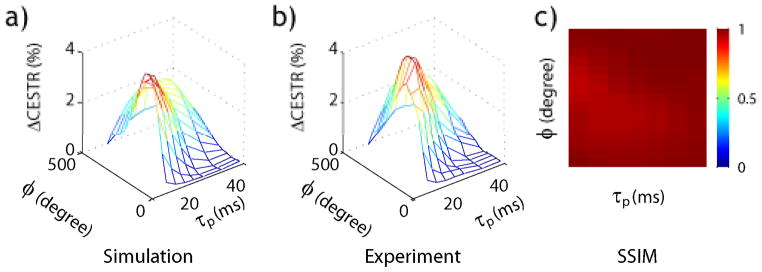
Comparison of simulation and experimental optimization of pulse-train CEST MRI. (a) Simulated pH-weighted CEST contrast (ΔCESTR=CESTR(pH=6.6)-CESTR(pH=6.0)) as a function of RF flip angle and pulse duration. (b) Experimentally obtained ΔCESTR as a function of RF flip angle and pulse duration. (c) Structural similarity index between simulated and experimentally obtained pH-weighted CEST contrast as a function of RF pulse flip angle and pulse duration.
5. Discussion
Our study developed a fast numerical solution for optimization and quantification of pulse-train CEST MRI. Because of the use of iterative matrix algorithm, the simulation is substantially faster than the conventional numerical simulation approach. In addition, both labile proton concentration and exchange rate can be numerically determined from pulse-train CEST MRI, in good agreement with those estimated from quantitative CW-CEST MRI. This represents notable progress from conventional qualitative CEST-weighted MRI toward quantitative pulse-train CEST imaging. This is important because the simplistic CEST-weighted asymmetry analysis is susceptible to concomitant changes in relaxation, magnetization transfer, nuclear overhauser effect and experimental conditions (Jin et al., 2013; Jones et al., 2013; Zaiss et al., 2014). Herein our work enables quantification of pulse-train CEST MRI so that both the protein/peptide level and physiochemical properties can be solved to better characterize the underlying CEST system.
Chemical exchange spin locking (CESL) mechanism has been recently developed to complement CEST MRI, which has been shown advantageous in monitoring intermediate chemical exchange (Jin et al., 2012). Notably, for moderate RF power levels, the optimal saturation time is substantially less than what takes to reach the steady state (Jin et al., 2011; Murase, 2012). To test the saturation time effect on CEST imaging, we further applied the proposed iterative matrix simulation approach to simulate and optimize non-steady pulse-train CEST imaging. For example, Fig. 6a shows that for labile protons closer to bulk water resonance (ksw=250 s−1 and δ= 1 ppm at 4.7 T), the CEST effect obtained from the weak RF power level (small flip angle) increases and plateaus at long irradiation time. On the other hand, the CEST effect under optimal or higher flip angles peaks at an intermediate saturation time. This is similar to that observed in CESL experiments in that the optimal RF saturation duration decreases with RF power level. Fig. 6b shows that the optimal irradiation time decreases at high exchange rate and small chemical shift, likely because under such conditions, saturation transfer is more efficient than concomitant direct RF saturation (spillover) effects.
Fig. 6.
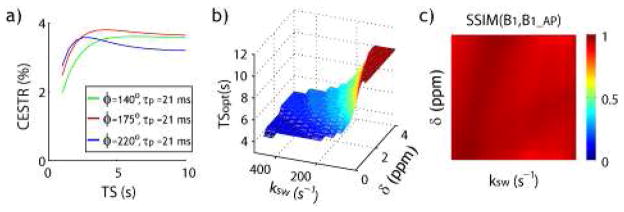
Evaluation of the dependence of pulse-train CEST effect on RF saturation time. a) CEST effect from weak RF power level increases and plateaus with irradiation time. However, CEST effect under optimal pulse-train CEST MRI conditions peaks at an intermediate saturation time. b) Optimal saturation duration of pulse-train CEST MRI as a function of labile proton chemical shift and exchange rate. c) Structural similarity index of the optimal RF irradiation level between simulated optimal pulse-train and CW-CEST MRI as a function of labile proton chemical shift and exchange rate.
The optimal experimental conditions for pulse-train CEST MRI depend on multiple parameters, including pulse shape, duration, flip angle, duty cycle and the total saturation time. Although a high RF duty cycle is preferred, it is often limited on scanners due to power deposition and hardware limits. In addition, the saturation time needs to be optimized in order to obtain CEST effect under reasonable scan time (Sun et al., 2013a). Therefore, it is important to develop fast numerical simulation to systematically optimize pulse-train CEST MRI under experimental constraints. Our prior study showed that for slow chemical exchange, the optimal B1 level for pulse-train CEST MRI calculated from average field is reasonably close to that of CW-CEST MRI, providing similar CEST effect. Our current study showed that B1 level calculated from the average power provides more accurate estimation than that from average field for a relatively broad range of exchange rate and chemical shift, consistent with the findings of Zu et al. (Zu et al., 2011). Because the optimal B1 level for CW-CEST MRI can be predicted reasonably well, the average power-based B1 calculation substantially simplifies pulse-train CEST MRI optimization. It is necessary to note that the proposed fast simulation algorithm can be easily extended for describing multi-pool pulse-train CEST MRI.
6. Conclusions
Our study developed an iterative matrix algorithm for fast simulation of pulse-train CEST MRI, resulting in substantially gain in computation speed. Both the labile proton concentration and exchange rate can be determined from quantitative pulse-train CEST MRI, in good agreement with those estimated from CW-CEST MRI. Importantly, the development of efficient simulation routine enables optimization and quantification of pulse-train CEST MRI, aiding translational studies.
Acknowledgments
This study was supported in part by grants from NSFGD S2013010013372 (Xiao G), NSFC 30930027 (Wu RH), NIH/NIBIB 1K01EB009771 (Sun PZ) and NIH/NINDS 1R01NS083654 (Sun PZ).
References
- Aime S, Barge A, Delli Castelli D, Fedeli F, Mortillaro A, Nielsen FU, Terreno E. Paramagnetic Lanthanide(III) complexes as pH-sensitive chemical exchange saturation transfer (CEST) contrast agents for MRI applications. Magn Reson Med. 2002;47:639–48. doi: 10.1002/mrm.10106. [DOI] [PubMed] [Google Scholar]
- Cai K, Haris M, Singh A, Kogan F, Greenberg JH, Hariharan H, Detre JA, Reddy R. Magnetic resonance imaging of glutamate. Nat Med. 2012;18:302–6. doi: 10.1038/nm.2615. [DOI] [PMC free article] [PubMed] [Google Scholar]
- Chan KWY, Liu G, Song X, Kim H, Yu T, Arifin DR, Gilad AA, Hanes J, Walczak P, van Zijl PCM, Bulte JWM, McMahon MT. MRI-detectable pH nanosensors incorporated into hydrogels for in vivo sensing of transplanted-cell viability. Nat Mater. 2013;12:268–75. doi: 10.1038/nmat3525. [DOI] [PMC free article] [PubMed] [Google Scholar]
- Dula AN, Asche EM, Landman BA, Welch EB, Pawate S, Sriram S, Gore JC, Smith SA. Development of chemical exchange saturation transfer at 7T. Magn Reson Med. 2012;66:831–8. doi: 10.1002/mrm.22862. [DOI] [PMC free article] [PubMed] [Google Scholar]
- Jia G, Abaza R, Williams JD, Zynger DL, Zhou J, Shah ZK, Patel M, Sammet S, Wei L, Bahnson RR, Knopp MV. Amide proton transfer MR imaging of prostate cancer: A preliminary study. J Magn Reson Imaging. 2011;33:647–54. doi: 10.1002/jmri.22480. [DOI] [PMC free article] [PubMed] [Google Scholar]
- Jin T, Autio J, Obata T, Kim S-G. Spin-locking versus chemical exchange saturation transfer MRI for investigating chemical exchange process between water and labile metabolite protons. Magn Reson Med. 2011;65:1448–60. doi: 10.1002/mrm.22721. [DOI] [PMC free article] [PubMed] [Google Scholar]
- Jin T, Wang P, Zong X, Kim S-G. Magnetic resonance imaging of the Amine Proton EXchange (APEX) dependent contrast. NeuroImage. 2012;16:1218–27. doi: 10.1016/j.neuroimage.2011.08.014. [DOI] [PMC free article] [PubMed] [Google Scholar]
- Jin T, Wang P, Zong X, Kim S-G. MR imaging of the amide-proton transfer effect and the pH-insensitive nuclear overhauser effect at 9.4 T. Magn Reson Med. 2013;69:760–70. doi: 10.1002/mrm.24315. [DOI] [PMC free article] [PubMed] [Google Scholar]
- Jones CK, Huang A, Xu J, Edden RAE, Schar M, Hua J, Oskolkov N, Zaca D, Zhou J, McMahon MT, Pillai JJ, van Zijl PCM. Nuclear Overhauser enhancement (NOE) imaging in the human brain at 7 T. NeuroImage. 2013;77:114–24. doi: 10.1016/j.neuroimage.2013.03.047. [DOI] [PMC free article] [PubMed] [Google Scholar]
- Kim M, Gillen J, Landman BA, Zhou J, van Zijl PCM. Water saturation shift referencing (WASSR) for chemical exchange saturation transfer (CEST) experiments. Magn Reson Med. 2009;61:1441–50. doi: 10.1002/mrm.21873. [DOI] [PMC free article] [PubMed] [Google Scholar]
- Li AX, Hudson RHE, Barrett JW, Johns CK, Pasternak SH, Bartha R. Four-pool modeling of proton exchange processes in biological systems in the presence of MRI-paramagnetic chemical exchange saturation transfer (PARACEST) agents. Magn Reson Med. 2008;60:1197–206. doi: 10.1002/mrm.21752. [DOI] [PubMed] [Google Scholar]
- Liu G, Li Y, Sheth VR, Pagel MD. Imaging In Vivo Extracellular pH with a Single Paramagnetic Chemical Exchange Saturation Transfer Magnetic Resonance Imaging Contrast Agent. Molecular Imaging. 2012;11:47–57. [PMC free article] [PubMed] [Google Scholar]
- Longo DL, Busato A, Lanzardo S, Antico F, Aime S. Imaging the pH evolution of an acute kidney injury model by means of iopamidol, a MRI-CEST pH-responsive contrast agent. Magn Reson Med. 2012;70:859–64. doi: 10.1002/mrm.24513. [DOI] [PubMed] [Google Scholar]
- Longo DL, Sun PZ, Consolino L, Michelotti FC, Uggeri F, Aime S. A General MRI-CEST Ratiometric Approach for pH Imaging: Demonstration of in Vivo pH Mapping with Iobitridol. J Am Chem Soc. 2014;136:14333–6. doi: 10.1021/ja5059313. [DOI] [PMC free article] [PubMed] [Google Scholar]
- McMahon M, Gilad A, Zhou J, Sun PZ, Bulte J, van Zijl PC. Quantifying exchange rates in chemical exchange saturation transfer agents using the saturation time and saturation power dependencies of the magnetization transfer effect on the magnetic resonance imaging signal (QUEST and QUESP): Ph calibration for poly-L-lysine and a starburst dendrimer. Magn Reson Med. 2006;55:836–47. doi: 10.1002/mrm.20818. [DOI] [PMC free article] [PubMed] [Google Scholar]
- McVicar N, Li AX, Goncalves DF, Bellyou M, Meakin SO, Prado MAM, Bartha R. Quantitative tissue pH measurement during cerebral ischemia using amine and amide concentration-independent detection (AACID) with MRI. J Cereb Blood Flow Metab. 2014;34:690–8. doi: 10.1038/jcbfm.2014.12. [DOI] [PMC free article] [PubMed] [Google Scholar]
- Murase K. Behavior of the magnetization in spin-locking magnetic resonance imaging using numerical solutions to the time-dependent Bloch equations. Phys Med Biol. 2012;57:481–92. doi: 10.1088/0031-9155/57/23/N481. [DOI] [PubMed] [Google Scholar]
- Murase K, Tanki N. Numerical solutions to the time-dependent Bloch equations revisited. Magn Reson Imaging. 2011;29:126–31. doi: 10.1016/j.mri.2010.07.003. [DOI] [PubMed] [Google Scholar]
- Shah T, Lu L, Dell KM, Pagel MD, Griswold MA, Flask CA. CEST-FISP: A novel technique for rapid chemical exchange saturation transfer MRI at 7 T. Magn Reson Med. 2011;65:432–7. doi: 10.1002/mrm.22637. [DOI] [PMC free article] [PubMed] [Google Scholar]
- Sun PZ. Simplified and scalable numerical solution for describing multi-pool chemical exchange saturation transfer (CEST) MRI contrast. J Magn Reson. 2010;205:235–41. doi: 10.1016/j.jmr.2010.05.004. [DOI] [PMC free article] [PubMed] [Google Scholar]
- Sun PZ, Benner T, Kumar A, Sorensen AG. Investigation of optimizing and translating pH-sensitive pulsed-chemical exchange saturation transfer (CEST) imaging to a 3T clinical scanner. Magn Reson Med. 2008;60:834–41. doi: 10.1002/mrm.21714. [DOI] [PMC free article] [PubMed] [Google Scholar]
- Sun PZ, Cheung JS, Wang E, Benner T, Sorensen AG. Fast multi-slice pH-weighted chemical exchange saturation transfer (CEST) MRI with unevenly segmented RF irradiation. Magn Reson Med. 2011a;65:588–94. doi: 10.1002/mrm.22628. [DOI] [PMC free article] [PubMed] [Google Scholar]
- Sun PZ, Cheung JS, Wang EF, Lo EH. Association between pH-weighted endogenous amide proton chemical exchange saturation transfer MRI and tissue lactic acidosis during acute ischemic stroke. J Cereb Blood Flow Metab. 2011b;31:1743–50. doi: 10.1038/jcbfm.2011.23. [DOI] [PMC free article] [PubMed] [Google Scholar]
- Sun PZ, Farrar CT, Sorensen AG. Correction for artifacts induced by B0 and B1 field inhomogeneities in pH-sensitive chemical exchange saturation transfer (CEST) imaging. Magn Reson Med. 2007a;58:1207–15. doi: 10.1002/mrm.21398. [DOI] [PubMed] [Google Scholar]
- Sun PZ, Lu J, Wu Y, Xiao G, Wu R. Evaluation of the dependence of CEST-EPI measurement on repetition time, RF irradiation duty cycle and imaging flip angle for enhanced pH sensitivity. Phys Med Biol. 2013a;58:N229–N40. doi: 10.1088/0031-9155/58/17/N229. [DOI] [PMC free article] [PubMed] [Google Scholar]
- Sun PZ, Sorensen AG. Imaging pH using the chemical exchange saturation transfer (CEST) MRI: correction of concomitant RF irradiation effects to quantify CEST MRI for chemical exchange rate and pH. Magn Reson Med. 2008;60:390–7. doi: 10.1002/mrm.21653. [DOI] [PubMed] [Google Scholar]
- Sun PZ, van Zijl PCM, Zhou J. Optimization of the irradiation power in chemical exchange dependent saturation transfer experiments. J Magn Reson. 2005;175:193–200. doi: 10.1016/j.jmr.2005.04.005. [DOI] [PubMed] [Google Scholar]
- Sun PZ, Wang E, Cheung JS. Imaging acute ischemic tissue acidosis with pH-sensitive endogenous amide proton transfer (APT) MRI – Correction of tissue relaxation and concomitant RF irradiation effects toward mapping quantitative cerebral tissue pH. Neuroimage. 2012;60:1–6. doi: 10.1016/j.neuroimage.2011.11.091. [DOI] [PMC free article] [PubMed] [Google Scholar]
- Sun PZ, Wang E, Cheung JS, Zhang X, Benner T, Sorensen AG. Simulation and optimization of pulsed radio frequency (RF) irradiation scheme for chemical exchange saturation transfer (CEST) MRI – demonstration of pH-weighted pulsed-amide proton CEST MRI in an animal model of acute cerebral ischemia. Magn Reson Med. 2011c;66:1042–8. doi: 10.1002/mrm.22894. [DOI] [PMC free article] [PubMed] [Google Scholar]
- Sun PZ, Wang Y, Dai Z, Xiao G, Wu R. Quantitative chemical exchange saturation transfer (qCEST) MRI - RF spillover effect-corrected omega plot for simultaneous determination of labile proton fraction ratio and exchange rate. Contrast Media Mol Imaging. 2014a;9:268–75. doi: 10.1002/cmmi.1569. [DOI] [PMC free article] [PubMed] [Google Scholar]
- Sun PZ, Wang Y, Lu J. Sensitivity-enhanced chemical exchange saturation transfer (CEST) MRI with least squares optimization of Carr Purcell Meiboom Gill multi-echo echo planar imaging. Contrast Media Mol Imaging. 2014b;9:177–81. doi: 10.1002/cmmi.1546. [DOI] [PMC free article] [PubMed] [Google Scholar]
- Sun PZ, Wang Y, Xiao G, Wu R. Simultaneous experimental determination of labile proton fraction ratio and exchange rate with irradiation radio frequency power-dependent quantitative CEST MRI analysis. Contrast Media Mol Imaging. 2013b;8:246–51. doi: 10.1002/cmmi.1524. [DOI] [PMC free article] [PubMed] [Google Scholar]
- Sun PZ, Zhou J, Sun W, Huang J, van Zijl PC. Detection of the ischemic penumbra using pHweighted MRI. J Cereb Blood Flow Metab. 2007b;27:1129–36. doi: 10.1038/sj.jcbfm.9600424. [DOI] [PubMed] [Google Scholar]
- Tee YK, Khrapitchev AA, Sibson NR, Payne SJ, Chappell MA. Optimal sampling schedule for chemical exchange saturation transfer. Magn Reson Med. 2013;70:1251–62. doi: 10.1002/mrm.24567. [DOI] [PubMed] [Google Scholar]
- van Zijl PCM, Jones CK, Ren J, Malloy CR, Sherry AD. MRI detection of glycogen in vivo by using chemical exchange saturation transfer imaging (glycoCEST) Proc Natl Acad Sci U S A. 2007;104:4359–64. doi: 10.1073/pnas.0700281104. [DOI] [PMC free article] [PubMed] [Google Scholar]
- Ward KM, Aletras AH, Balaban RS. A new class of contrast agents for MRI based on proton chemical exchange dependent saturation transfer (CEST) J Magn Reson. 2000;143:79–87. doi: 10.1006/jmre.1999.1956. [DOI] [PubMed] [Google Scholar]
- Woessner DE, Zhang S, Merritt ME, Sherry AD. Numerical solution of the Bloch equations provides insights into the optimum design of PARACEST agents for MRI. Magn Reson Med. 2005;53:790–9. doi: 10.1002/mrm.20408. [DOI] [PubMed] [Google Scholar]
- Wu R, Liu C, Liu P, Sun PZ. Improved measurement of labile proton concentration-weighted chemical exchange rate (kws) with experimental factor-compensated and T1-normalized quantitative chemical exchange saturation transfer (CEST) MRI. Contrast Media Mol Imaging. 2012;7:384–9. doi: 10.1002/cmmi.505. [DOI] [PMC free article] [PubMed] [Google Scholar]
- Yoo B, Raam MS, Rosenblum RM, Pagel MD. Enzyme-responsive PARACEST MRI contrast agents: a new biomedical imaging approach for studies of the proteasome. Contrast Media Mol Imaging. 2007;2:189–98. doi: 10.1002/cmmi.145. [DOI] [PubMed] [Google Scholar]
- Yuan J, Zhang Q, Wang Y-X, Wei J, Zhou J. Accuracy and uncertainty of asymmetric magnetization transfer ratio quantification for amide proton transfer (APT) imaging at 3T: A Monte Carlo study. Conf Proc IEEE Eng Med Biol Soc. 2013:5139–42. doi: 10.1109/EMBC.2013.6610705. [DOI] [PMC free article] [PubMed] [Google Scholar]
- Zaiss M, Bachert P. Exchange-dependent relaxation in the rotating frame for slow and intermediate exchange – modeling off-resonant spin-lock and chemical exchange saturation transfer. NMR Biomed. 2013;26:507–18. doi: 10.1002/nbm.2887. [DOI] [PubMed] [Google Scholar]
- Zaiss M, Xu J, Goerke S, Khan IS, Singer RJ, Gore JC, Gochberg DF, Bachert P. Inverse Z-spectrum analysis for spillover-, MT-, and T1-corrected steady-state pulsed CEST-MRI – application to pH-weighted MRI of acute stroke. NMR Biomed. 2014;27:240–52. doi: 10.1002/nbm.3054. [DOI] [PMC free article] [PubMed] [Google Scholar]
- Zhou J, Payen JF, Wilson DA, Traystman RJ, van Zijl PC. Using the amide proton signals of intracellular proteins and peptides to detect pH effects in MRI. Nat Med. 2003;9:1085–90. doi: 10.1038/nm907. [DOI] [PubMed] [Google Scholar]
- Zhou J, Tryggestad E, Wen Z, Lal B, Zhou T, Grossman R, Wang S, Yan K, Fu D-X, Ford E, Tyler B, Blakeley J, Laterra J, van Zijl PCM. Differentiation between glioma and radiation necrosis using molecular magnetic resonance imaging of endogenous proteins and peptides. Nat Med. 2011;17:130–4. doi: 10.1038/nm.2268. [DOI] [PMC free article] [PubMed] [Google Scholar]
- Zhou J, Wilson DA, Sun PZ, Klaus JA, van Zijl PCM. Quantitative description of proton exchange processes between water and endogenous and exogenous agents for WEX, CEST, and APT experiments. Magn Reson Med. 2004a;51:945–52. doi: 10.1002/mrm.20048. [DOI] [PubMed] [Google Scholar]
- Zhou W, Bovik AC, Sheikh HR, Simoncelli EP. Image quality assessment: from error visibility to structural similarity. IEEE Trans Image Process. 2004b;13:600–12. doi: 10.1109/tip.2003.819861. [DOI] [PubMed] [Google Scholar]
- Zhu H, Jones CK, van Zijl PCM, Barker PB, Zhou J. Fast 3D chemical exchange saturation transfer (CEST) imaging of the human brain. Magn Reson Med. 2010;64:638–44. doi: 10.1002/mrm.22546. [DOI] [PMC free article] [PubMed] [Google Scholar]
- Zu Z, Janve VA, Xu J, Does MD, Gore JC, Gochberg DF. A new method for detecting exchanging amide protons using chemical exchange rotation transfer. Magn Reson Med. 2013;69:637–47. doi: 10.1002/mrm.24284. [DOI] [PMC free article] [PubMed] [Google Scholar]
- Zu Z, Li K, Janve VA, Does MD, Gochberg DF. Optimizing pulsed-chemical exchange saturation transfer imaging sequences. Magn Reson Med. 2011;66:1100–8. doi: 10.1002/mrm.22884. [DOI] [PMC free article] [PubMed] [Google Scholar]