

Abstract
Background:
Use of microfracture in the knees of National Basketball Association (NBA) players is controversial.
Hypotheses:
(1) There would be a high rate of return to sport (RTS) in NBA players following microfracture, (2) players would RTS the season following surgery, (3) preoperative player performance would not be significantly different on RTS, and (4) there would be no significant difference in RTS rate or postoperative performance in players undergoing microfracture in comparison with an age-, position-, NBA experience–, and performance-matched control group.
Study Design:
Cohort study; Level of evidence, 3.
Methods:
NBA players undergoing microfracture were evaluated. Age-, body mass index–, position-, NBA experience–, and performance-matched controls were selected from the NBA during the same years as those undergoing microfracture. An index year was selected (controls) to match the number of seasons of NBA experience in microfracture cases. RTS and performance were analyzed and compared between cases and controls. Student t tests were performed for analysis of within- and between-group variables.
Results:
A total of 41 NBA players underwent microfracture and were compared with 41 demographic- and performance-matched controls. Rate of RTS after microfracture was 73% in the NBA and 83% in professional basketball (NBA, D-league, and International Basketball Federation [FIBA]). Time to RTS in NBA was 9.20 ± 4.88 months. Seventy-one percent (29/41) of players RTS the season following microfracture. Length of NBA career following microfracture (4.10 ± 3.91 years) was not significantly different from controls. After microfracture, case athletes played fewer games per season and with fewer points and steals per game (relative to premicrofracture; P < .05). Performance was better in control (after index year) versus case players (after microfracture) with regard to points per game, games played per season, and field goal and free throw percentage (P < .05).
Conclusion:
Eighty-three percent of NBA players undergoing microfracture returned to professional basketball. Career length was not significantly different between players undergoing microfracture and controls. However, following microfracture, players competed in fewer games per season with fewer points and steals.
Keywords: microfracture, knee, articular cartilage, NBA, basketball
Microfracture is a commonly utilized marrow stimulation cartilage repair technique in the knee. The procedure was developed in the early 1980s through the pioneering work of Dr Richard Steadman.31,34 Since then, microfracture has been widely adopted as an efficacious, first-line, cost-effective surgical treatment for full-thickness articular cartilage defects of the knee. Although claims of lack of durability at mid-term follow-up due to fibrocartilage repair are noteworthy,4,12–14,23,25,26 short- and long-term clinical outcomes have been successful even in elite athletes.32,33 Key technical aspects of microfracture include addressing all other patient-specific (eg, age, body mass index, smoking status, activity/sports level),3,14,21 limb- and knee-specific (eg, coronal plane and patellofemoral alignment, ligamentous and meniscal status),16,36 and defect-specific (eg, size, shape, location, chronicity, subchondral bone involvement)9,10,35 factors.
In the context of the issues surrounding surgical treatment of any knee problem in athletes, several factors play a role. These include timing of surgery (eg, in- or off-season and stage of athlete’s career), level of sport (eg, high school, collegiate, professional), scholarship/contract status, and opinions of those involved in the athlete’s care (eg, team owner/manager, coaches, trainers, teammates). Outcomes of knee surgery have been widely publicized recently in professional athletes regarding anterior cruciate ligament reconstruction5 and microfracture.33 Given the frequency with which chondral defects are identified in professional athletes’ knees11,22,37 and the length of time required to rehabilitate following surgery14 and the subsequent implications (time lost to team, scholarship/contract), it is vital to carefully and appropriately select the correct surgical technique in this subset of patients. Prior reports of microfracture in National Basketball Association (NBA) players in the United States have demonstrated a 67% to 79% rate of return to sport in the NBA, with decreased performance and minutes played per game in comparison to controls.6,28
The purposes of this investigation were to determine (1) return to sport (RTS) rate in NBA following microfracture, (2) timing of RTS, (3) performance on RTS, and (4) the difference in RTS and performance between players who underwent microfracture and controls. The authors hypothesized that (1) there would be a high rate of RTS in NBA players following microfracture, (2) players would RTS the season following surgery, (3) preoperative player performance would not be significantly different on RTS, and (4) there would be no significant difference in RTS rate or postoperative performance in players undergoing microfracture in comparison to an age-, position-, NBA experience–, and performance-matched control group.
Materials and Methods
Players in the NBA who underwent microfracture for chondral defects in the knee between years 1985 and 2012 were evaluated. Players were identified through NBA team websites, publically available Internet-based injury reports, player profiles and biographies, and press releases, thus precluding formal institutional review board approval. This search method has been utilized in prior studies.1,2,6,8,15,27–29 In 2 prior similar NBA microfracture studies, 24 players were analyzed.6,28 Although the names of these athletes were not made known in those studies, it is likely that many of those players were included in the current investigation. The search was performed by 2 orthopaedic surgery residents with validation of the findings by an orthopaedic surgery sports medicine fellow and the senior author. The search was performed on February 25, 2013, for all NBA teams and all players. Thus, players who underwent microfracture after February 25, 2012, were excluded from this investigation because they had a <1-year opportunity to RTS. All players identified were included in this study as it related to RTS rate. A player was deemed to have RTS in the NBA if he played in at least 1 NBA game following surgery. Secondarily, RTS in other leagues was also analyzed: RTS in any game in either the NBA D-league or International Basketball Federation (FIBA) after surgery. A player did not successfully RTS if he failed to meet any of the aforementioned criteria. Subject inclusion criteria were any male NBA player undergoing microfracture of the knee on the femoral condyles, patella, or trochlea. Players with concomitant knee injuries, when known, were not excluded (eg, cruciate or collateral ligament injury, meniscal injury). Exclusion criteria were any female (Women’s NBA [WNBA]) basketball player or microfracture of any joint other than the knee.
Between 1985 and 2012, 41 players in the NBA were identified who had undergone microfracture in the knee. Demographic data were collected: age at time of microfracture, body mass index (BMI) (kg/m2), position (guard, forward, center), knee side (left or right), “All-Star” status, games played per season, seasons played in NBA, annual salary, and RTS timing (months, season). Performance data collected included: minutes per game, points per game, rebounds per game, assists per game, steals per game, blocks per game, field goal percentage, and free throw percentage. In-game performance variables were analyzed both pre- and postmicrofracture collectively and regarding individual years 1 through 5 following microfracture.
A control group was selected to compare the data from the study group with that of the rest of the NBA. Controls were matched in a 1-to-1 ratio to cases based on age (years), BMI, position, years of experience in the NBA, and all performance variables (Table 1). Since microfracture was performed on cases at 6.51 ± 4.54 years into the players’ NBA careers, it was necessary to assign the control group an “index year” at a similar time period (6.51 ± 4.54 years into career; P = .99; 95% confidence interval [CI], –2.03 to 2.03). This index year is the analog to the microfracture year in cases. Assignment of the index year is a procedure utilized in prior NBA studies.6,28 For each individual case player, a matching control player was identified via the following process: The year the case player was drafted or began playing in the league was identified. Then, that year’s draft was examined for an age-, BMI-, position-matched control player. Once these parameters matched, the case player’s performance variables were then matched (minutes, points, assists, rebounds) to the control player for each year up until the microfracture year (“index year” in controls). If there were any differences, that control player was discarded and a new manual search begun. An alternating alphabetical/reverse alphabetical process was utilized (for the first control, the manual search began with players whose last names began with “A,” then “B,” then “C,” and so on; for the second control, the manual search began with players whose last names began with “Z,” then “Y,” then “X,” and so on). The same demographic data and in-game performance data collected in cases (microfracture) were also analyzed in controls pre– and post–index year collectively and regarding individual years 1 through 5 following the index year.
TABLE 1.
Premicrofracture Versus Pre–Index Year Comparisona
| Cases | Controls | P Value (Paired Samples Student t Test) | 95% CI | |
|---|---|---|---|---|
| Seasons of NBA experience | 6.51 ± 4.54 | 6.51 ± 4.54 | .999 | –2.03 to 2.03 |
| Games played per season | 55.4 ± 15.1 | 61.3 ± 15.4 | .109 | −13.0 to 1.38 |
| Games played overall | 394 ± 303 | 472 ± 301 | .283 | −223 to 67.2 |
| Minutes played per game | 27.3 ± 9.22 | 26.3 ± 7.54 | .606 | −2.86 to 4.87 |
| BMI, kg/m2 | 24.7 ± 1.81 | 24.7 ± 1.63 | .999 | −0.810 to 0.810 |
| Age, y | 27.7 ± 4.73 | 27.7 ± 3.52 | .958 | −1.81 to 1.91 |
| Annual salary, millions of US$ | 4.25 ± 4.20 | 4.08 ± 3.36 | .853 | −1.60 to 1.92 |
| Points/game | 12.3 ± 5.81 | 12.2 ± 5.55 | .922 | −2.47 to 2.73 |
| Rebounds/game | 4.75 ± 2.23 | 4.72 ± 2.38 | .953 | −1.02 to 1.09 |
| Assists/game | 2.86 ± 2.69 | 2.78 ± 2.01 | .890 | −1.01 to 1.17 |
| Blocks/game | 0.560 ± 0.504 | 0.515 ± 0.467 | .690 | −0.178 to 0.267 |
| Steals/game | 1.03 ± 0.575 | 0.858 ± 0.436 | .135 | −0.057 to 0.411 |
| Field goal percentage | 0.454 ± 0.039 | 0.446 ± 0.037 | .353 | −0.009 to 0.026 |
| Free throw percentage | 0.754 ± 0.079 | 0.752 ± 0.077 | .900 | −0.033 to 0.038 |
| Players selected as “All-Stars,” n | 12 | 15 | .482 | −0.277 to 0.131 |
aValues are expressed as mean ± standard deviation unless otherwise indicated. NBA, National Basketball Association; BMI, body mass index; CI, confidence interval.
Single-variable analyses for all continuous data (performance measures) within groups were compared via Student t tests. One-sample Kolmogorov-Smirnov goodness-of-fit tests for Gaussian normal data distribution were performed and confirmed normality of all data. Comparisons were made between cases and controls for survival in NBA and each individual parameter’s overall mean (all years before and after microfracture [or index year, for controls] and each individual year [up to 5 years] following microfracture [or index year, for controls]). All statistical analysis was performed using PASW Statistics Student Version 18.0.0 (IBM, Armonk, New York, USA).
Results
Forty-one NBA players having undergone microfracture were identified for analysis (Table 2). Players were 27.7 ± 4.73 years of age, with 6.51 ± 4.54 years of experience in the NBA prior to microfracture. Follow-up after microfracture was 4.10 ± 3.91 years. There were 22 forwards, 15 guards, and 4 centers. Sixty-one percent (28 knees) of knees treated were on the right side, while 39% (17 knees) were left-sided (3 players underwent bilateral knee microfractures and 2 players underwent revision microfracture to the same knee). Twenty-five (56%) microfractures were performed in-season, 15 (33%) performed off-season, and the timing of 5 microfractures (11%) were unable to be determined. Intra-articular defect location and concomitant injuries (eg, meniscus, alignment, ligament) were unable to be identified. The rate of revision microfracture was 5%.
TABLE 2.
Performance Comparison (Cases) Before and After Microfracturea
| Before | After | P Value (Paired Samples Student t Test) | 95% CI | |
|---|---|---|---|---|
| Seasons of NBA experience | 6.51 ± 4.54 | 4.10 ± 3.91 | .036 | 0.161 to 4.67 |
| Games played per season | 55.4 ± 15.1 | 44.3 ± 25.2 | .027 | 1.32 to 20.9 |
| Games played overall | 394 ± 303 | 224 ± 236 | .012 | 35.9 to 276 |
| Minutes played per game | 27.3 ± 9.22 | 23.2 ± 12.6 | .175 | −1.62 to 8.75 |
| Points/game | 12.3 ± 5.81 | 8.92 ± 5.25 | .015 | 0.664 to 6.01 |
| Rebounds/game | 4.75 ± 2.23 | 4.10 ± 2.61 | .259 | −0.492 to 1.89 |
| Assists/game | 2.86 ± 2.69 | 1.86 ± 2.01 | .077 | −0.113 to 2.12 |
| Blocks/game | 0.560 ± 0.504 | 0.494 ± 0.621 | .625 | −0.201 to 0.332 |
| Steals/game | 1.03 ± 0.575 | 0.712 ± 0.425 | .008 | 0.086 to 0.560 |
| Annual salary, millions of US$ | 4.25 ± 4.20 | 6.99 ± 5.44 | .018 | −5.01 to −0.475 |
| Field goal percentage | 0.454 ± 0.039 | 0.417 ± 0.109 | .075 | −0.00393 to −0.0784 |
| Free throw percentage | 0.754 ± 0.079 | 0.683 ± 0.138 | .021 | 0.0104 to 0.123 |
| Players selected as “All-Stars,” n | 12 | 6 | .105 | −0.031 to 0.327 |
aValues are expressed as mean ± standard deviation unless otherwise indicated. NBA, National Basketball Association; CI, confidence interval.
The rate of RTS in professional basketball (NBA, D-league, FIBA) was 83% (34/41). The rate of RTS in the NBA was 73% (30/41). Four players returned to sport in the D-league. Time to RTS in next NBA game was 9.20 ± 4.88 months. Seventy-one percent (29/41) of players were able to RTS in the season following microfracture. Performance on RTS after microfracture was significantly declined versus premicrofracture in points and steals per game and free throw percentage (Table 2). Furthermore, following microfracture, players played significantly fewer seasons, fewer games overall, and fewer games per season versus premicrofracture. The BMI of players able to RTS (24.7 ± 1.88 kg/m2) was not significantly different than the BMI of those players unable to RTS (24.7 ± 1.55 kg/m2). Players able to RTS (26.6 ± 4.32 years) were younger than players unable to RTS (30.6 ± 5.26 years); however, the difference was not significant (P = .059). There were 5 guards (33%), 1 forward (4.5%), and 1 center (25%) unable to RTS. Of those subjects able to RTS following microfracture, all but 7 players were able to play at least 50 games and all but 6 players were able to play at least 1 season (Figure 1).
Figure 1.
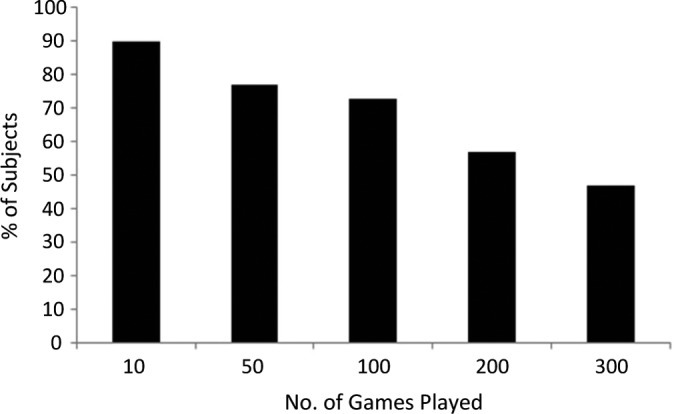
Percentage of subjects able to play at least X number of games in the National Basketball Association (NBA) on return to sport (RTS).
Forty-one control NBA players were not significantly different from the microfracture cases in any demographic or performance variable (Table 1). There were 22 forwards, 15 guards, and 4 centers analyzed. Following the index year, the controls were not significantly different versus pre–index year in any performance variable (Table 3).
TABLE 3.
Performance Comparison (Controls) Before and After Index Yeara
| Before | After | P Value (Paired Samples Student t Test) | 95% CI | |
|---|---|---|---|---|
| Seasons of NBA experience | 6.51 ± 4.54 | 5.05 ± 3.43 | .207 | −0.844 to 3.77 |
| Games played per season | 61.3 ± 15.4 | 59.5 ± 11.4 | .306 | −3.08 to 9.66 |
| Games played | 472 ± 301 | 308 ± 244 | .156 | −43.3 to 262 |
| Minutes/game | 26.3 ± 7.54 | 26.7 ± 7.90 | .831 | −4.02 to 3.24 |
| Points/game | 12.2 ± 5.55 | 12.2 ± 6.62 | .994 | −2.88 to 2.85 |
| Rebounds/game | 4.72 ± 2.38 | 4.46 ± 2.45 | .650 | −0.877 to 1.40 |
| Assists/game | 2.78 ± 2.01 | 2.68 ± 2.31 | .841 | −0.913 to 1.12 |
| Blocks/game | 0.515 ± 0.467 | 0.474 ± 0.415 | .694 | −0.167 to 0.249 |
| Steals/game | 0.858 ± 0.436 | 0.830 ± 0.467 | .795 | −0.186 to 0.242 |
| Annual salary, millions of US$ | 4.08 ± 3.36 | 7.58 ± 5.57 | .003 | −5.77 to −1.23 |
| Field goal percentage | 0.446 ± 0.037 | 0.467 ± 0.074 | .167 | −0.047 to 0.008 |
| Free throw percentage | 0.752 ± 0.077 | 0.761 ± 0.087 | .653 | −0.047 to 0.030 |
| Players selected as “All-Stars,” n | 15 | 13 | .640 | −0.156 to 0.254 |
aValues are expressed as mean ± standard deviation unless otherwise indicated. NBA, National Basketball Association; CI, confidence interval.
Survival in the NBA following microfracture was not significantly different at years 1 (P = .066), 2 (P = .322), or 5 (P = .077) versus control players (Figure 2). However, at years 3 (P = .043; 95% CI, 0.007-0.431) and 4 (P = .026; 95% CI, 0.029-0.459), there were significantly more control players in the NBA. Length of career in NBA following microfracture was not significantly different from controls (Table 4). Performance was significantly better in controls versus cases with regard to points per game, field goal percentage, and free throw percentage (Table 4). Furthermore, controls played significantly more games per season than cases. For individual years 1 through 5 following microfracture (or index year in controls), there was no significant difference in any performance parameter at any year with the following exception: controls played more games in season 1 (67.6 ± 15.1 vs 41.6 ± 25.8 games; P < .001) (see the Appendix).
Figure 2.
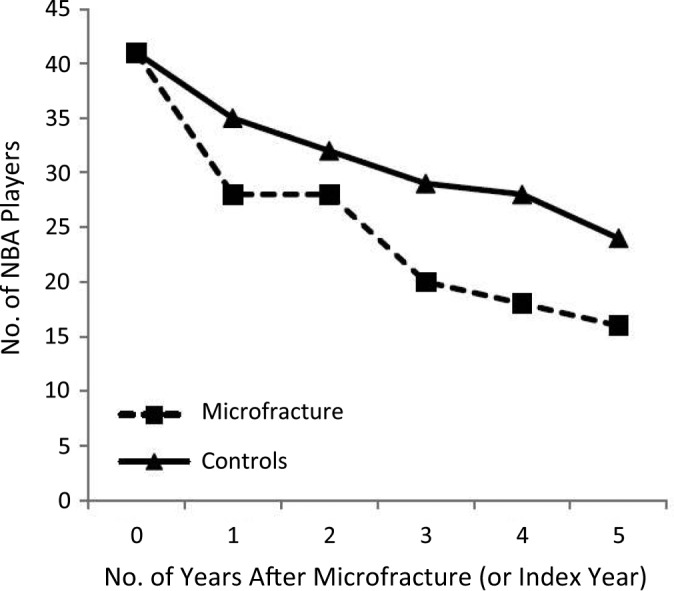
Survival in the National Basketball Association (NBA) following microfracture (or index year in controls).
TABLE 4.
Postmicrofracture Versus Post–Index Year Comparisona
| Cases | Controls | P Value (Paired Samples Student t Test) | 95% CI | |
|---|---|---|---|---|
| Seasons of NBA experience | 4.10 ± 3.91 | 5.05 ± 3.43 | .244 | −2.56 to 0.662 |
| Games played per season | 44.3 ± 25.2 | 59.5 ± 11.4 | .002 | −24.6 to −5.81 |
| Games played overall | 224 ± 236 | 308 ± 244 | .119 | −190 to 22.0 |
| Minutes/game | 23.2 ± 12.6 | 26.7 ± 7.90 | .178 | −8.54 to 1.62 |
| Points/game | 8.92 ± 5.25 | 12.2 ± 6.62 | .029 | −6.20 to −0.337 |
| Rebounds/game | 4.10 ± 2.61 | 4.46 ± 2.45 | .560 | −1.60 to 0.871 |
| Assists/game | 1.86 ± 2.01 | 2.68 ± 2.31 | .126 | −1.89 to 0.238 |
| Blocks/game | 0.494 ± 0.621 | 0.474 ± 0.415 | .875 | −0.235 to 0.276 |
| Steals/game | 0.712 ± 0.425 | 0.830 ± 0.467 | .286 | −0.336 to 0.101 |
| Annual salary, millions of US$ | 6.99 ± 5.44 | 7.58 ± 5.57 | .665 | −3.32 to 2.14 |
| Field goal percentage | 0.417 ± 0.109 | 0.467 ± 0.074 | .014 | −0.107 to −0.013 |
| Free throw percentage | 0.683 ± 0.138 | 0.761 ± 0.087 | .008 | −0.156 to −0.024 |
| Players selected as “All-Stars,” n | 6 | 13 | .066 | −0.354 to 0.012 |
aValues are expressed as mean ± standard deviation unless otherwise indicated. NBA, National Basketball Association; CI, confidence interval.
Discussion
This case-control investigation of 41 NBA players undergoing microfracture has demonstrated an 83% rate of return to professional basketball and a 73% rate of return to the NBA (confirms study hypothesis 1). Seventy-one percent of players returned to sport in the season following microfracture (mean, 9.2 months) (confirms hypothesis 2). Following microfracture, players played significantly fewer games per season, with significantly fewer points and steals per game (rejects hypothesis 3). In a demographic-, performance-, and NBA experience–matched control group of 41 NBA players, there was no significant difference in any post– versus pre–index year performance variable. Following microfracture (or index year in controls), survival in the NBA in controls was significantly better at years 3 and 4, but not at years 1, 2, or 5. Overall career length was not significantly different between groups (partially confirms hypothesis 4). Controls played significantly more games per season, scored more points, and had higher field goal percentage and free throw percentage versus microfracture cases (partially rejects hypothesis 4). The rate of revision microfracture was low (5%).
Chondral defects in the knee are common in both athletes and nonathletes.7,11 These defects may cause significant pain and disability.20 Surgical treatment of these defects has demonstrated success with several different cartilage techniques, including marrow stimulation (microfracture or subchondral drilling), osteochondral autograft and allograft, and cell-based therapies such as autologous chondrocyte implantation (ACI).14,19 Although the definition of success is variable based on patient expectations, the length of time required to rehabilitate and RTS may preclude certain surgical techniques in professional or scholarship athletes. Prior studies have shown the mean time to RTS following osteochondral autograft (6.5 months), versus microfracture (17 months) and ACI (25 months).14 Rate of RTS has been shown to be variable as well with 93%, 78%, and 59% RTS following osteochondral autograft, ACI, and microfracture, respectively. Other recent reports have illustrated higher RTS rates following microfracture (from 83% to 95%) in elite soccer players.24,30
In NBA athletes, a 67% to 79% rate of RTS in the NBA has been demonstrated in prior studies.6,28 These results are similar to the current investigation with regard to RTS in the NBA (73%); however, they are slightly lower if including RTS in other professional leagues (83%). The timing of RTS in the current investigation (9 months) was slightly longer versus prior studies (30 weeks6 and 6 months28). Performance decreases (relative to controls) were also present following microfracture in prior studies: decreased minutes per game,6,28 decreased points per game,28 and decreased player efficiency rating.6
Limitations
Although this study is a comprehensive analysis of RTS in the NBA and performance on RTS, there are limitations to it. Because of the search methodology, players undergoing microfracture may have been missed. However, this search strategy has been used and published in high-level orthopaedic journals in the recent past.1,2,6,8,15,27–29 Higher profile players are more likely to receive media attention and press releases regarding any injury or surgery. The latter publication bias may permit the omission of less popular, less successful players who may have had microfracture and the surgery just not reported to the public. Furthermore, it is possible that the surgical details made publicly available were simply called “arthroscopic knee surgery” or “torn cartilage surgery.” In addition, the negative press that microfracture has received in the media may induce a negative placebo effect on the athlete undergoing the surgery.
Probably the most important limitation is the lack of reporting and discussion of defect details and concomitant pathology for the limb or the knee (meniscus, ligament, alignment). Defect size, depth, subchondral bone involvement, shouldering, and specific intra-articular location were not reported (medial vs lateral, patellofemoral vs tibiofemoral). Concomitant treatment of malalignment (osteotomy) and meniscal deficiency (transplantation) has demonstrated success in treatment of patients with chondral defects of the knee.16,17,36 However, the introduction of these techniques may significantly lengthen the RTS timing and the risk of complications and/or reoperations in professional athletes, thus potentially dramatically altering the career of the athlete.18,36 It is possible that surgeons should be adding these more invasive concomitant procedures to improve outcomes of performance and RTS. In addition, appropriate surgical technique (Table 5) is critical to optimizing outcomes following microfracture in the knee. Since surgical photographs and operative reports were unavailable for review, it is unknown if all surgeons followed the key technical steps of this procedure. Although performance and RTS were the relevant primary outcomes of interest in this investigation, other validated cartilage-specific outcome measures (International Knee Documentation Committee [IKDC] subjective score, Knee injury and Osteoarthritis Outcome Score [KOOS], and Lysholm scores) were not reported. Furthermore, no reports of patient satisfaction were discussed. Even though some players were unable to RTS in the NBA or other professional leagues, the reason for inability to return cannot solely be attributed to the microfracture-treated lesion. Other confounders, as those mentioned above, may play a role. Another important issue is the timing of the surgery relative to what point of his contract he is in. The motivation for RTS may be significantly greater for a player earlier in his career. The inability to reliably obtain these confounding issues demonstrates the need for a comprehensive NBA physician–managed electronic medical record database tracking these variables that may help predict timing, risk of injury, and performance following microfracture. Although all performance-based measures were used to compare pre- and postmicrofracture outcomes and between cases and controls, other immeasurable intangibles inevitably exist (teammate motivation, team leadership, etc). In the future, well-designed and -conducted prospective studies of elite athletes may be more useful for clinical guidance in treatment management regarding the role of microfracture in chondral defects of the knee.
TABLE 5.
Technical Pearls for Microfracture Surgery in the Knee
|
|
|
|
|
|
|
|
|
|
|
|
Conclusion
Eighty-three percent of NBA players undergoing microfracture returned to professional basketball (73% returned to NBA, 10% to FIBA or D-league). Career length was not significantly different between players undergoing microfracture and controls. However, following microfracture, players competed in fewer games per season with fewer points and steals.
Appendix
Years 1 to 5 Following Microfracture (Cases) Versus Index Year (Controls)a
| Case Group (Microfracture) | Control Group | P Value (Paired Samples Student t Test) | 95% CI | |
|---|---|---|---|---|
| Year 1 | ||||
| No. of games played | 41.6 ± 25.8 | 67.6 ± 15.1 | <.001 | –36.4 to –15.6 |
| Minutes/game | 22.7 ± 10.3 | 27.5 ± 11.0 | .081 | –10.3 to 0.604 |
| Points/game | 10.1 ± 6.04 | 12.7 ± 8.48 | .172 | –6.43 to 1.17 |
| Rebounds/game | 4.28 ± 2.42 | 4.42 ± 2.53 | .824 | –1.40 to 1.12 |
| Assists/game | 2.09 ± 2.30 | 2.65 ± 2.64 | .375 | –1.83 to 0.700 |
| Steals/game | 0.836 ± 0.773 | 0.839 ± 0.546 | .986 | –0.336 to 0.330 |
| Blocks/game | 0.464 ± 0.621 | 0.411 ± 0.387 | .679 | –0.202 to 0.309 |
| Field goal percentage | 0.437 ± 0.105 | 0.458 ± 0.086 | .385 | –0.069 to 0.027 |
| Free throw percentage | 0.728 ± 0.100 | 0.736 ± 0.128 | .781 | –0.067 to 0.051 |
| Year 2 | ||||
| No. of games played | 52.6 ± 28.6 | 63.1 ± 16.9 | .100 | –23.2 to 2.11 |
| Minutes/game | 24.1 ± 9.74 | 28.2 ± 9.49 | .100 | –9.05 to 0.812 |
| Points/game | 10.0 ± 6.21 | 13.6 ± 8.31 | .063 | –7.38 to 0.207 |
| Rebounds/game | 4.56 ± 3.08 | 4.73 ± 2.74 | .825 | –1.66 to 1.32 |
| Assists/game | 2.06 ± 2.08 | 3.04 ± 2.95 | .140 | –2.31 to 0.334 |
| Steals/game | 0.713 ± 0.556 | 0.882 ± 0.535 | .236 | –0.451 to 0.113 |
| Blocks/game | 0.593 ± 0.830 | 0.419 ± 0.365 | .303 | –0.164 to 0.513 |
| Field goal percentage | 0.430 ± 0.142 | 0.458 ± 0.069 | .325 | –0.084 to 0.028 |
| Free throw percentage | 0.724 ± 0.143 | 0.765 ± 0.111 | .218 | –0.107 to 0.025 |
| Year 3 | ||||
| No. of games played | 55.7 ± 19.6 | 62.7 ± 19.1 | .208 | –18.0 to 4.01 |
| Minutes/game | 24.3 ± 10.3 | 27.6 ± 9.53 | .247 | –9.08 to 2.39 |
| Points/game | 10.0 ± 5.89 | 12.9 ± 7.71 | .147 | –6.77 to 1.05 |
| Rebounds/game | 4.80 ± 2.81 | 4.49 ± 2.47 | .686 | –1.21 to 1.83 |
| Assists/game | 2.23 ± 2.41 | 2.85 ± 2.86 | .428 | –2.17 to 0.936 |
| Steals/game | 0.848 ± 0.558 | 0.972 ± 0.628 | .476 | –0.472 to 0.224 |
| Blocks/game | 0.519 ± 0.604 | 0.514 ± 0.584 | .978 | –0.339 to 0.349 |
| Field goal percentage | 0.676 ± 1.08 | 0.444 ± 0.091 | .341 | –0.263 to 0.725 |
| Free throw percentage | 0.742 ± 0.093 | 0.767 ± 0.130 | .461 | –0.092 to 0.043 |
| Year 4 | ||||
| No. of games played | 63.4 ± 23.5 | 59.2 ± 19.4 | .506 | –8.56 to 17.1 |
| Minutes/game | 26.4 ± 9.06 | 27.9 ± 8.26 | .565 | –6.78 to 3.75 |
| Points/game | 10.6 ± 5.82 | 12.5 ± 7.39 | .359 | –6.10 to 2.26 |
| Rebounds/game | 5.09 ± 2.85 | 4.47 ± 2.50 | .443 | –1.00 to 2.25 |
| Assists/game | 2.50 ± 2.73 | 2.88 ± 2.71 | .649 | –2.05 to 1.29 |
| Steals/game | 0.831 ± 0.513 | 0.912 ± 0.532 | .617 | –0.402 to 0.241 |
| Blocks/game | 0.594 ± 0.722 | 0.572 ± 0.623 | .913 | –0.385 to 0.430 |
| Field goal percentage | 0.455 ± 0.057 | 0.447 ± 0.090 | .725 | –0.040 to 0.057 |
| Free throw percentage | 0.720 ± 0.082 | 0.755 ± 0.107 | .253 | –0.094 to 0.025 |
| Year 5 | ||||
| No. of games played | 63.2 ± 26.3 | 60.6 ± 21.4 | .725 | –12.6 to 17.9 |
| Minutes/game | 25.8 ± 9.98 | 27.6 ± 8.44 | .544 | –7.81 to 4.19 |
| Points/game | 9.52 ± 6.37 | 12.5 ± 8.31 | .228 | –8.02 to 1.98 |
| Rebounds/game | 5.09 ± 3.09 | 4.53 ± 2.86 | .559 | –1.38 to 2.52 |
| Assists/game | 2.49 ± 2.51 | 3.26 ± 2.77 | .382 | –2.53 to 0.991 |
| Steals/game | 0.956 ± 0.689 | 0.805 ± 0.564 | .458 | –0.257 to 0.558 |
| Blocks/game | 0.744 ± 0.760 | 0.455 ± 0.432 | .140 | –0.099 to 0.676 |
| Field goal percentage | 0.447 ± 0.085 | 0.450 ± 0.068 | .892 | –0.053 to 0.046 |
| Free throw percentage | 0.723 ± 0.135 | 0.799 ± 0.117 | .067 | –0.159 to 0.006 |
aValues are expressed as mean ± standard deviation. CI, confidence interval.
Footnotes
One or more of the authors has declared the following potential conflict of interest or source of funding: B.J.C. receives royalties from Arthrex, DJO, and Elsevier; is on the speaker’s bureau of Genzyme; is a paid consultant for Zimmer, Arthrex, Carticept, Biomimetic, Allosource, and DePuy; receives research support from Arthrex, Smith & Nephew, DJO, Zimmer, DePuy, and Johnson & Johnson; receives royalties from the publishers Lippincott, Elsevier, WB Saunders, and Smith & Nephew; and is on medical publications boards for the Journal of Bone and Joint Surgery, American Journal of Sports Medicine, Cartilage, Journal of Shoulder and Elbow Surgery, American Journal of Orthopedics, Elsevier, International Committee AANA, Educational Committee AANA, and the AAOS Board. B.R.B. receives royalties from SLACK Inc and institutional research support from Arthrex, Ossur, Linvatec, and Smith & Nephew. N.N.V. receives royalties from Smith & Nephew; is on the speakers bureau for Arthrosurface; is a paid consultant for Smith & Nephew and Arthrex; owns stock in Omeros; receives research support from Arthrex, Smith & Nephew, Athletico, ConMed Linvatec, Miomed, Mitek, and Arthrosurface; receives royalties from the publishers Vindico Medical-Orthopedics Hyperguide and Arthroscopy; is on the medical publishing boards of the Journal of Knee Surgery, Arthroscopy, and SLACK Inc; and is a board member for the Arthroscopy Association Learning Center.
References
- 1. Amin NH, Old AB, Tabb LP, Garg R, Toossi N, Cerynik DL. Performance outcomes after repair of complete Achilles tendon ruptures in National Basketball Association players. Am J Sports Med. 2013;4:1864–1868. [DOI] [PubMed] [Google Scholar]
- 2. Anakwenze OA, Namdari S, Auerbach JD, et al. Athletic performance outcomes following lumbar discectomy in professional basketball players. Spine (Phila Pa 1976). 2010;35:825–828. [DOI] [PubMed] [Google Scholar]
- 3. Behery OA, Harris JD, Karnes JM, Siston RA, Flanigan DC. Factors influencing the outcome of autologous chondrocyte implantation: a systematic review. J Knee Surg. 2013;26:203–211. [DOI] [PubMed] [Google Scholar]
- 4. Blevins F, Steadman J, Rodrigo J, Silliman J. Treatment of articular cartilage defects in athletes: an analysis of functional outcome and lesions appearance. Orthopedics. 1998;21:761–767. [DOI] [PubMed] [Google Scholar]
- 5. Busfield BT, Kharrazi FD, Starkey C, Lombardo SJ, Seegmiller J. Performance outcomes of anterior cruciate ligament reconstruction in the National Basketball Association. Arthroscopy. 2009;25:825–830. [DOI] [PubMed] [Google Scholar]
- 6. Cerynik D, Lewullis G, Joves B, Palmer M, Tom J. Outcomes of microfracture in professional basketball players. Knee Surg Sports Traumatol Arthrosc. 2009;17:1135–1139. [DOI] [PubMed] [Google Scholar]
- 7. Curl W, Krome J, Gordon E, Rushing J, Smith B, Poehling G. Cartilage injuries: a review of 31,516 knee arthroscopies. Arthroscopy. 1997;13:456–460. [DOI] [PubMed] [Google Scholar]
- 8. Erickson B, Harris J, Cvetanovich G, et al. Performance and return to sport after anterior cruciate ligament reconstruction in male Major League Soccer players [published online July 11, 2013]. Orthop J Sports Med. doi:10.1177/2325967113497189. [DOI] [PMC free article] [PubMed] [Google Scholar]
- 9. Flanigan DC, Harris JD, Brockmeier PM, Lathrop RL, Siston RA. The effects of defect size, orientation, and location on subchondral bone contact in oval-shaped experimental articular cartilage defects in a bovine knee model [published online December 19, 2012]. Knee Surg Sports Traumatol Arthrosc. doi:10.1007/s00167-012-2342-6. [DOI] [PubMed] [Google Scholar]
- 10. Flanigan DC, Harris JD, Brockmeier PM, Siston RA. The effects of lesion size and location on subchondral bone contact in experimental knee articular cartilage defects in a bovine model. Arthroscopy. 2010;26:1655–1661. [DOI] [PubMed] [Google Scholar]
- 11. Flanigan DC, Harris JD, Trinh TQ, Siston RA, Brophy RH. Prevalence of chondral defects in athletes’ knees: a systematic review. Med Sci Sports Exerc. 2010;42:1795–1801. [DOI] [PubMed] [Google Scholar]
- 12. Gobbi A, Karnatzikos G, Kumar A. Long-term results after microfracture treatment for full-thickness knee chondral lesions in athletes [published online September 20, 2013]. Knee Surg Sports Traumatol Arthrosc. doi:10.1007/s00167-013-2676-8. [DOI] [PubMed] [Google Scholar]
- 13. Gudas R, Kalesinskas RJ, Kimtys V, et al. A prospective randomized clinical study of mosaic osteochondral autologous transplantation versus microfracture for the treatment of osteochondral defects in the knee joint in young athletes. Arthroscopy. 2005;21:1066–1075. [DOI] [PubMed] [Google Scholar]
- 14. Harris J, Brophy R, Siston R, Flanigan D. Treatment of chondral defects in the athlete’s knee. Arthroscopy. 2010;26:841–852. [DOI] [PubMed] [Google Scholar]
- 15. Harris J, Erickson B, Bach B, Jr, et al. Return to sport and performance after anterior cruciate ligament reconstruction in National Basketball Association players. Sports Health. 2013;5:562–568. [DOI] [PMC free article] [PubMed] [Google Scholar]
- 16. Harris J, McNeilan R, Siston R, Flanigan D. Survival and clinical outcome of isolated high tibial osteotomy and combined biological knee reconstruction. Knee. 2013;20:154–161. [DOI] [PubMed] [Google Scholar]
- 17. Harris JD, Cavo M, Brophy R, Siston R, Flanigan D. Biological knee reconstruction: a systematic review of combined meniscal allograft transplantation and cartilage repair or restoration. Arthroscopy. 2011;27:409–418. [DOI] [PubMed] [Google Scholar]
- 18. Harris JD, Siston RA, Brophy RH, Lattermann C, Carey JL, Flanigan DC. Failures, re-operations, and complications after autologous chondrocyte implantation--a systematic review. Osteoarthritis Cartilage. 2011;19:779–791. [DOI] [PubMed] [Google Scholar]
- 19. Harris JD, Siston RA, Pan X, Flanigan DC. Autologous chondrocyte implantation: a systematic review. J Bone Joint Surg Am. 2010;92:2220–2233. [DOI] [PMC free article] [PubMed] [Google Scholar]
- 20. Heir S, Nerhus T, Rotterud J, et al. Focal cartilage defects in the knee impair quality of life as much as severe osteoarthritis: a comparison of knee injury and osteoarthritis outcome score in 4 patient categories scheduled for knee surgery. Am J Sports Med. 2010;38:231–237. [DOI] [PubMed] [Google Scholar]
- 21. Kanneganti P, Harris JD, Brophy RH, Carey JL, Lattermann C, Flanigan DC. The effect of smoking on ligament and cartilage surgery in the knee: a systematic review. Am J Sports Med. 2012;40:2872–2878. [DOI] [PMC free article] [PubMed] [Google Scholar]
- 22. Kaplan L, Schurhoff M, Selesnick H, Thorpe M, Uribe J. MRI of the knee in asymptomatic professional basketball players. Arthroscopy. 2005;21:557–561. [DOI] [PubMed] [Google Scholar]
- 23. Kreuz P, Steinwachs M, Erggelet C, et al. Results after microfracture of full-thickness chondral defects in different compartments in the knee. Osteoarthritis Cartilage. 2006;14:1119–1125. [DOI] [PubMed] [Google Scholar]
- 24. Mithoefer K, Steadman J. Microfracture in football (soccer) players: a case series of professional athletes and systematic review. Cartilage. 2012;3(suppl):18S–24S. [DOI] [PMC free article] [PubMed] [Google Scholar]
- 25. Mithoefer K, Williams R, Warren R, et al. The microfracture technique for the treatment of articular cartilage lesions in the knee. A prospective cohort study. J Bone Joint Surg Am. 2005;87:1911–1920. [DOI] [PubMed] [Google Scholar]
- 26. Mithoefer K, Williams RJ, 3rd, Warren R, Wickiewicz T, Marx R. High-impact athletics after knee articular cartilage repair: a prospective evaluation of the microfracture technique. Am J Sports Med. 2006;34:1413–1418. [DOI] [PubMed] [Google Scholar]
- 27. Namdari S, Baldwin K, Ahn A, Huffman GR, Sennett BJ. Performance after rotator cuff tear and operative treatment: a case-control study of major league baseball pitchers. J Athl Train. 2011;46:296–302. [DOI] [PMC free article] [PubMed] [Google Scholar]
- 28. Namdari S, Baldwin K, Anakwenze O, Park M, Huffman G, Sennett B. Results and performance after microfracture in National Basketball Association Athletes. Am J Sports Med. 2009;37:943–949. [DOI] [PubMed] [Google Scholar]
- 29. Namdari S, Scott K, Milby A, Baldwin K, Lee GC. Athletic performance after ACL reconstruction in the Women’s National Basketball Association. Phys Sportsmed. 2011;39:36–41. [DOI] [PubMed] [Google Scholar]
- 30. Riyami M, Rolf C. Evaluation of microfracture of traumatic chondral injuries to the knee in professional football and rugby players. J Orthop Surg Res. 2009;4:1–8. [DOI] [PMC free article] [PubMed] [Google Scholar]
- 31. Rodrigo J, Steadman J, Silliman J, Fulstone H. Improvement of full-thickness chondral defect healing in the human knee after debridement and microfracture using continuous passive motion. Am J Knee Surg. 1994;7:109–116. [Google Scholar]
- 32. Steadman J, Briggs K, Rodrigo J, Kocher M, Gill T, Rodkey W. Outcomes of microfracture for traumatic chondral defects of the knee: average 11-year follow-up. Arthroscopy. 2003;19:477–484. [DOI] [PubMed] [Google Scholar]
- 33. Steadman J, Miller B, Karas S, Schlegel T, Briggs K, Hawkins R. The microfracture technique in the treatment of full-thickness chondral lesions of the knee in National Football League players. J Knee Surg. 2003;16:83–86. [PubMed] [Google Scholar]
- 34. Steadman JR, Rodkey WG, Briggs K. Microfracture: its history and experience of the developing surgeon. Cartilage. 2010;1:78–86. [DOI] [PMC free article] [PubMed] [Google Scholar]
- 35. Trinh TQ, Harris JD, Flanigan DC. Surgical management of juvenile osteochondritis dissecans of the knee. Knee Surg Sports Traumatol Arthrosc. 2012;20:2419–2429. [DOI] [PubMed] [Google Scholar]
- 36. Trinh TQ, Harris JD, Siston RA, Flanigan DC. Improved outcomes with combined autologous chondrocyte implantation and patellofemoral osteotomy versus isolated autologous chondrocyte implantation. Arthroscopy. 2013;29:566–574. [DOI] [PubMed] [Google Scholar]
- 37. Walczak B, McCulloch P, Kang R, Zelazny A, Tedeschi F, Cole B. Abnormal findings on knee magnetic resonance imaging in asymptomatic NBA players. J Knee Surg. 2008;21:27–33. [DOI] [PubMed] [Google Scholar]