Abstract
Background:
Shoulder instability can cause both soft tissue injury and bone defects, requiring both computed tomography (CT) and magnetic resonance imaging (MRI) for a thorough workup, which results in high patient costs and radiation exposure. Prior studies in cadaveric and nonclinical models have shown promise in assessing preoperative bone loss utilizing MRI.
Purpose:
To evaluate the utility of MRI in detecting and evaluating glenoid bone defects in a clinical setting. The aim was to establish whether similar information could be determined by utilizing MRI and CT in a population with recurrent instability.
Study Design:
Cohort study (diagnosis); Level of evidence, 2.
Methods:
CT and MRI scans of 22 shoulders were read by 4 orthopaedic surgeons. The CT images were obtained on a 2-dimensional CT scanner. Vertical measurements were taken from the superior glenoid tubercle and directed inferiorly along the glenoid; horizontal measurements were taken across the widest part of the face of the glenoid and were perpendicular within one-half of 1° to the vertical measurement. The same protocol was followed for MRI measurements. An intraclass correlation coefficient (ICC) was calculated.
Results:
There was a moderate amount of agreement between examiners for the height measurements on MRI (ICC, 0.53) and a substantial agreement for the CT images (ICC, 0.64). The width measurements for MRI had a moderate amount of agreement (ICC, 0.41), while the CT images had a fair agreement (ICC, 0.39). The height measurements between the measurements of MRI and CT images had an overall ICC of 0.43, while the width measurements had an overall ICC of 0.41, both of which were considered a moderate amount of agreement.
Conclusion:
There is moderate correlation between MRI and CT scans when measuring the glenoid, indicating that taking the length-to-height ratio measurements across the glenoid is a promising way to estimate the glenoid defect. At present, a complete workup of a patient with shoulder instability includes both a CT scan and an MRI. Future research that establishes precisely how MRI misestimates CT measurements of the glenoid can perhaps obviate the need for 2 scans.
Keywords: MRI, CT, shoulder instability, glenoid bone loss, dislocation
The glenohumeral joint has a large range of motion, leaving it more susceptible to dislocation than any other joint in the human body.17 As a result, shoulder dislocations are a common problem in the United States, with an estimated incidence rate between 11.2 and 23.9 cases per 100,000 person-years. 15,17 In addition, shoulder dislocations can often become a recurrent problem, with recurrence rates reaching as high as 90% with athletes younger than 20 years.5
When shoulder instability becomes recurrent, surgery is indicated to fix the problem. Preoperative imaging is crucial in planning which procedure is best suited to the patient’s specific pathology, as glenohumeral dislocations can result in damage to both the surrounding soft tissue and bony structures. Soft tissue damage includes anteroinferior labral detachment or capsular damage, leading to capsular redundancy. Bony instability is produced by lesions to the humeral head or the glenoid, with lesions to the anterior glenoid being the most common cause of bony instability.14
The range in pathology raises challenges in preoperative imaging, as bony pathology is better assessed using computed tomography (CT)11 (particularly 3-dimensional [3D] CT),1 while soft tissue injuries are better assessed using magnetic resonance imaging (MRI).4 An accurate diagnosis is important because failing to address the presence of a bone defect is the primary reason for failure of soft tissue repair.3 Recurrence rates for arthroscopic repairs are high and range across the literature from 3.4% to 35%.13 The high rate of failure from soft tissue repair alone underscores the importance of preoperative imaging to direct the patient with attritional bone loss to the proper procedure that is aggressive enough to address the patient’s particular pathology.
In the United States, there is no gold standard to measure preoperative bone loss. Currently, a thorough evaluation of the preoperative patient with shoulder instability involves both an MRI to assess soft tissue injury and CT scan to assess bone damage. This is problematic in that the additional CT scan adds both monetary cost to the patient’s workup and radiation exposure to the patient.
Other studies have found some success in measuring preoperative bone loss but either have not obviated the need for both CT and MRI or have not proven clinical utility. Magarelli et al10 showed the efficacy of the pico method in which they drew a circle around the healthy inferior glenoid and calculated glenoid bone loss as the part of the circle missing from the contralateral injured glenoid. Similarly, Bois et al2 found that 3D CT could be used on sawbones to measure the length of glenoid defects in the anterior and anteroinferior direction. They validated the pico surface area method, the glenoid width-to-length ratio, and the ratio linear method as a way to quantify bone loss on a saw bone model.2 Gyftopoulos et al6 as well as Huijsmans et al7 calculated glenoid bone loss of cadaveric shoulders via MRI. Both studies utilized the circle method, calculating bone loss as the amount of bone missing from a circle drawn on the inferior glenoid using digital software. Lee et al9 compared the findings of glenoid bone loss in MRI and CT to the findings during arthroscopy and found that MRI and CT correlated for the anterior straight line length, glenoid width, and the severity of the glenoid bone loss with use of the best-fit circle width. They found that CT assessment was superior to MRI in assessing bone loss, but that MRI was reasonably accurate and had certain advantages due to its ability to address soft tissue injuries.9 Owens et al12 devised a formula to predict glenoid width and height given the sex of the patient. This formula has promising implications for being able to calculate bone loss in future clinical situations using MRI.12 Tian et al16 used an additional fat-suppressed 3D volumetric interpolated breath-held examination (VIBE) sequence in MRI to detect bony Bankart lesions and found the sensitivity and specificity to be 95.7% to 100% and 93.9% to 97.0%, respectively, when compared with CT imaging.
The purpose of our study was to evaluate the utility of MRI to detect and evaluate glenoid bone defects in a clinical setting. Our aim was to establish whether we can determine similar information by utilizing MRI and CT in a population with recurrent instability. To achieve this, we first needed to determine how much agreement there is between measurements taken by multiple people trained to read radiology films. By taking the length-to-width measurements across the face of the glenoid for both MR and CT images, we were able to see how much these measurements correlated with one another. This gave us valuable information on whether these 2 imaging modalities could be used interchangeably in the future. With this information, we could begin to use MRI to predict the morphology and integrity of the glenoid more precisely. We hypothesized that MRI will have a high degree of correlation with CT for glenoid morphology. If this is the case, MRI should be a promising imaging modality for recurrent instability, obviating the need for CT scanning and unnecessary cost and radiation exposure.
Methods
The electronic medical record database was searched for “shoulder dislocation,” which revealed 166 patients who had undergone both CT and MRI. Patients were excluded if they had inflammatory arthropathies, osteoarthritis listed as a diagnosis, or if they had a documented dislocation between the time of their CT scan and MRI, which narrowed the pool of patients down to 24. An additional 2 patients were excluded due to poor imaging, granting a total of 22 shoulders. There were 2 females and 20 males, and the average age was 28.8 years (range, 15-60 years).
All CT and MRI scans for each patient were read by 3 shoulder surgeons at the end of their fellowship year in sports medicine and 1 senior orthopaedic attending with 25 years of postfellowship training. All readers were blinded to both patient identity and clinical history. For each shoulder, a T1-weighted MRI scan was selected that best showed the glenoid bone defect and was used for taking the length-to-height ratio measurements across the glenoid. Vertical measurements were taken from the superior glenoid tubercle and directed inferiorly along the glenoid. Horizontal measurements were taken across the widest part of the face of the glenoid and were perpendicular within one-half of 1° to the vertical measurement (Figure 1). The same protocol was followed for CT scan measurements. The MRI images were all obtained using a 3-T MRI scanner. The CT images were obtained on a 2-dimensional CT scanner.
Figure 1.
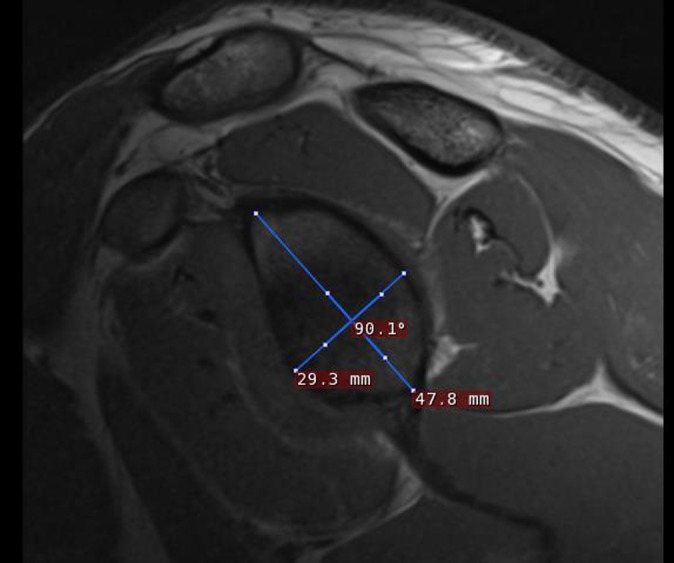
Example of measurements made across the face of a glenoid on a T1-weighted MRI scan.
These measurements were recorded, and an intraclass correlation coefficient (ICC) was calculated to determine the amount of concordance between the measurements for the MRI and CT scan for each shoulder. An ICC of 0.01 was considered poor agreement, 0.01 to 0.2 was considered slight agreement, 0.21 to 0.4 was considered fair agreement, 0.41 to 0.6 was considered moderate agreement, 0.61 to 0.8 was considered substantial agreement, and 0.8 to 1.0 was considered almost perfect agreement.8
Results
The height measurements had a much higher degree of agreement than did the width measurements among the 4 surgeons. The height measurements for MRI had an ICC of 0.53 (Figure 2), which was considered moderate agreement, while the height measurements for CT had an ICC of 0.64 (Figure 3), which was considered substantial agreement.
Figure 2.
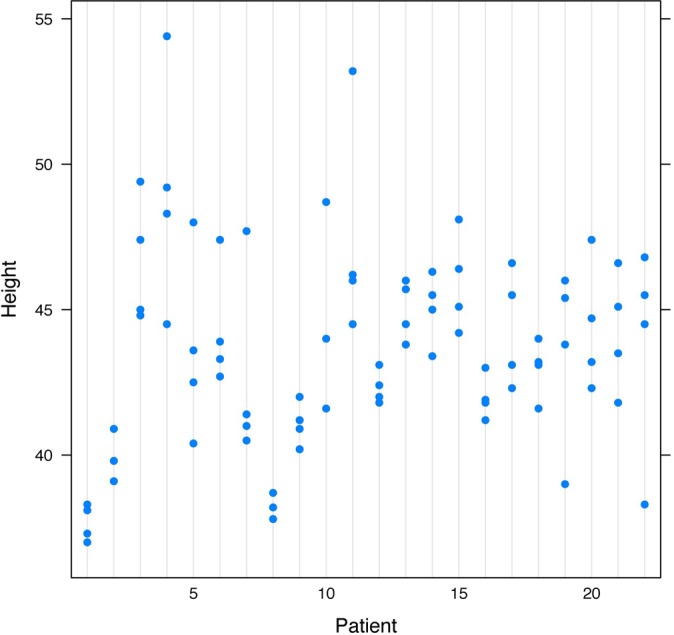
Agreement on height measurements by MRI (intraclass correlation coefficient, 0.531).
Figure 3.
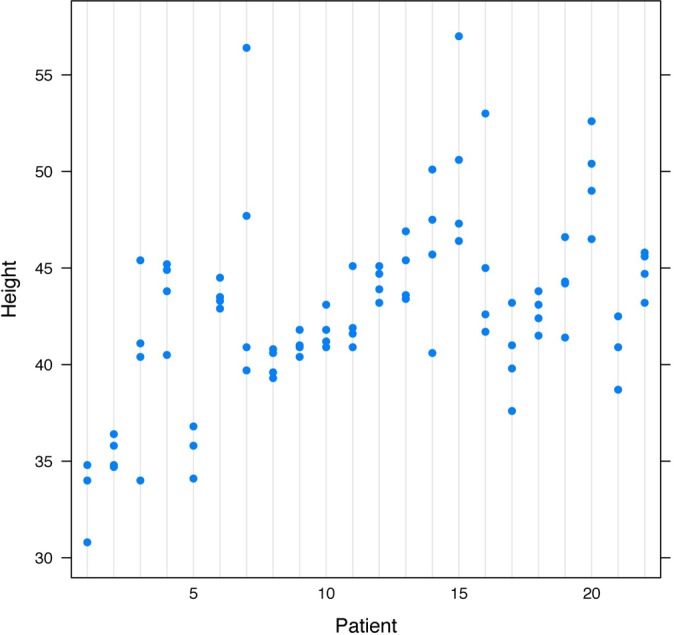
Agreement on height measurements by CT (intraclass correlation coefficient, 0.635).
The width measurements for MRI and CT did not have as much agreement as the height measurements. The ICC for the width measurements taken by MRI was 0.41 (Figure 4), which was considered moderate agreement, and the ICC for the width measurements taken by CT was 0.39 (Figure 5), which was considered fair agreement.
Figure 4.
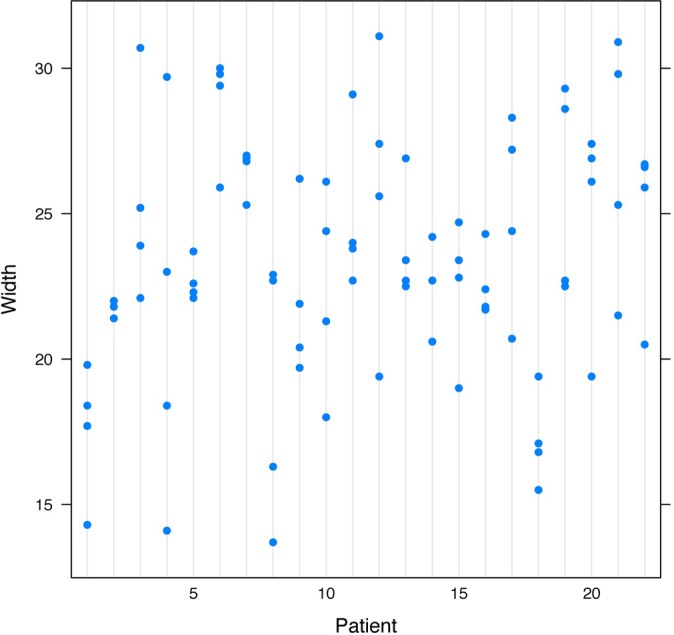
Agreement on width measurements by MRI (intraclass correlation coefficient, 0.409).
Figure 5.
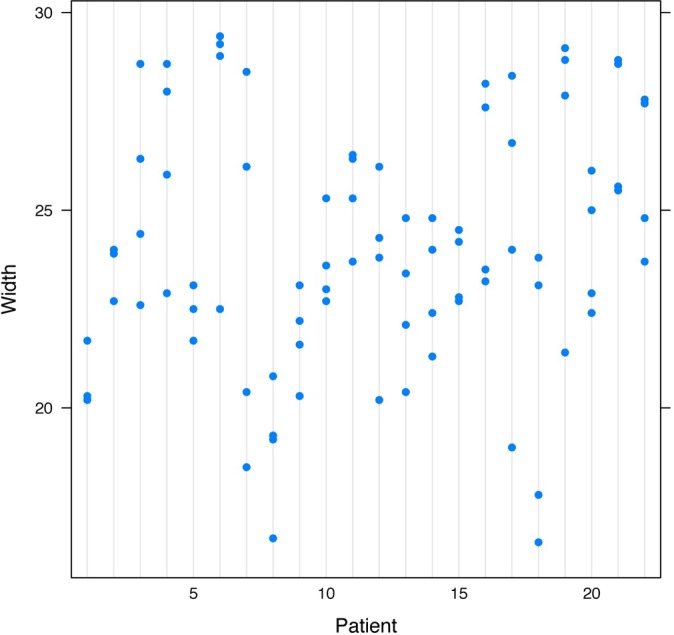
Agreement on width measurements by CT (intraclass correlation coefficient, 0.389).
Using height and width measurements, one can be moderately reliable in using the MRI images to extrapolate what the CT measurements would be and vice versa. The ICCs between the CT and MRI measurements for width were 0.33, 0.67, 0.25, and 0.30 for the 4 readers, yielding an overall intraclass correlation for width of 0.41, which was a moderate amount of agreement. An average height for the glenoid as measured by MRI was 43 mm. A graphical representation of the height measurements from CT and MRI measurements had slopes that were significantly different than 1 (P < .001) (Figure 6). In fact, as the height increased by 1 unit as measured by MRI, the slope of the line predicted an increase of 0.41 units in CT height (P = .002). This indicates that the large measurements made by MRI were, on average, too large, and the small measurements made by MRI were too small in relation to CT measurements (Table 1).
Figure 6.
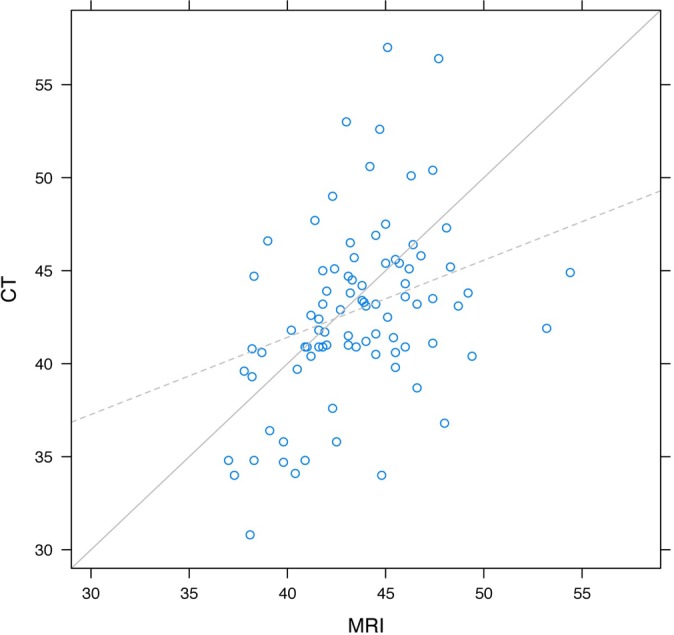
Agreement of height measurements between MRI and CT.
Table 1.
Association of Height Measurement Between MRI and CTa
| Term | Estimate | SE Estimate | 95% CIb | P Valuec |
|---|---|---|---|---|
| Intercept | –0.34 | 0.89 | –2.34 to 1.66 | .91 (intercept) |
| MRId | 0.41 | 0.17 | 0.03 to 0.8 | .002 (slope) |
aCT, computed tomography; MRI, magnetic resonance imaging; SE, standard error.
bSimultaneous 95% CIs.
cIntercept = 0; slope = 1.
dCentered at 23.
Likewise, the MRI width measurements for the glenoid were moderately reliable for predicting the CT measurements and vice versa. The ICCs between the CT and MRI measurements for height were 0.30, 0.36, 0.28, and 0.54 for the 4 readers, yielding an overall intraclass correlation for height of 0.43, which represented a moderate amount of agreement. An average MRI width for the glenoid as measured by MRI was 23 mm. A graphical representation of the height measurements from CT and MRI measurements had slopes that were significantly different than 1 (P < .001) (Figure 7). Just as for the height, the graph indicates the large measurements made by MRI were, on average, too large, and the small measurements made by MRI were too small compared with the CT measurements (Table 2).
Figure 7.
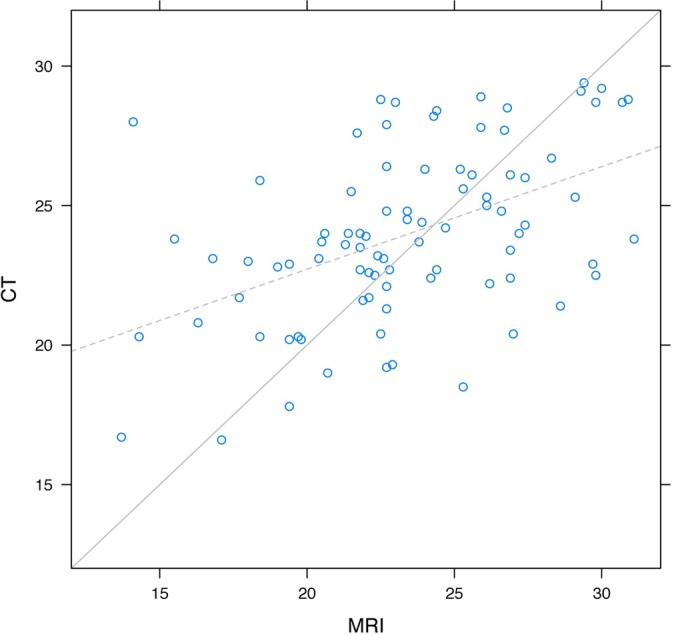
Agreement of width measurements between MRI and CT.
Table 2.
Association of Width Measurement Between MRI and CTa
| Term | Estimate | SE Estimate | 95% CIb | P Valuec |
|---|---|---|---|---|
| Intercept | 0.84 | 0.37 | 0.01 to 1.66 | .046 (intercept) |
| MRId | 0.29 | 0.08 | 0.12 to 0.47 | <.001 (slope) |
aCT, computed tomography; MRI, magnetic resonance imaging; SE, standard error.
bSimultaneous 95% CIs.
cIntercept = 0; slope = 1.
dCentered at 23.
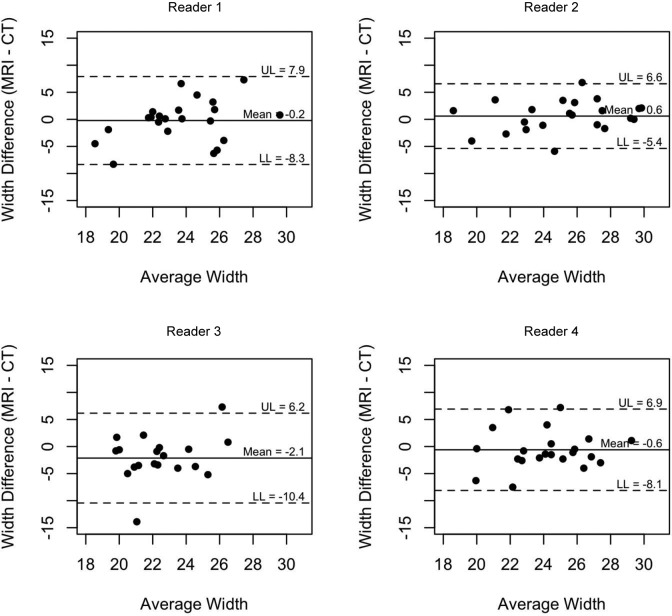
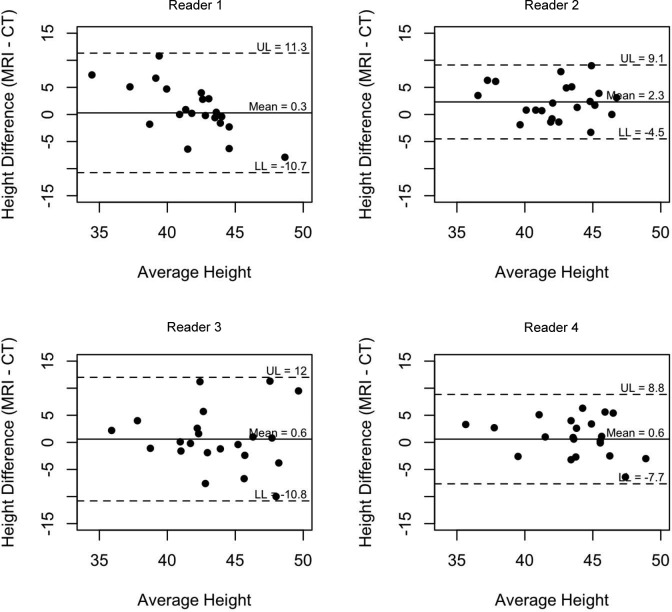
Bland-Altman plots were created to assess the agreement on width (Figure 8) and height (Figure 9) between MRI and CT measurements for the 4 readers. The limits of agreements were calculated for each reader and are designated on the graph, representing the interval in which 95% of the readings fall (95% CI) and indicating the amount of variability in measurements for each reader.
Figure 8.
Bland-Altman plot assessing agreement on width between MRI and CT measurements for the 4 readers.
Figure 9.
Bland-Altman plot assessing agreement on height between MRI and CT measurements for the 4 readers.
Discussion
We found that there was moderate agreement for both the height and width for the MRI and CT measurements. Our findings show that taking the length-to-height ratio measurements across the glenoid is a promising way to estimate the glenoid defect. Though utilizing MRI to measure a glenoid bone defect lacks the diagnostic accuracy of a CT scan, taking the length-to-height ratio can give a reasonable estimate without an additional imaging scan. Prior studies had shown promise in assessing preoperative bone loss in cadaveric and nonclinical models utilizing MRI. For instance, Huijsmans et al7 validated the circle method as a way to measure glenoid bone defects in cadavers using MR imaging. This method was supported by Gyftopoulos et al,6 who were able to use MRI to accurately measure glenoid bone loss on digital photographic images of cadaveric glenoids. However, our study shows that MRI is only able to accurately measure glenoid bone loss with moderate reliability, particularly not to the level of accuracy of CT.
One possible explanation for this difference is that prior studies have utilized the circle method while we utilized the length-to-height ratio. Because the purpose of this study was to determine the clinical utility of MRI to determine glenoid bone loss, we felt it was important to utilize the length-to-height ratio, a technique that can be undertaken with minimal training in a matter of minutes and that does not require any additional software. In addition, a large effect is also likely due to the difference between a cadaveric study and a clinical study. For instance, because the glenoid bone defects in our study are due to injury and not human-made osteotomies, they are less likely to be as clean and easy to measure. When trying to correlate the measurements between MRI and CT, the angles may be less sharp and lines less well defined, which can make the measuring process far more difficult.
From this current study, for optimal diagnostic accuracy, a complete workup of a patient with shoulder instability still requires both CT imaging to assess bony lesions and MRI to investigate soft tissue damage. Our findings are consistent with Lee et al,9 who found that while MRI and CT may correlate well for many different measurements, CT is still superior for assessing glenoid bone loss. MRI does have certain advantages in assessing soft tissue damage and can be reasonably accurate in assessing bone loss, making it a better choice if one can only choose a single imaging modality.9 However, CT is still the gold standard for bony defects while MRI is the gold standard for soft tissue injuries.
The work of Bois et al2 and Magarelli et al10 helped establish an accurate way of measuring glenoid bone loss using CT scanning. However, this does not obviate the problem of the additional radiation or the necessity of the MRI scan to look for soft tissue injury. When the clinician is faced with the patient with shoulder instability, the MRI scan helps provide important information about the extent of soft tissue damage. However, the CT scan also provides critical information about the integrity of the bony surface of the glenoid. This information is necessary to plan a surgery that is appropriately aggressive enough to solve the patient’s instability.
A weakness of this study was the small number of readers of the radiographic films and the relatively small sample size. Also, the electronic medical record database was fairly sparse surrounding each patient, which made it difficult to glean additional information from each shoulder, such as the number of dislocations and the specific MRI and CT sequences used. In addition, each reader chose for himself the image he felt best represented the glenoid bone defect and drew the line that signified the long axis. While this technique may have introduced some error into the procedure, it also made the methods more clinically realistic and may have underscored why our results were not as promising as some of the studies done using cadavers. The strength of our study is its clinical methodology and implications. While most of the prior studies were done with cadaver specimens, our study population was drawn completely from actual patient radiographs. The length-to-height ratio technique we used to assess bone loss is a technique that could easily be used in an office setting without any additional software as opposed to the circle technique utilized in prior studies that can be cumbersome, time consuming, and requires special training and additional software. With no additional software or training and in a realistic clinical setting, our readers were able to predict the glenoid morphology with moderate reliability, indicating that what this research adds to the field is a new technique to measure the glenoid bone defect that has direct clinical implications.
While the data we gathered showed we could use MRI to estimate the size of the glenoid bone defect on CT or vice versa with moderate reliability, the error we found tended to be consistent. For example, large measurements made by MRI were, on average, too large, and the small measurements made by MRI were too small as compared with the CT measurements. Directions for further research would be to quantify this deviance more precisely. If it is known that MRI overestimates or underestimates a glenoid defect compared with that on a CT scan by a precise amount, then the 2 imaging technologies may be able to be used interchangeably in the future. In that case, MRI can be utilized to assess soft tissue injuries and one can determine glenoid bone defects by knowing precisely how inaccurate the technology is measuring the defect, obviating the need for the patient to undergo a second scan.
Conclusion
There is moderate correlation between MRI and CT scans when measuring glenoid bone defects, indicating that taking the length-to-height ratio measurements across the glenoid is a promising way to estimate the glenoid defect. At present, a complete workup of a patient with shoulder instability includes both a CT scan and an MRI. Future research that establishes precisely how MRI misestimates CT measurements of the glenoid can perhaps obviate the need for 2 scans.
Acknowledgment
The authors thank Colin O’Rourke for his help with statistical analysis of the data.
Footnotes
The authors declared that they have no conflicts of interest in the authorship and publication of this contribution.
References
- 1. Bishop JY, Jones GL, Rerko MA, Donaldson C. MOON Shoulder Group. 3-D CT is the most reliable imaging modality when quantifying glenoid bone loss. Clin Orthop Relat Res. 2013;471:1251–1256. [DOI] [PMC free article] [PubMed] [Google Scholar]
- 2. Bois AJ, Fening SD, Polster J, Jones MH, Miniaci A. Quantifying glenoid bone loss in anterior shoulder instability: reliability and accuracy of 2-dimensional and 3-dimensional computed tomography measurement techniques. Am J Sports Med. 2012;40:2569–2577. [DOI] [PubMed] [Google Scholar]
- 3. Bushnell BD, Creighton RA, Herring MM. Bony instability of the shoulder. Arthroscopy. 2008;24:1061–1073. [DOI] [PubMed] [Google Scholar]
- 4. Chandnani VP, Yeager TD, DeBerardino T, et al. Glenoid labral tears: Prospective evaluation with MRI imaging, MR arthrography, and CT arthrography. AJR Am J Roentgenol. 1993;161:1229–1235. [DOI] [PubMed] [Google Scholar]
- 5. Dodson CC, Cordasco FA. Anterior glenohumeral joint dislocations. Orthop Clin North Am. 2008;39:507–518. [DOI] [PubMed] [Google Scholar]
- 6. Gyftopoulos S, Hasan S, Bencardino J, et al. Diagnostic accuracy of MRI in the measurement of glenoid bone loss. AJR Am J Roentgenol. 2012;199:873–878. [DOI] [PubMed] [Google Scholar]
- 7. Huijsmans PE, Haen PS, Kidd M, Dhert WJ, van der Hulst VP, Willems WJ. Quantification of a glenoid defect with three-dimensional computed tomography and magnetic resonance imaging: a cadaveric study. J Shoulder Elbow Surg. 2007;16:803–809. [DOI] [PubMed] [Google Scholar]
- 8. Landis JR, Koch GG. The measurement of observer agreement for categorical data. Biometrics. 1977;33:159–174. [PubMed] [Google Scholar]
- 9. Lee RK, Griffith JF, Tong MM, Sharma N, Yung P. Glenoid bone loss: assessment with MR imaging. Radiology. 2013;267:496–502. [DOI] [PubMed] [Google Scholar]
- 10. Magarelli N, Milano G, Sergio P, Santagada DA, Fabbriciani C, Bonomo L. Intra-observer and interobserver reliability of the ‘pico’ computed tomography method for quantification of glenoid bone defect in anterior shoulder instability. Skeletal Radiol. 2009;38:1071–1075. [DOI] [PubMed] [Google Scholar]
- 11. Omoumi P, Teixeira P, Lecouvet F, Chung CB. Glenohumeral joint instability. J Magn Reson Imaging. 2011;33:2–16. [DOI] [PubMed] [Google Scholar]
- 12. Owens BD, Burns TC, Campbell SE, Svoboda SJ, Cameron KL. Simple method of glenoid bone loss calculation using ipsilateral magnetic resonance imaging. Am J Sports Med. 2013;41:622–624. [DOI] [PubMed] [Google Scholar]
- 13. Randelli P, Ragone V, Carminati S, Cabitza P. Risk factors for recurrence after Bankart repair a systematic review. Knee Surg Sports Traumatol Arthrosc. 2012;20:2129–2138. [DOI] [PubMed] [Google Scholar]
- 14. Shah AS, Karadsheh MS, Sekiya JK. Failure of operative treatment for glenohumeral instability: etiology and management. Arthroscopy. 2011;27:681–694. [DOI] [PubMed] [Google Scholar]
- 15. Simonet WT, Melton LJ 3rd, Cofield RH, Ilstrup DM. Incidence of anterior shoulder dislocation in Olmsted County, Minnesota. Clin Orthop Relat Res. 1984;186:186–191. [PubMed] [Google Scholar]
- 16. Tian CY, Shang Y, Zheng ZZ. Glenoid bone lesions: comparison between 3D VIBE images in MR arthrography and nonarthrographic MSCT. J Magn Reson Imaging. 2012;36:231–236. [DOI] [PubMed] [Google Scholar]
- 17. Zacchilli MA, Owens BD. Epidemiology of shoulder dislocations presenting to emergency departments in the united states. J Bone Joint Surg Am. 2010;92:542–549. [DOI] [PubMed] [Google Scholar]


