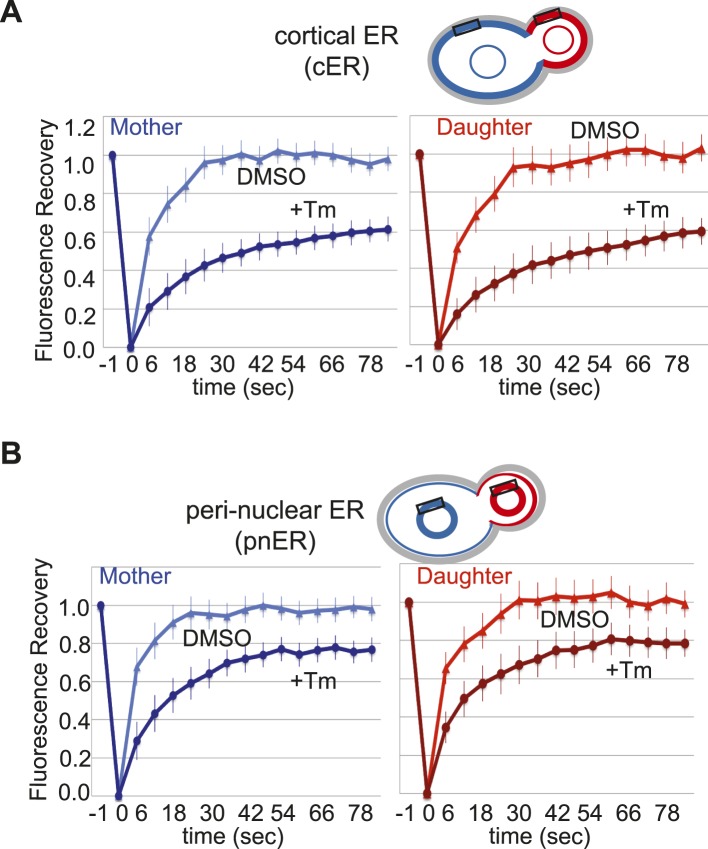
Figure 6. Mother and daughter cells display similar degrees of cortical and perinuclear ER stress.
(A) Quantification of ER stress was performed by fluorescence recovery after photobleaching (FRAP) of cells labeled with the ER chaperone Kar2/BiP-sfGFP. Cells were exposed to DMSO or Tm (1 μg/ml) and then discrete regions of cER (indicated by the black rectangles) in mother (blue) and daughter (red) cells were photobleached and recovery was monitored. (B) Cells were treated as in A, except that FRAP was monitored in the indicated regions of the perinuclear ER (pnER; rectangles). cER and pnER stress, as indicated by the rate of FRAP, was comparable in untreated or Tm-treated mother and daughter cells. The results are the average of three independent experiments, each of which analyzed at least seven independent cells under both DMSO and Tm-treated conditions.

