Abstract
Background: Bronchial asthma is a chronic airway inflammatory disease that involves T lymphocytes. Methods: In order to explore the effect of Lactobacillus salivarius on Th1/Th2 cytokines and the number of spleen CD4+ CD25+ Foxp3+ Treg in asthma Balb/c mouse, we constructed acute asthma model with ovalbumin to observe the mouse behavior change in Balb/c mice. The expression of GATA-3 mRNA and T-bet mRNA was measured by real-time PCR. The proportion of CD4+ CD25+ Foxp3+ Treg/CD4+ was determined by flow cytometry. Results: The results demonstrated that oral gavage with Lactobacillus salivarius before sensitization could alleviate the clinical symptoms, airway hyper-reactivity and airway inflammation in asthma mouse to some extent; Lactobacillus salivarius may improve the imbalance of Th1/Th2 in asthma mouse through increasing the expression of T-bet mRNA at the transcriptional level and inhibiting the expression of GATA-3 mRNA simultaneously. Conclusion: CD4+ CD25+ Foxp3+ Treg cells may be involved in the pathogenesis of bronchial asthma, and may be the upstream regulatory mechanism of the improvement of Th1/Th2 imbalance by Lactobacillus salivarius.
Keywords: Lactobacillus salivarius, asthma, helper T cells, GATA-3, T-bet, regulatory T cells
Introduction
Bronchial asthma is the most common chronic allergic disease in children, with a gradually increasing incidence in the last 3 decades. A large number of epidemiological investigations indicate that the living environment “hygienization” (i.e. hygienics hypothesis) may cause the increase of children asthma morbidity, and the intestinal flora plays an important role in the “hygienics hypothesis”. Current study showed the different composition between healthy and allergic children as well as between the children in nations with various morbidity of allergic diseases [1-3]. Two birth cohort studies reported the condition of intestinal flora at the 1st month after birth could predict the repeated gasp or possible asthma episode in future childhood [4,5]; the probiotics preparation that could regulate the function of intestinal flora may be beneficial to the treatment and prevention of allergic diseases, such as children asthma.
Bronchial asthma is a chronic airway inflammatory disease that several cells (such as eosinophils, mast cells, T lymphocytes, neutrophils, and airway epithelial cells, etc.) and cellular components were involved. This chronic inflammation can cause the increase of airway reactivity, which usually leads to extensive limitation of reversible airflow and repeated gasp, shortness of breath, chest tightness or cough. These symptoms usually occur or exacerbate at night and (or) in the morning. With the increasing morbidity, asthma has caused severe effects on the patient children, family and social economy. To date, the inhaled glucocorticoids are the most effective therapy. Many reports demonstrated that overdose of inhaled glucocorticoids could cause hormone-like adverse reactions and drug dependence or drug resistance. In addition, inhaled glucocorticoids therapy neglects the regulation of the children systemic immune system, therefore, it is necessary to look for an alternative drug of hormone to treat asthma. The nature of bronchial asthma is the airway hyper-reactivity (AHR) and airway allergic inflammation, among others, T lymphocytes play a key role in the initiation and amplification of asthma inflammation. The role of Th1/Th2 imbalance in asthma airway inflammation has been extensively recognized. Some studies presented the hypothesis that intestinal flora imbalance involved in the pathogenesis and development of atopic allergic diseases [6]. Noverr et al. [7] changed the structure of intestinal flora in laboratory animals by antibiotics induction method and predicted the allergic airway diseases in laboratory animals. To date, some clinical studies demonstrated that the probiotics, which was extensively used to treat diarrhea, could treat and prevent the food allergy in infants. In 2002, the definition of probiotics was: the microorganism that was beneficial to the host’s health if it was supplied adequately [8].
In this study, we sensitized and challenged Balb/c mouse with OVA to construct the acute asthma model, and performed oral gavage with Lactobacillus salivarius from 2 weeks before sensitization to the end of model construction. Through detection of mouse airway hyper-reactivity, pathology and inflammatory cytokines, we examined the effect of probiotics intervention on the airway inflammation in acute asthma mouse model and hoped to provide new strategy for the immunological treatment and prevention of bronchial asthma.
Materials and methods
Materials
Ovalbumin (OVA, Grade II) was purchased from Sigma (US) Aluminum hydroxide powder was purchased from Shenyang 3rd Chemical Factory; Kangminyuan lyophilized powder, the oral formulation of Lactobacillus salivarius was manufactured by Taiwan Dongyu Biotechnology Ltd.; mouse IgE, ECP, IL-4, IFN-γ and TGF-βELISA kits were purchased from R&D company; methacholine (Ach) was kindly provided by First Affiliated Hospital of China Medical University Lung Function Department; Trizol total RNA extract, real-time quantitative PCR kit and PCR primer design were from Dalian TAKARA Bioengineering Inc. DMEM medium (Gibco), fetal bovine serum (FBS) (Hyclone), RBC lysis buffer (Solarbio), anti-Mouse CD4-FITC, anti-Mouse CD25-APC, anti-Mouse/Rat Foxp3-PE, rat IgG2a K Isotype Control-PE, Foxp3 Staining Buffer Set (eBioscience), anti-Rabbit Foxp3 polyclonal antibody (Abcam) (primary antibody); healthy male SPF Balb/c mice (4 week, body weight 16-18 g) were provided by Shengjing Hospital of China Medical University Animal Laboratory.
Methods
Animal grouping and model construction
Animal grouping: Thirty SPF Balb/c mice were allocated into 3 groups randomly, with 10 mice in each group. For asthma group (A group), the mice were sensitized with 0.2 mL mixture of OVA and aluminium hydroxide (OVA 40 μg, aluminium hydroxide 4.5 mg) in the peritoneal cavity on Day 1, 8 and 15. from Day 22, the mice were placed in a self-made closed container (20 cm ×20 cm ×20 cm) and inhaled 4% OVA ultrasonic spray for 30 min, qd, for 7 days; for asthma + Lactobacillus salivarius group (AH group), oral gaavge was performed with Lactobacillus salivarius 2 weeks before first peritoneal cavity sensitization, qd, until the end of the experiment. In each administration day, resolved probiotics lyophilized powder with mouse drinking water, 0.5 mL for oral gavage (containing approximately 0.5×10⁹ cfu live bacteria); for normal control group (N group), peritoneal cavity sensitization and challenge were performed with equal amount of normal saline instead of OVA. The other 32 (group II) mice were allocated into 4 groups evenly, i.e. Asthma group (A group), normal control group (N group), asthma + Lactobacillus salivarius group (AH group), Lactobacillus salivarius oral gavage group (H group) (the construction of model was as previously described, for H group, peritoneal cavity sensitization and spray inhalation were performed with equal amount of normal saline instead of OVA, the amount of oral gavage with Lactobacillus salivarius was euqal to that of Lactobacillus salivarius group).
Determination of the airway reactivity by spirograph
For mice in I group, the airway reactivity was determined 24 hours after last challenge. In this study, the airway reactivity of Balb/c mouse was determined by non-invasive method on the basis of Penh parameter (enhanced pause, Penh). Penh determined the enhanced expiratory pause time, i.e. placed mouse freely in a closed container, where the pressure varied with the mouse breath. The mouse breath curve could be obtained through measuring the change of the pressure within the container. Then the value of Penh could be calculated on the basis of the formula: Penh = PEP/PIP×Pause. PEP (peak exhalation pressure) was the peak value of the pressure during exhalation, PIP (peak inspiration pressure) was the peak value of the pressure during inspiration, Pause was the exhalation pause = (Te-Tr)/Tr, Te was the exhalation time, Tr was the passive exhalation time, i.e., the time that was needed for the recorded pressure decreasing to 36% of PEP during exhalation, the calculation was conducted by system software. Specific method: the determination was performed 24 hours after last antigen challenge, placed each mouse in the body-scanning box in turn, let the mouse to adapt to the environment for 3 min. Measured the baseline value and Penh values that challenged with normal saline, 6.25 mg/mL Mch, 12.5 mg/mL Mch, 25 mg/mL Mch and 50 mg/mL Mch methyl acetylcholine (Mch) orderly. The spray inhalation time was 1 min, baseline value and the Penh value of each challenge dose were the mean values 3 min after spraying.
Specimen collection
After determination of the airway reactivity, injected 10% chloral hydrate in the peritoneal cavity for anaesthesia, collected blood in the abdominal aorta with 1 mL syringe and sacrificed the mouse. After stablization for 30 min, centrifuged the collected blood with a refrigerated centrifuge, 3000 rpm, 10 min, isolated the serum, aliquoted and stored the serum at -20°C for ELISA. Isolated full trachea and lung tissues, placed the trachea into 2.5% glutaraldehyde for electronic microscopy; removed the right middle lung rapidly and put in 4% paraformaldehyde for fixation, embedded the section with paraffin. The thickness of the section was 4 μm. Performed HE staining; put other lung tissues into EP tubes and stored in a -80°C refrigerator for praparation of lung tissue homogenate and real-time PCR analysis. Put the sterile mouse spleens (4 groups) on the bench after model construction in group II and prepared for cell isolation. Washed the spleen twice with PBS, crushed the spleen tissue with syringe needle to form cell suspension; filtered the suspension with 200 mesh filter, centrifuged at 1000 rpm for 5 min, removed the supernatant and reserved the pellet; Washed the cells twice with PBS, centrifuged at 1000 rpm for 10 min, removed the supernatant and reserved the pellet; added RBC lysis buffer 2 mL to resuspend the cells, incubated at room temperature for 5 min, centrifuged at 1000 rpm for 10 min. Adjusted the concentration of the extracted primary splenocytes for flow cytometry, some splenocytes were subjected to cell culture (resolved 0.5 g ovalbumin in 10 ml of DMEM medium containing 10% FBS, filtered the mixture for use; inoculated 2×10⁶ cells/well in a 24 well plate in triplicate; 72 hours later, collected the supernatant for ELISA detection, the cells were stored in a -80°C refrigerator).
Histopathological examination and scoring
Stained the lung tissue with HE staining, observed the inflammatory cell infiltration beneath mouse bronchial mucosa and in peripheral lung tissues. As previously described [9], graded the degree of inflammatory infiltration: 0, not any inflammatory cells; 1, little inflammatory cells; 2, the inflammatory cells formed a circle, with a thickness of 1 cell; 3, the inflammatory cells formed a circle, with a thickness of 2-4 cells; the inflammatory cells formed a circle, with a thickness of >4 cells.
Determination of the levels of IgE, ECP, IL-4 and IFN-γ in serum and lung tissue homogenate
Determined the level of IL-4 and IFN-γ in the supernatant of splenocyte culture. ELISA was performedas described in the instruction provided in the kit. Optical density density (OD value) at 450 nm was meausred with a microplate reader, calculated the linear regression equation of the standard curve with the concentration of standard and the OD values, put the OD values of samples in the equation and calculated the sample concentration, which was then multiplied with the dilution factor, as such, we could obtain the actual concentration of samples.
Determination of the expression of GATA-3 mRNA andT-bet mRNA by real-time fluorescence quantitative PCR
Fluoresence quantitative PCR analysis was performed with SYBR Green I nucleic acid dye. The reaction procedure was: 95°C, 30 s; 95°C, 5 s; 60°C, 30 s; 40 cycles. The fluorescence signal during extension and the melting curve after amplification were recorded. Each sample was analyzed in triplicate. The relative change fold of gene expression was calculated by 2-ΔΔCt method. Table 1 summarized the primers used for fluoresence quantitative PCR analysis.
Table 1.
The sequence of the primers for fluoresence quantitative PCR analysis
| Name | Primer sequence | Length of the amplified fragment |
|---|---|---|
| GATA-3 | Sense: 5’-GGATGTAAGTCGAGGCCCAAG-3’ | 117 bp |
| Anti-sense: 5’-ATTGCAAAGGTAGTGCCCGGTA-3’ | ||
| T-bet | Sense: 5’-GTTCAACCAGCACCAGACAGAG-3’ | 135 bp |
| Anti-sense: 5’-TGGTCCACCAAGACCACATC-3’ | ||
| β-actin | Sense: 5’-CTGTGCCCATCTACGAGGGCTAT-3’ | 155 bp |
| Anti-sense: 5’-TTTGATGTCACGCACGATTTCC-3’ |
Determination the ratio of CD4+ T cells to CD4+ CD25+ Foxp3+ T cells in splenic lymphocytes by flow cytometry
The liquid volume in the FACS tube was adjusted to 100 ul, added fluorescence-labelled CD4 and CD25 antibodies as instructed, the concentration of CD4 antibody was 0.125 ug, and the concentration of CD25 antibody was 0.06 ug. Added “Affinity Purfied anti-mouse CD16/32 (Fc Block)” in the control tube 1, with a concentration of 1 ug/tube, incubated at 4°C in dark for 30 min; washed the cells with pre-cool Flow Cytometry staining Buffer, resuspended the cells by vortex shaking, added fixation/permeabilization buffer 1 mL, and performed vortex again, incubated at 4°C in dark for 40 min; added diluted Permeabilization Buffer 2 mL to washed the cells, discarded the supernatant after centrifuge; repeated the previous washing; added 2% rat serum, incubated at 4°C in dark for 15 min; added Foxp3-PE-labelled antibody, with a concentration of 0.5 ug/well, added IgG2a-PE-labelled antibody, with a concentration of 0.5 ug/well, incubated at 4°C in dark for 30 min. Added diluted Permeabilization Buffer 2 mL to washed the cells, discarded the supernatant after centrifuge; repeated the previous washing. Resuspended the cells with Flow Cytometry Staining Buffer 500 ul for detection.
Statistical analysis
The data was analyzed with SPSSl3.0 software, all measurements were represented by mean ± SD (x̅±S). Firstly, normality test and homogeneity of variance analysis were performed with Shapiro-Wilk method and Levene method, respectively. If it was normal distribution and homogeneous variance, t-test or one-way ANOVA was performed for separate sample, LSD method was used for the comparison between multiple groups; if the variance was not homogeneous, Dunnett T2 method was used; P<0.05 meant significant correlation level.
Results
Observation of the mouse behavior in each group
In normal control group, no significant behavior change was observed before and after challenge, the breath was stable and the mice were active. In asthma group, the mice demonstrated significant dysphoria, head and facial itching, scratching, ecphysesis, perioral cyanochroia, complicated with manifestations of acute asthma phase, such as nod-like wheezing, abdominal breath, sneeze, stooping, retraction and lift of the forelimb and gatism. Recorded the sneeze number, the number of grabbing nose and the degree of asthma with reference to the “Methodology of Pharmacological Experiments” [10], the scoring methods was: 0 score represented no sneeze in the mice, 1 score represented 1-3 sneeze, 2 score represented 4-10 sneeze, 3 score represented >11 sneeze; 0 score represented no grabbing nose, 1 score represented mild grabbing nose, 2 score represented frequent grabbing nose, 3 score represented continuous grabbing nose; 0 score represented no gasp, 1 score represented ecphysesis, 2 score represented significant gasp, 3 score represented lethal gasp. In the normal group, no significant change was observed before and after challenge, the breath was stable and the mice were active, the total score of each mouse was 0, the total score of each mouse in asthma group was 5-8, the reactions of the mice in asthma + Lactobacillus salivarius group was relieved, with the total score of each mouse being 1-3.
Determination of the airway reactivity
There were no significant differences between the Penh values of the mice in each group at the baseline and after normal saline spraying. After administration with Ach of 2-fold concentration, especially Ach 12.5 mg/mL, the Penh values in asthma group were significantly higher than those in normal group, the difference between two groups was statistically significant (P<0.05). However, the Penh values in asthma + Lactobacillus salivarius group were significantly higher than those in asthma group, the difference between two groups was statistically significant (P<0.05) (see Table 2; Figure 1).
Table 2.
The penh change in the mice of each group under different spraying conditions (x̅±S)
| Penh | Group | ||
|---|---|---|---|
|
|
|||
| N | A | AH | |
| Baseline | 0.41±0.03 | 0.46±0.02 | 0.43±0.05 |
| NS | 0.45±0.06 | 0.51±0.05 | 0.47±0.02 |
| Ach (6.25 mg/mL) | 0.58±0.11 | 1.10±0.12* | 0.76±0.15# |
| Ach (12.5 mg/mL) | 0.79±0.17 | 2.31±0.16* | 1.50±0.06*,# |
| Ach (25 mg/mL) | 1.28±0.07 | 3.90±0.08* | 2.28±0.13*,# |
| Ach (50 mg/mL) | 2.25±0.16 | 6.76±0.13* | 3.24±0.16*,# |
Note: N: Normal control; A: Asthma; AH: Asthma + Lactobacillus salivarius.
P<0.05 (in comparison with control group);
P<0.05 (in comparison with asthma group).
Figure 1.

The effect of oral gavage with Lactobacillus salivarius on the airway reactivity of Balb/c mouse with asthma.
HE staining of lung tissue
For normal control mouse, the morphology of bronchus was regular, the lumen of bronchus was smooth, no significant hyperplasia in the epithelium or no thickness in the bronchial wall was seen; the alveolar septa was normal, the structure of alveolar wall was integrated, no inflammatory exudate was seen in the alveolar septum and bronchus, no significant inflammatory cell infiltration was seen around the bronchial and vascular walls. The airway epithilium of the mice in asthma group was not integrated, significant airway mucosal edema, thickening of the alveolar septum, hyperplasia and thickening of the airway smooth muscle, thickening of the bronchial wall and luminal stenosis were seen. Many inflammatory secretions were seen in the lumen, a large amount of inflammatory cell infiltration was seen around the bronchial and vascular walls, predominatly EOS and lymphocyte infiltration. The pathological change was significantly relieved in asthma + Lactobacillus salivarius group than that in the asthma group, no abscission was in the mucous epithelium, no significant hyperplasia or mucous secretion was seen, the inflammatory cell infiltration around the bronchial and vascular wall was significantly decreased (see Figure 2). Observed the inflammatory cell infiltration beneath the bronchial mucosa and in the peripheral lung tissue under optical microscope. Graded the degree of inflammatory infiltration according to the literature [9]: 0: not any inflammatory cells; 1: little inflammatory cells; 2: the inflammatory cells formed a circle, with a thickness of 1 cell; 3: the inflammatory cells formed a circle, with a thickness of 2-4 cells; the inflammatory cells formed a circle, with a thickness of >4 cells.
Figure 2.
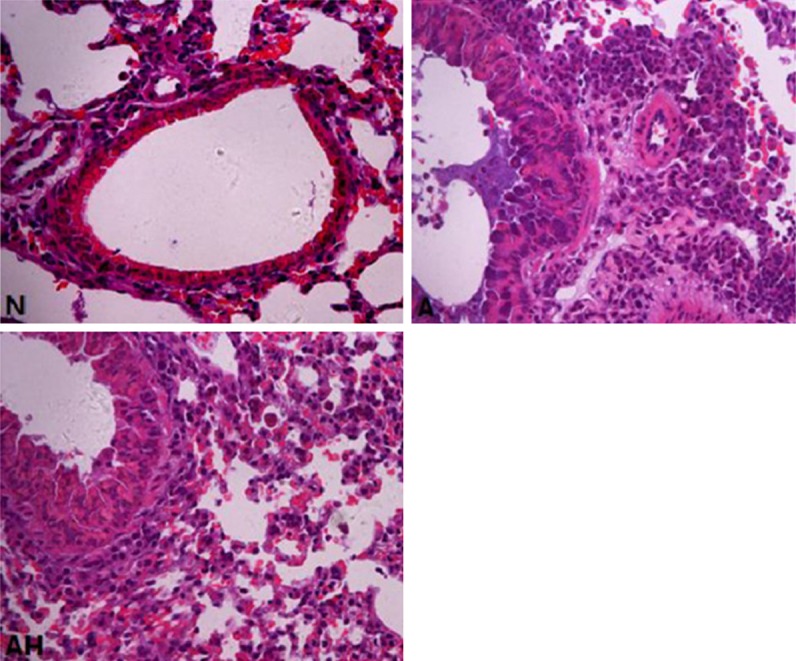
The comparison of lung tissue HE staining in the mice of each group (×400). N: Normal control; A: Asthma; AH: Asthma + Lactobacillus salivarius.
Comparison of the airway inflammation score
In comparison with normal control: the airway inflammation score in the asthma group was significantly increased (P<0.05); In comparison with the asthma group: the airway inflammation score in the asthma + Lactobacillus salivarius group was significantly decreased (P<0.05) (see Table 3).
Table 3.
Comparison of the airway inflammation scores in the mice in each group
P<0.05 (in comparison with the control group);
P<0.05 (in comparison with the asthma group).
The change of tracheal cilia under transmission electron microscope
The distribution of mouse tracheal cilia in normal control was dense. The abscission of mouse airway cilia in asthma group was significant, and the number of abscised cilia was significantly decreased than in the control group. The number of cilia in the asthma + Lactobacillus salivarius group was significantly more than that in the asthma group (see Figure 3).
Figure 3.

The changes of the trachea cilium number in the mice in each group under transmission electron microscope (×4000). N: Normal control; A: Asthma; AH: Asthma + Lactobacillus salivarius.
The ELISA results of the mouse serum and lung tissue homogenate in each group
Comparison of the IgE level
The IgE levels in mouse serum and lung tissue homogenate in asthma group were significantly increased than control group (P<0.05); however, the IgE levels in mouse serum and lung tissue homogenate in asthma + Lactobacillus salivarius group were significantly decreased than asthma group (P<0.05) (see Figures 4, 5).
Figure 4.

Comparison of the levels of mouse serum IgE in each group (μg/mL); a indicates p<0.05 in comparison with N group, and b indicates p<0.05 in comparison with A group.
Figure 5.

Comparison of the levels of IgE in mouse lung tissue homogenate in each group (μg/ml). Note: N: Normal control; A: Asthma group; AH: asthma + Lactobacillus salivarius group; a indicates p<0.05 in comparison with N group, and b indicates p<0.05 in comparison with A group.
Comparison of the ECP level
The ECP levels in mouse serum and lung tissue homogenate in asthma group were significantly increased compared to control group (P<0.05); however, the ECP levels in asthma + Lactobacillus salivarius group were significantly decreased (P<0.05), but the ECP level was still higher than control group (P<0.05). (see Figure 6).
Figure 6.
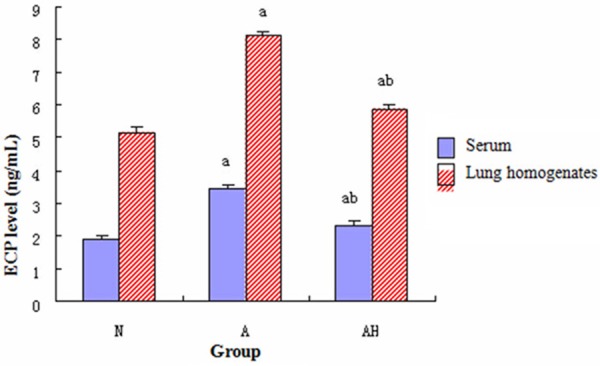
Comparison of the levels of ECP in mouse serum and lung tissue homogenate in each group. a indicates p<0.05 in comparison with N group, and b indicates p<0.05 in comparison with A group.
Comparison of the IL-4 level
The IL-4 levels in mouse serum and lung tissue homogenate in asthma group were significantly increased than control group (P<0.05); however, the IL-4 levels in mouse serum and lung tissue homogenate in asthma + Lactobacillus salivarius group were significantly decreased than asthma group, but were still higher than control group (P<0.05). (see Figure 7).
Figure 7.
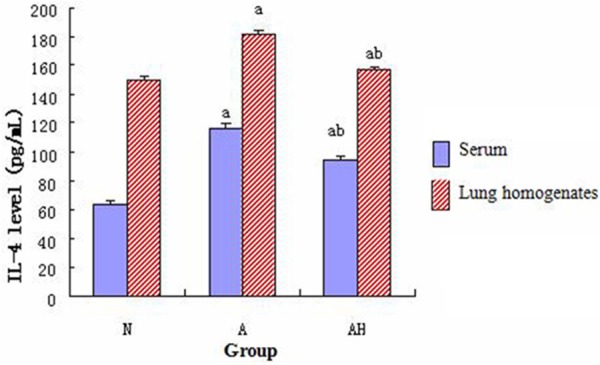
Comparison of the IL-4 in mouse serum and lung tissue homogenate in each group; a indicates p<0.05 in comparison with N group, and b indicates p<0.05 in comparison with A group.
Comparison of the IFN-γ level
The IFN-γ levels in mouse serum and lung tissue homogenate in asthma group were significantly increased than control group (P<0.05); however, The IFN-γ levels in mouse serum and lung tissue homogenate in asthma + Lactoacillus salivarius group were significantly increased than asthma group, but were still lower than control group (P<0.05) (see Figure 8).
Figure 8.

Comparison of the IFN-γ in mouse serum and lung tissue homogenate in each group. a indicates p<0.05 in comparison with N group, and b indicates p<0.05 in comparison with A group.
Comparison of the IL-4 level in the supernatant of splenocyte culture
The IL-4 level in the supernatant of splenocyte culture in asthma group was significantly increased than control group (P<0.05); however, the IL-4 levelin asthma + Lactobacillus salivarius group was significantly decreased than asthma group, but was still higher than control group (P<0.05); the IL-4 level in the single oral gavage group with Lactobacillus salivarius was decreased than control group (P<0.05) (see Figure 9).
Figure 9.
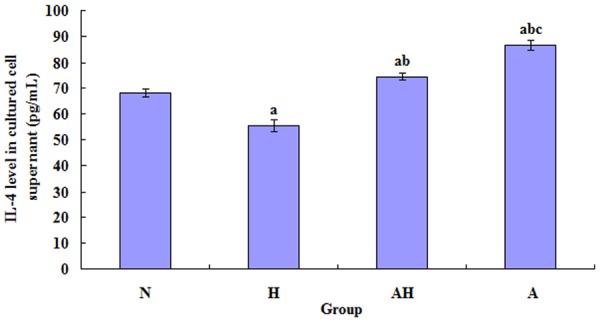
Comparison of the levels of IL-4 in the supernatant of splenocyte culture of each group. a indicates p<0.05 in comparison with N group; b indicates p<0.05 in comparison with H group; c indicates p<0.05 in comparison with AH group.
Comparison of the IFN-γ level in the supernatant of splenocyte culture
The IFN-γ level in the supernatant of splenocyte culture in asthma group was significantly decreased than control group (P<0.05); however, the IFN-γ level in asthma + Lactobacillus salivarius group was significantly increased than asthma group, but was still lower than control group (P<0.05); the IFN-γ level in the single oral gavage group with Lactobacillus salivarius was increased than control group (P<0.05) (see Figure 10).
Figure 10.
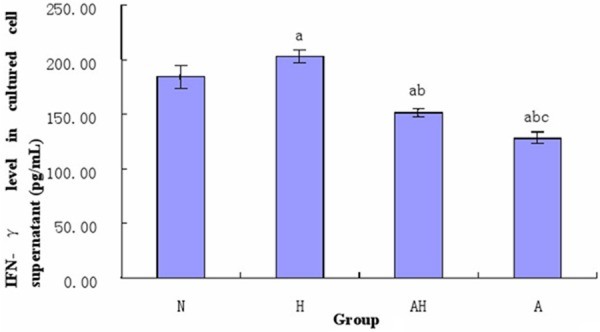
Comparison of the levels of IFN-γ in the supernatant of splenocyte culture of each group. a indicates p<0.05 in comparison with N group; b indicates p<0.05 in comparison with H group; c indicates p<0.05 in comparison with AH group.
The expression of GATA-3 mRNA and T-bet mRNA in the mouse lung tissue in each group
According to the real-time PCR analysis, the expression of GATA-3 mRNA in the mouse lung tissue of asthma group was significantly increased than control group (P<0.05); the expression of GATA-3 mRNA in the mouse lung tissue of asthma + Lactobacillus salivarius group was significantly decreased than asthma group (P<0.05), but was still higher than control group (P<0.05); the expression of T-bet mRNA in asthma + Lactobacillus salivarius group was significantly increased than asthma group (P<0.05), but was still lower than control group (P<0.05) (see Table 4 and Figures 3, 11, 12).
Table 4.
Relative expression level of GATA-3 mRNA and T-bet mRNA in the mouse lung tissue in each group (x̅±S)
| Group | GATA-3 mRNA | T-bet mRNA |
|---|---|---|
| Normal control | 1.03±0.04 | 1.00±0.03 |
| Asthma | 3.26±0.34a | 0.29±0.02a |
| Asthma + Lactobacillus salivarius | 1.97±0.21a,b | 0.58±0.07a,b |
indicates p<0.05 in comparison with N group;
indicates p<0.05 in comparison with A group.
Figure 11.
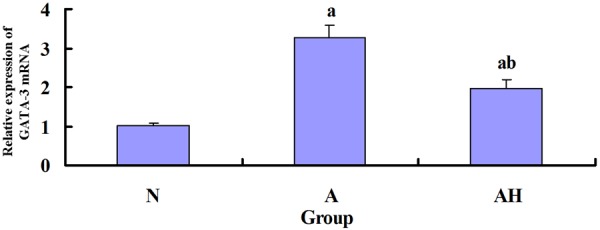
The expression of GATA-3 mRNA in mouse lung tissue in each group. a indicates p<0.05 in comparison with N group, and b indicates p<0.05 in comparison with A group.
Figure 12.
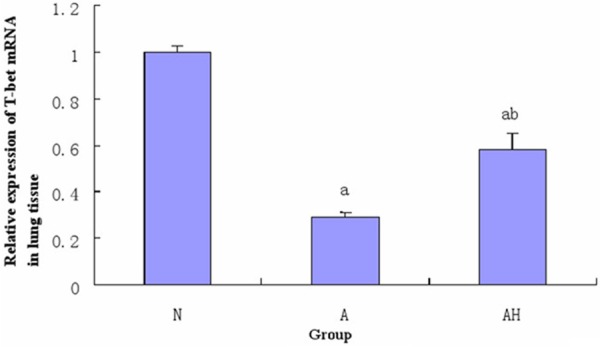
The expression of T-bet mRNA in mouse lung tissue in each group. a indicates p<0.05 in comparison with N group, and b indicates p<0.05 in comparison with A group.
Determination of the ratio of CD4+ CD25+ T cells and CD4+ CD25+ Foxp3+ T cells to CD4+ T cells in splenic lymphocytes by flow cytometry
Both the ratio of CD4+ CD25+ T cells and CD4+ CD25+ Foxp3+ T cells in asthma group were lower than normal control and Lactobacillus salivarius intervention group (P<0.05); the ratio of CD4+ CD25+ Foxp3+ T cells in Lactobacillus salivarius group were significantly increased than asthma group (P<0.05), but was still lower than Lactobacillus salivarius group and normal control (P<0.05), the ratio in Lactobacillus salivarius group was higher than normal control (P<0.05) (Table 5; Figures 13, 14A, 14B, 15).
Table 5.
CD4+ CD25+/CD4+ T and CD4+ CD25+ Foxp3+/CD4+ T (x̅±S) in splenic lymphocytes
| Group | UR (CD4+ CD25+) % | CD4+ CD25+ Foxp3+ % |
|---|---|---|
| Normal control (N) | 9.83±0.02 | 8.35±0.05 |
| Lactobacillus salivarius group (H) | 10.47±0.17d | 8.64±0.06a |
| Asthma + Lactobacillus salivarius (AH) | 9.43±0.04a,b | 7.90±0.03a,b |
| Asthma (A) | 7.11±0.03a,b,c | 5.37±0.07a,b,c |
indicates p<0.05 in comparison with N group;
indicates p<0.05 in comparison with H group;
indicates p<0.05 in comparison with AH group;
indicates p>0.05 in comparison with N group.
Figure 13.
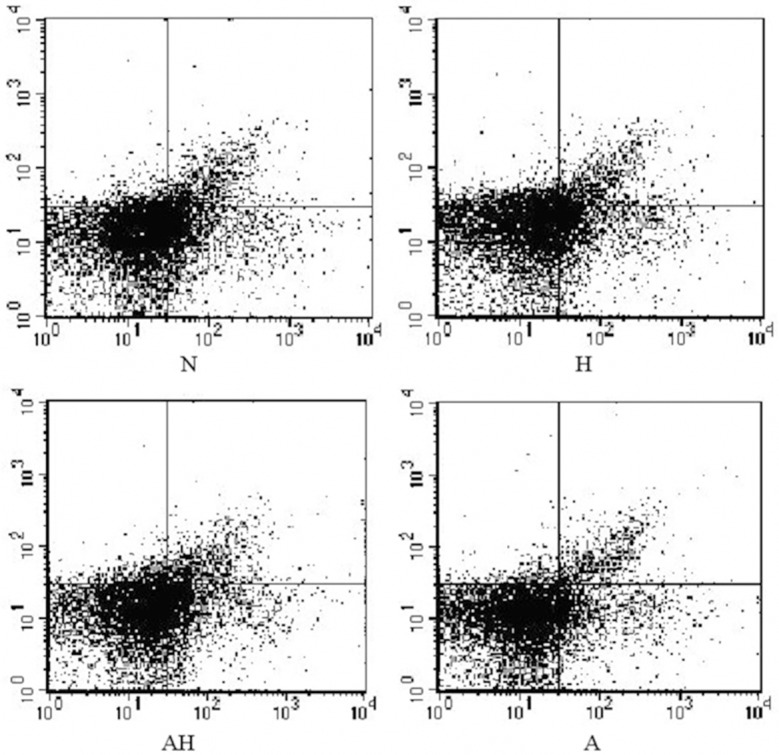
The percentage of CD4+ CD25+ T cells in CD4+ T cells.
Figure 14.
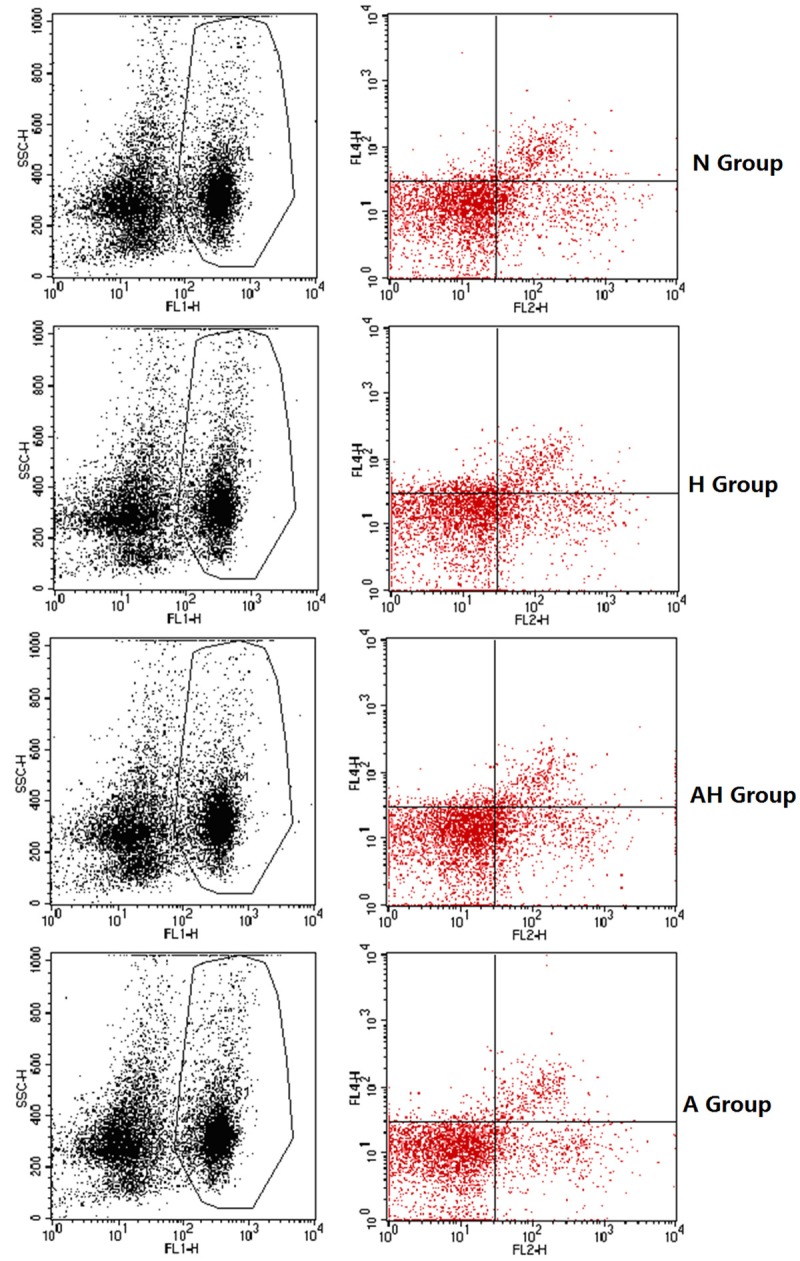
A, B. The percentage of CD4+ CD25+ Foxp3+ T cells in CD4+ T cells.
Figure 15.

The percentage of CD4+ CD25+ T cells and CD4+ CD25+ Foxp3+ T cells in CD4+ T cells. a indicates p<0.05 in comparison with N group; b indicates p<0.05 in comparison with H group; c indicates p<0.05 in comparison with AH group; d indicates p>0.05 in comparison with N group.
Discussion
In this study, the trachea reactivity in asthma mouse was increased, a large amount of inflammatory cell infiltration (predominantly eosinophils) around bronchus and vessels and abscised airway cilia were seen, and the IgE and ECP levels in serum and lung tissue homogenate were significantly higher than normal control. All these results indicated a successful asthma model. The effects of Th1/Th2 immune imbalance in asthma episode was achieved the produced cytokines [9]. IL-4 was thought as a Th2-type cytokine that played the key role in asthma inflammation; IFN-γ was thought to be an important Th1-type cytokine that was anti-asthma airway inflammation [10]. IL-4 and IFN-γ could influence and inhibit each other in the pathogenesis of asthma. In the asthma model, we usually used the expression change of IFN-γ and IL-4 to reflect the imbalance status of Th1/Th2 immune response indirectly. The result of this study was similar with previous results, ie. Both the levels of IFN-γ in the serum and lung tissue homogenate of asthma mouse were decreased, the level of IL-4 was increased, the manifestation was enhanced expression of Th2-type cytokines and weakened Th1-type cytokines, therefore, it demonstrated the presence of hyperfunction of Th2 cell activation and Th1/Th2 immune imbalance in asthma.
In this study, the Th2 cytokine (IL-4) in the supernatant of splenocyte culture was significantly increased in the asthma group than that in the normal control group, while the Th1 cytokine (IFN-γ) was significantly decreased than control group, both differences were statistically significant. However, the level of IL-4 in asthma + Lactobacillus salivarius group was significantly decreased than asthma group, while the level of IFN-γ was significantly increased than asthma group. This result was consistent with the observation by Y et al. [11], i.e., the change of IL-4 and IFN-γ in ovalbumin-sensitized splenocytes that were intervened by Bifidobacterium breve M-16V and were re-challenged with OVA in vitro. Therefore, we thought that Lactobacillus salivarius intervention could enhance the Th1 immune response in ovalbumin-sensitized splenic lymphocytes and weaken Th2 immune response. In addition, the level of IFN-γ in the supernatant of splenocyte culture of the simple oral gavage group with Lactobacillus salivarius was increased than control group, the level of IL-4 was decreased than control group, and it indicated that some probiotics bacteria could play the role of immune regulation in the absence of specific antigen. Therefore, this study further demonstrated that Lactobacillus salivarius could alleviate the imbalance of Th1/Th2 in asthma through in vitro experiment at cellular level.
With the progress of the study in the regulatory function of helper T cell (Th) differentiation, it has been demonstrated that besides Th1 cells and Th2 cells that are differentiated from helper T cells after receiving the signal transduction of antigen presenting cells, another T cell subset, which is different from Th1 and Th2 cells in the respect of function and cytokine production, is also differentiated, it is called regulatory T cell (Treg). Treg has many subsets; it can be classified as nature regulatory T cells (nTreg) and induced regulatory T cells (iTreg) according to the source [12]. The naturally occurring CD4+ CD25+ Treg is originated from the thymus. The induced CD4+ CD25+ Treg is the immature dendritic cells, and is transformed from peripheral CD4+ CD25- T cells by the induction of IL-10, IFN-γ, TGF-β or low-dose antigen; therefore, it is called iTreg. CD4+ CD25+ Treg has 2 functional characteristics of immune incompetence and inhibition [13]. The mechanism of Treg effect had not been clear recently. CD4+ CD25+ Treg could mediate immune inhibition through direct intercellular contact and cytokine secretion [14], it could inhibit the immune response through the above-mentioned mechanism simultaneously, maintained the inhibitory immune functions, and the former was more important than the latter [15]. Forkhead/winged helix transcription factor (Foxp3) was specifically expressed in CD4+ CD25+ Treg; it could reflect the level and functional activity of CD4+ CD25+ Treg to some extent. It was also recognized that Foxp3 was a specific marker of regulatory T lymphocyte [16,17]. Abdulamir et al. [18] found that the level of asthma CD4+ CD25+ Foxp3+ T lymphocytes was significantly lower than the healthy control, the level of Treg in acute phase was significantly lower than relieve phase group and healthy control, and the level of Treg in severe group was significantly lower than mild group. However, Lin et al. [19], indicated the function of children’s CD4+ CD25+ T lymphocytes were deficient. As previous studies, this study also found the ratio of CD4+ CD25+ Treg to CD4+ T cells in asthma mouse lymphocytes was significantly decreased than control, it further demonstrated the decreasing number of CD4+ CD25+ Treg and hypofunction may be an important reason of asthma pathogenesis. We predicted that the decreasing number of CD4+ CD25+ Treg may be important in the imbalance of Th1/Th2 in asthma, Lactobacillus salivarius may up-regulate the number of CD4+ CD25+ Treg and promote the function, so as to alleviate the imbalance of Th1/Th2.
This study further supported the idea that oral probiotics could function immune regulation, and the function was not limited to the gastrointestinal tract, these induction of regulation indicated the selected bacteria strain may be beneficial to a series of atopic diseases. Recently, the knowledge of the precise mechanism of immune tolerance was limited. However, it was sure that the defect of immune tolerance mechanism played an important role in the pathogenesis of allergic diseases, such as asthma. Therefore, the study of the pathogenesis and development of asthma from the point of immune tolerance may be a new approach of the treatment and prevention of asthma. With the progress of the study of immune tolerance mechanism, the treatment and prevention of asthma had been continuously improved. The reversion of immune tolerance defect and probiotics preparation may be beneficial to the treatment and prevention of allergic diseases, such as asthma, in future.
Disclosure of conflict of interest
None.
References
- 1.Björkstén B, Naaber P, Sepp E, Mikelsaar M. The intestinal microflora in allergic Estonian and Swedish 2-year-old children. Clin Exp Allergy. 1999;29:342–346. doi: 10.1046/j.1365-2222.1999.00560.x. [DOI] [PubMed] [Google Scholar]
- 2.Watanabe S, Narisawa Y, Arase S, Okamatsu H, Ikenaga T, Tajiri Y, Kumemura M. Differences in fecal microflora between patients with atopic dermatitis and healthy control subjects. J Allergy Clin Immunol. 2003;111:587–591. doi: 10.1067/mai.2003.105. [DOI] [PubMed] [Google Scholar]
- 3.Kalliomäki M, Kirjavainen P, Eerola E, Kero P, Salminen S, Isolauri E. Distinct patterns of neonatal gut microflora in infants in whom atopy was and was not developing. J Allergy Clin Immunol. 2001;107:129–134. doi: 10.1067/mai.2001.111237. [DOI] [PubMed] [Google Scholar]
- 4.Penders J, Thijs C, van den Brandt PA, Kummeling I, Snijders B, Stelma F, Adams H, van Ree R, Stobberingh EE. Gut microbiota composition and development of atopic manifestations in infancy: the KOALA Birth Cohort Study. Gut. 2007;56:661–667. doi: 10.1136/gut.2006.100164. [DOI] [PMC free article] [PubMed] [Google Scholar]
- 5.Vael C, Vanheirstraeten L, Desager KN, Goossens H. Denaturing gradient gel electrophoresis of neonatal intestinal microbiota in relation to the development of asthma. BMC Microbiol. 2011;11:68. doi: 10.1186/1471-2180-11-68. [DOI] [PMC free article] [PubMed] [Google Scholar]
- 6.Romagnani S. Regulatory T cells: which role in the pathogenesis and treatment of allergic disorders? Allergy. 2006;61:3–14. doi: 10.1111/j.1398-9995.2006.01005.x. [DOI] [PubMed] [Google Scholar]
- 7.Noverr Noverr MC, Noggle RM, Toews GB, Huffnagle GB. Role of antibiotics and fungal microbiota in driving Pulmonary allergic responses. Infect Immun. 2004;72:4996–5003. doi: 10.1128/IAI.72.9.4996-5003.2004. [DOI] [PMC free article] [PubMed] [Google Scholar]
- 8.Food and Agriculture Organization/World Health Organization (FAO/WHO) Joint FAO/WHO working group guidelines for the evaluation of probiotics in food. London, ON, Canada: FAO/WHO; 2002. [Google Scholar]
- 9.Ngoc PL, Gold DR, Tzianabos AO, Weiss ST, Celedón JC. Cytokines allergy and asthma. Curr Opin Allergy Clin Immunol. 2005;5:161–166. doi: 10.1097/01.all.0000162309.97480.45. [DOI] [PubMed] [Google Scholar]
- 10.Packard KA, Khan MM. Effects of histamine on Th1/Th2 cytokine balance. Int Immunopharmacol. 2003;3:909–920. doi: 10.1016/S1567-5769(02)00235-7. [DOI] [PubMed] [Google Scholar]
- 11.Langier S, Sade K, Kivity S. Regulatory T cells in allergic asthma. Chest. 2012;14:180–183. [PubMed] [Google Scholar]
- 12.Lloyd CM, Hawrylowicz CM. Regulatory T cells in asthma. Immunity. 2009;31:438–449. doi: 10.1016/j.immuni.2009.08.007. [DOI] [PMC free article] [PubMed] [Google Scholar]
- 13.McGee HS, Agrawal DK. Naturally occurring and inducible T-regulatory cells modulating immune response in allergic asthma. Am J Respir Crit Care Med. 2009;180:211–225. doi: 10.1164/rccm.200809-1505OC. [DOI] [PMC free article] [PubMed] [Google Scholar]
- 14.McGuirk P, Higgins SC, Mills KH. The role of regulatory T cells in respiratory infections and allergy and asthma. Curr Allergy Asthma Rep. 2010;10:21–28. doi: 10.1007/s11882-009-0078-2. [DOI] [PubMed] [Google Scholar]
- 15.Rudensky AY. Regulatory T cells and FOXP3. Immunol Rev. 2011;241:260–268. doi: 10.1111/j.1600-065X.2011.01018.x. [DOI] [PMC free article] [PubMed] [Google Scholar]
- 16.Kleczynska W, Jakiela B, Plutecka H, Milewski M, Sanak M, Musial J. Imbalance between Th17 and regulatory T-cells in systemic lupus erythematosus. Folia Histochem Cytobiol. 2011;49:646–653. doi: 10.5603/fhc.2011.0088. [DOI] [PubMed] [Google Scholar]
- 17.Abdulamir AS, Ladhim HS, Hafidh RR, Ali MA, Faik I, Abubakar F, Abbas KA. Severity of asthma: The role of CD25+, CD30+, NF-kappaB and apoptotic markers. J Investig Allergol Clin Immunol. 2009;19:218–224. [PubMed] [Google Scholar]
- 18.Lin YL, Shieh CC, Wang JY. The functional insufficiency of human CD4+ CD25 high T-regulatory cells in allergic asthma is subjected to TNF-alpha modulation. Allergy. 2008;63:67–74. doi: 10.1111/j.1398-9995.2007.01526.x. [DOI] [PubMed] [Google Scholar]
- 19.Wang Wei, Li Fang, Duan Guoqi, Duan GQ. The change of regulatory T lymphocyte level in bronchial asthma children, who are allergic to Dermatophagoides pteronyssinus and the clinical significance. Journal of Practical Clinical Pediatrics. 2012;27:1255–1257. [Google Scholar]


