

Abstract
Aims: The present study is to investigate the effect of the combination of small-interfering RNA (siRNA) treatment with bis-chloroethylnitrosourea (BCNU) on the proliferation and apoptosis of glioma cells. Methods: According to different treatments, glioma U251 cells were randomly divided into blank group, Lipofectamine group, siRNA-Gli1 group, BCNU group and combination group. After treatments, the morphology of U251 cells was visualized under the microscope. Afterwards, semi-quantitative real-time polymerase chain reaction and Western blotting were used to determine Gli1, Bcl-2, Bax and cyclin D1 mRNA levels and protein expression, respectively. MTT assay was used detect the proliferation of U251 cells, while flow cytometry was performed to determine cell apoptosis and cell cycle. Results: The combination of siRNA-Gli1 and BCNU caused more severe damages to U251 cell shapes compared with siRNA-Gli1 or BCNU alone. The combination of BCNU and siRNA-Gli1 altered mRNA level and protein expression of Bcl-2 and Bax, but not those of Gli1 and cyclin D1. The combination of siRNA-Gli1 and BCNU promoted U251 cell apoptosis. The combination of siRNA-Gli1 and BCNU enhanced the arrestment of U251 cells in G0/G1 phase. The combination of siRNA-Gli1 and BCNU significantly inhibited U251 cell proliferation. Conclusions: The present study demonstrates that combined treatment with siRNA-Gli1 and BCNU significantly inhibits the proliferation and promotes the apoptosis of glioma U251 cells, possibly by the up-regulation of Bax and the down-regulation of Bcl-2. The combination of siRNA-Gli1 and BCNU enhances the inhibition of cell cycles, but does not down-regulate the expression of cell cycle protein cyclin D1.
Keywords: Gliomas, Hedgehog signaling pathway, Gli family zinc finger 1 gene, RNA interference, bis-chloroethylnitrosourea
Introduction
Heterogeneity and chemotherapy drug resistance of gliomas are the main reasons for the failure of chemotherapy in the adjuvant therapy of gliomas [1-5]. Researches show that Hedgehog signaling pathway participates in the regulation of tumor cell proliferation and apoptosis, and is closely related to tumor invasion, metastasis and sensitivity to chemoradiotherapy [1-15]. Abnormal Hedgehog signaling pathway inhibits intracellular accumulation of chemotherapy drugs, and reduces their toxicity to cells [6,9,11]. In addition, the self-renewal and differentiation of cancer stem cells are dependent on the abnormal activation of Hedgehog signaling pathway [5,12,15]. Of note, GLI family zinc finger 1 (Gli1) is an important transcription factor in Hedgehog signaling pathway that attracts a lot of concerns on its relationship to chemotherapy [16,17].
Small molecule-targeted therapy of RNA interference (RNAi) by small-interfering RNA (siRNA) has shown its advantages among various gene therapies for cancer. Researchers tend to combine the use of various targeted drugs on multiple signaling pathways or multiple targets on the same signaling pathway, or combine the targeted drugs with conventional cytotoxic drugs [16-20]. Gong et al. [16] used RNAi to interfere the expression of Gli1 in ovarian cancer cells, indicating that the sensitivity of the cells to cisplatin was increased. Other researchers show that the combination of cisplatin with mitoxantrone affects the proliferation of glioma U87 cells by increasing the inhibition of Gli1 [17]. However, there has been no report on the effect of the combination of RNAi and chemotherapy drugs on the proliferation of glioma cells by now. In the present study, we investigate the effect of the combination of siRNA with BCNU on the proliferation and apoptosis of glioma cells.
Materials and methods
Cell line and treatments
Glioma U251 cells were cultured in RPMI-1640 medium supplemented with 10% fetal bovine serum, 1×10⁵ U/L penicillin and 100 mg/L streptomycin (Invitrogen, Thermo Scientific, Waltham, MA, USA) under 37°C and 5% CO2 (Model BB5060, Heraeus, Hanau, Germany). The growth status of the cells was monitored under an inverted phase contrast microscope (CKX41, Olympus, Tokyo, Japan). The cells were passaged every 2 or 3 days and log-phase cells were used for experiments. According to different treatments, the cells were randomly divided into five groups. Blank group was incubated with medium for 24 h; Lipofectamine group was incubated with Lipofectamine 2000 (Invitrogen, Thermo Scientific, Waltham, MA, USA) for 24 h; siRNA-Gli1 group was transfected with 0.05 nmol/μL siRNA-Gli1 (GenePharma Co., Ltd., Shanghai, China) and incubated for 48 h before experimentation; BCNU group was incubated with 1.5 μg/ml BCNU (Shanghai Yiming Chemicals, Shanghai, China) for 24 h; and combination group was transfected with 0.05 nmol/μl siRNA-Gli1, followed by incubation with normal medium for 24 h and subsequent incubation with 1.5 μg/ml BCNU for 24 h.
One day before transfection with siRNA-Gli1, the cells (3-5×10⁵) were seeded into 6-well plates. When the cells reached 30-50% confluency, the medium was replaced with 1.5 ml fresh medium containing no serum or antibiotics. Then, siRNAs were transfected into the cells using Lipofectamine (Invitrogen, Thermo Fisher Scientific, Waltham, MA, USA) according to the manufacturer’s manual. After incubation for 5 h, the medium was replaced with fresh normal medium.
Semi-quantitative real-time polymerase chain reaction (semi-qRT-PCR)
Total RNA was extracted using Trizol reagent (Invitrogen, Thermo Scientific, Waltham, MA, USA). Thermal cycling amplification was performed using SuperScript III One-Step RT-PCR kit (12574-018, Invitrogen, Thermo Scientific, Waltham, MA, USA) on PCR thermo cycler (C1000, Bio-Rad, Hercules, CA, USA). The 20 μl reaction system was formed by cDNA (5 μl), 10× buffer (2 μl), 25 mmol/L MgCl2 (0.8 μl), 2.5 mmol/L dNTP (2 μl), DNA polymerase (0.2 μl; Takara, Tokyo, Japan), and upstream and downstream primers (1 μl each). The sequences of primers were as follows: for Gli1 (355 bp), 5’-TTCCTACCAGAGTCCCAAGT-3’ and 5’-CCAGCCCCAGCGTCAAAGGTG-3’; for Bcl-2 (172 bp), 5’-GCATACTGAGACCCTG-3’ and 5’-ACTCTGTGAATCCCGTTT-3’; for cyclinD 1 (201 bp), 5’-AACACGGCTCACGCTTAC-3’ and 5’-CCAGACCCTCAGACGTGC-3’; for Bax (233 bp), 5’-GTGGCAGACCGTGACCAT-3’ and 5’-TGTCCCGAAGGAGGTTTAT-3’; for β-actin (298 bp), 5’-CGCGGGCTCTCCAGAACATCAT-3’ and 5’-CCAGCCCCAGCGTCAAAGGTG-3’. Primers were all synthesized by Sangon Biotech (Shanghai) Co., Ltd., Shanghai, China. PCR amplification conditions for Gli1, Bcl-2, cyclin D1, and Bax were as follows: initial denaturation at 95°C for 5 min; 35 cycles of denaturation at 56°C for 30 sec, annealing at 60°C for 60 sec, and elongation at 72°C for 60 sec; and final elongation at 72°C for 7 min. PCR amplification conditions for β-actin were: initial denaturation at 95°C for 5 min; 35 cycles of denaturation at 95°C for 30 sec, annealing at 59°C for 30 sec, and elongation at 72°C for 90 sec; and final elongation at 72°C for 7 min. After amplification, the PCR products were loaded to 2% (W/V) agarose gel (1× TBE buffer) containing 0.5 μg/ml bromoethane for electrophoresis, followed by imaging with ultraviolet projection reflectometer (ChemiDoc MP, Bio-Rad, Hercules, CA, USA).
Western blotting
After treatments, the cells were harvested for total protein extraction and concentration determination using Bradford method. Protein samples were mixed with 2× sodium dodecyl sulfate loading buffer and boiled for 5 min for denaturation. A total of 60 μg protein was resolved on 12% SDS-PAGE gel electrophoresis and electrotransferred to nitrocellulose membranes (Sigma-Aldrich, St. Louis, MO, USA) under 30V at 4°C. After blocking at 4°C and washing with Tris-buffered saline with Tween-20 for 30 min, the membrane was incubated with polyclonal rabbit anti-human antibodies (1:400), or rabbit anti-GAPDH (1:500; Boster, Wuhan, China) at 4°C for 8 h. After washing with Tris-buffered saline with Tween-20 for 30 min, the membrane was incubated with horseradish peroxidase-labeled goat anti-rabbit IgG antibody (1:5,000; Boster, Wuhan, China) for 4 h at room temperature. After washing with Tris-buffered saline with Tween-20 for 30 min, the bands were visualized by enhanced chemiluminescence (ECL, Santa Cruz, CA, USA). The level of target protein expression in each sample was determined by normalizing protein band intensity to GAPDH band intensity. The tests were performed in triplicate.
Flow cytometry
After treatments, the cells were trypsinized before centrifugation at 500× g for 5 minutes, followed by washing with phosphate-buffered saline (PBS) twice. Then, single cell suspension was prepared using 0.9 ml PBS, followed by addition of 2.1 ml pure ethanol. The cells were left standing at 4°C overnight. After centrifugation at 500× g for 5 minutes, the cells were washed with PBS twice. Then, the cells were incubated with 30 μl Annexin-V-FITC (Sigma-Aldrich, St. Louis, MO, USA) under room temperature for 15 minutes. Flow cytometry (FC500, Beckman Coulter, Brea, CA, USA) was performed to determine apoptotic rate and cell cycles. The percentage of cells in G0, G1 and S phases was calculated. The tests were performed in triplicate.
MTT assay
After treatments, log-phase cells were seeded onto 96-well plates (1×10³-10×103 cells per well) and cultured at 37°C in 2.5% CO2. At 12, 24, 48 and 72 h after transfection, 20 μL MTT (5 mg/ml) was added, followed by additional incubation at 37°C for 4 h before discarding supernatants. Then, 150 μL DMSO was added to each well before shaking gently for 10 minutes to dissolve crystals. The absorbance of each well was measured at 570 nm using microplate reader (AD340, Beckman Coulter, Brea, CA, USA). Survival rate of tumor cells = absorbance of treatment wells/absorbance of control well ×100%. The inhibitory rate of tumor cells = 1-survival rate of tumor cells. The tests were performed in triplicate.
Statistical analysis
The results were analyzed using SPSS 16.0 software (IBM, Armonk, NY, USA). The data were given in means ± standard deviation. Differences between blank and Lipofectamine groups were compared using Student’s t-test. The effects of the combination of BCNU and siRNA-Gli1 were analyzed using 2×2 factorial design analysis of variance. P value less than 0.05 was considered statistically significant.
Results
The combination of siRNA-Gli1 and BCNU causes more severe damages to U251 cell shapes compared with siRNA-Gli1 or BCNU alone
To monitor the growth status of the cells, light microscopy was used. The images showed that U251 cells in blank and Lipofectamine groups had adherent growth, polygonal shapes, even distribution, and good refraction of light. By contrast, cells in siRNA-Gli1 group began to die at 24 h, and had significantly increased portion of dead cells at 48 h. Of note, cells in BCNU and combination groups began to die at 10 h and 7 h, respectively. In addition, the number of dead cells in combination group at 24 h was greater than that in BCNU at 24 h or that in siRNA-Gli1 at 48 h (Figure 1). These results suggest that the combination of siRNA-Gli1 and BCNU causes the most severe damages to U251 cell shapes.
Figure 1.

U251 cell shapes in blank, Lipofectamine, siRNA-Gli1, BCNU and combination groups. Blank group was incubated with medium for 24 h; Lipofectamine group was incubated with Lipofectamine 2000 (Invitrogen, Thermo Scientific, Waltham, MA, USA) for 24 h; siRNA-Gli1 group was transfected with 0.05 nmol/μL siRNA-Gli1 (GenePharma Co., Ltd., Shanghai, China) and incubated for 48 h before experimentation; BCNU group was incubated with 1.5 μg/ml BCNU (Shanghai Yiming Chemicals, Shanghai, China) for 24 h; and combination group was transfected with 0.05 nmol/μl siRNA-Gli1, followed by incubation with normal medium for 24 h and subsequent incubation with 1.5 μg/ml BCNU for 24 h. The growth status of the cells was monitored under an inverted phase contrast microscope (CX21, Olympus, Tokyo, Japan). The microscopic images were obtained at 24 h after BCNU treatment or 48 h after transfection. The magnification was 100×.
The combination of BCNU and siRNA-Gli1 alters mRNA level and protein expression of Bcl-2 and Bax, but not those of Gli1 and cyclin D1
To measure mRNA levels and protein expression of Gli1, cyclin D1, Bcl-2 and Bax in U251 cells, semi-qRT-PCR and Western blotting were performed, respectively. The data showed that mRNA levels and protein expression of Gli1, cyclin D1, Bcl-2 and Bax were not significantly different between blank and Lipofectamine groups (P > 0.05). Cross correlation analysis of siRNA-Gli1 and BCNU showed that they did not have statistically significant effect on Gli1 mRNA level and protein expression (F = 1.72 and 2.92, and P = 0.14 and 0.08, respectively). Similarly, siRNA-Gli1 and BCNU had no statistically significant effect on cyclin D1 mRNA level and protein expression (F = 0.69 and 1.38, and P = 0.28 and 0.47, respectively). By contrast, the combination of BCNU and siRNA-Gli1 significantly reduced Bcl-2 mRNA level and protein expression (F = 6.88 and 9.33, and P = 0.02 and 0.00, respectively), and significantly enhanced Bax mRNA level and protein expression (F = 5.87 and 6.01, and P = 0.03 and 0.03, respectively) (Figures 2 and 3; Tables 1 and 2). The results indicate that the combination of BCNU and siRNA-Gli1 alters mRNA level and protein expression of Bcl-2 and Bax, but not those of Gli1 and cyclin D1.
Figure 2.

Gli1, cyclin D1, Bcl-2 and Bax mRNA levels in blank, Lipofectamine, siRNA-Gli1, BCNU and combination groups. Semi-quantitative real-time polymerase chain reaction was performed using SuperScript III One-Step RT-PCR kit (12574-018, Invitrogen, Thermo Scientific, Waltham, MA, USA) on PCR thermo cycler (C1000, Bio-Rad, Hercules, CA, USA). The 20 μl reaction system was formed by cDNA (5 μl), 10× buffer (2 μl), 25 mmol/L MgCl2 (0.8 μl), 2.5 mmol/L dNTP (2 μl), DNA polymerase (0.2 μl; Takara, Tokyo, Japan), and upstream and downstream primers (1 μl each). M, markers; 1, blank group; 2, Lipofectamine group; 3, BCNU group; 4, siRNA-Gli1 group; 5, combination group.
Figure 3.
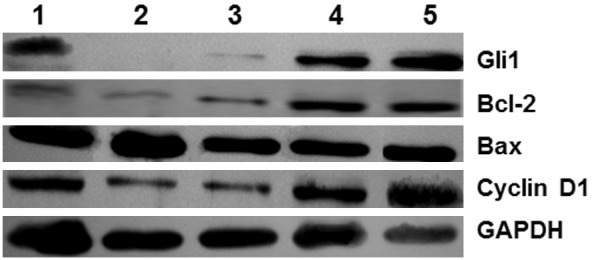
Gli1, Bcl-2, Bax and cyclin D1 protein expression in blank, Lipofectamine, siRNA-Gli1, BCNU and combination groups. Western blotting analysis was performed using polyclonal rabbit anti-human antibodies (1:400), or rabbit anti-GAPDH (1:500; Boster, Wuhan, China) and horseradish peroxidase-labeled goat anti-rabbit IgG antibody (1:5,000; Boster, Wuhan, China). The bands were visualized by enhanced chemiluminescence (ECL, Santa Cruz, CA, USA). The level of target protein expression in each sample was determined by normalizing protein band intensity to GAPDH band intensity. 1, BCNU group; 2, combination group; 3, siRNA-Gli1 group; 4, Lipofectamine group; 5, blank group.
Table 1.
Gli1, Bcl-2, Bax and Cyclin D1 mRNA levels in each group (means ± standard deviation)
| Groups | Gli1 | Bcl-2 | Bax | Cyclin D1 |
|---|---|---|---|---|
| Lipofectamine | 98.60 ± 0.06 | 99.48 ± 0.32 | 94.29 ± 0.13 | 95.87 ± 0.44 |
| Blank | 95.93 ± 0.21 | 97.42 ± 0.17 | 96.30 ± 0.54 | 92.53 ± 0.08 |
| t | 2.02 | 0.82 | 0.23 | 1.08 |
| P | 0.15 | 0.44 | 0.90 | 0.39 |
| siRNA-Gli1 | 40.35 ± 0.17 | 57.92 ± 0.10 | 101.90 ± 0.55 | 48.11 ± 0.41 |
| BCNU | 93.30 ± 0.43 | 73.41 ± 0.27 | 120.70 ± 0.29 | 97.55 ± 0.16 |
| Combination | 45.20 ± 0.23 | 33.23 ± 0.19 | 132.83 ± 0.75 | 51.95 ± 0.90 |
| F | 1.72 | 6.88 | 5.87 | 0.69 |
| P | 0.14 | 0.02 | 0.03 | 0.28 |
Table 2.
Gli1, Bcl-2, Bax and Cyclin D1 protein expression in each group (means ± standard deviation)
| Groups | Gli1 | Bcl-2 | Bax | Cyclin D1 |
|---|---|---|---|---|
| Lipofectamine | 98.24 ± 0.04 | 99.44 ± 0.15 | 97.29 ± 0.04 | 93.40 ± 0.48 |
| Blank | 93.39 ± 0.01 | 98.30 ± 0.13 | 95.34 ± 0.03 | 97.20 ± 0.26 |
| t | 0.79 | 0.90 | 1.33 | 2.27 |
| P | 0.47 | 0.41 | 0.25 | 0.11 |
| siRNA-Gli1 | 51.70 ± 0.27 | 54.60 ± 2.33 | 108.65 ± 1.70 | 33.03 ± 3.60 |
| BCNU | 91.08 ± 0.06 | 64.70 ± 0.78 | 105.23 ± 1.70 | 98.06 ± 0.52 |
| Combination | 48.70 ± 0.05 | 26.40 ± 1.07 | 117.10 ± 3.40 | 39.24 ± 2.80 |
| F | 2.92 | 9.33 | 6.01 | 1.38 |
| P | 0.08 | 0.00 | 0.03 | 0.47 |
The combination of siRNA-Gli1 and BCNU promotes U251 cell apoptosis
To examine the effect of the combination of siRNA-Gli1 and BCNU on the apoptosis of U251 cells, flow cytometry was performed. The data showed that apoptotic rate in Lipofectamine group was not significantly different from that in blank group after treatment for 48 h (P > 0.05). In addition, siRNA-Gli1 or BCNU alone significantly enhanced the apoptosis of U251 cells (P = 0.01 and 0.03, respectively). Furthermore, cross correlation analysis of siRNA-Gli1 and BCNU showed that the combination of the two significantly increased the apoptotic rate of U251 cells (P = 0.00) (Table 3). These results suggest that the combination of siRNA-Gli1 and BCNU promotes U251 cell apoptosis.
Table 3.
Cell apoptotic rate in each group (means ± standard deviation)
| Groups | Apoptotic rate (%) | F/t | P |
|---|---|---|---|
| Lipofectamine | 0.53 ± 0.82 | 1.02* | 0.39 |
| Blank | 0.76 ± 0.07 | ||
| siRNA-Gli1 | 22.32 ± 0.39 | 7.45** | 0.01 |
| BCNU | 12.87 ± 0.57 | 6.30*** | 0.03 |
| Combination | 31.76 ± 1.55 | 33.23Δ | 0.00 |
comparison between Lipofectamine and blank groups;
comparison between siRNA-Gli1 and Lipofectamine groups;
comparison between BCNU and blank groups;
cross correlation comparison among siRNA-Gli1, BCNU and the combination of both.
The combination of siRNA-Gli1 and BCNU enhances the arrestment of U251 cells in G0/G1 phase
To determine cell cycles, flow cytometry was employed. The ratios of cells in G0/G1 phase or S phase were not significantly different between blank and Lipofectamine groups (P > 0.05). In addition, the ratio of cells in G0/G1 phase was increased but the ratio of cells in S phase was decreased in siRNA-Gli1 or BCNU group (P < 0.05). Moreover, cross correlation analysis of siRNA-Gli1 and BCNU showed that the combination of the two significantly increased the ratio of cells in G0/G1 phase and significantly decreased the ratio of cells in S phase (P = 0.000 and 0.02, respectively) (Table 4). The results indicate that the combination of siRNA-Gli1 and BCNU enhances the arrestment of U251 cells in G0/G1 phase.
Table 4.
Cell cycle ratios in each group (means ± standard deviation)
| Groups | G0/G1 phase | S phase | ||||
|---|---|---|---|---|---|---|
|
| ||||||
| Ratio (%) | F/t | P | Ratio (%) | F/t | P | |
| Lipofectamine | 52.39 ± 0.38 | 1.61* | 0.20 | 38.46 ± 1.02 | 0.63* | 0.55 |
| Blank | 49. 90 ± 0.80 | 40.06 ± 1.43 | ||||
| siRNA-Gli1 | 61.05 ± 0.22 | 6.53** | 0.03 | 31.09 ± 0.28 | 5.45** | 0.04 |
| BCNU | 68.34 ± 0.59 | 7.39*** | 0.01 | 26.72 ± 1.64 | 9.09*** | 0.00 |
| Combination | 86.45 ± 2.78 | 9.98Δ | 0.00 | 11.09 ± 0.54 | 6.18Δ | 0.02 |
comparison between Lipofectamine and blank groups;
comparison between siRNA-Gli1 and Lipofectamine groups;
comparison between BCNU and blank groups;
cross correlation comparison among siRNA-Gli1, BCNU and the combination of both.
The combination of siRNA-Gli1 and BCNU significantly inhibits U251 cell proliferation
To test the proliferation of U251 cells, we performed MTT assay. The data showed that the absorbance values for blank and Lipofectamine groups were dramatically increased at 24 h, 48 h, or 72 h, while those for siRNA-Gli1, BCNU and combination groups were slightly increased with time (Figure 4). In addition, proliferation inhibitory rates in blank and Lipofectamine groups were not significantly different from each other at 24 h, 48 h, or 72 h (P > 0.05). By contrast, the combination of siRNA-Gli1 and BCNU had significantly hither proliferation inhibitory rates at 24 h, 48 h, or 72 h (P = 0.04, 0.01 and 0.00, respectively). Of note, the proliferation inhibitory rates for siRNA-Gli1, BCNU and combination groups were increasing with time (Table 5). These results suggest that the combination of siRNA-Gli1 and BCNU significantly inhibits U251 cell proliferation.
Figure 4.

U251 cell proliferation in blank, Lipofectamine, siRNA-Gli1, BCNU and combination groups. For MTT assay, 20 μL MTT (5 mg/ml) was added, followed by additional incubation at 37°C for 4 h before discarding supernatants. Then, 150 μL DMSO was added to each well before shaking gently for 10 minutes to dissolve crystals. The absorbance of each well was measured at 570 nm using microplate reader (AD340, Beckman Coulter, Brea, CA, USA). Survival rate of tumor cells = absorbance of treatment wells/absorbance of control well ×100%. The inhibitory rate of tumor cells = 1-survival rate of tumor cells.
Table 5.
Cell proliferation inhibitory rates (%) in each group (means ± standard deviation)
| Groups | 24 h | 48 h | 72 h |
|---|---|---|---|
| Lipofectamine | 1.18 ± 0.01 | 1.15 ± 0.03 | 2.25 ± 0.04 |
| Blank | 0.00 ± 0.00 | 0.00 ± 0.00 | 0.00 ± 0.00 |
| t | 2.53 | 0.90 | 1.59 |
| P | 0.09 | 0.42 | 0.21 |
| siRNA-Gli1 | 24.91 ± 0.01 | 43.07 ± 0.03 | 59.25 ± 0.12 |
| BCNU | 20.83 ± 0.02 | 40.75 ± 0.09 | 45.30 ± 0.05 |
| Combination | 37.51 ± 0.17 | 58.97 ± 0.27 | 66.94 ± 0.30 |
| F | 6.69 | 7.23 | 10.87 |
| P | 0.04 | 0.01 | 0.00 |
Discussion
Glioma is a type of tumor with strong heterogeneity. Gliomas of the same pathological classification or cells from the same piece of glioma tissue can be of significant differences. As a result, gliomas exhibit different molecular pathological characteristics. The heterogeneity of gliomas is also exhibited by their variable sensitivities to chemotherapy drugs [1,2,12-14,18,19,21,22]. Most drugs were administered by venous infusion, leading to inconsistent pharmacokinetic and cytokinetic characteristics. This may result in chemotherapy escape of quiescent cells, finally resulting in resistance to chemotherapy drugs [12,14,19,20]. The cells that escape from chemotherapy have the capability of differentiation and self-renewal, which is essential for chemotherapy drug resistance of gliomas [2,12,19-21,23-28]. Therefore, the efficacy of conventional nitrosourea drugs such as BCNU is no greater than 20% [19-21,27].
More and more studies show that gliomas can generate chemotherapy drug resistance by themselves [3,12,20,27,29]. The mechanisms of chemotherapy drug resistance of gliomas include: i) binding failure between drug and chemotherapy target caused by changes in chemotherapy drug targeting doses and mutations in target sites; ii) abnormal expression of chemotherapy resistance gene and molecular markers [18,27]; iii) chemotherapy drug decomposition and excretion enhancement caused by abnormal mechanisms of drug metabolism [2,3,14]; iv) differences in glioma phenotype that affect the efficacy of chemotherapy [20,23-25,27,29,30].
Therefore, the combination of multiple treatment methods may be a breakthrough for the treatment of gliomas, including the combined use of chemical drugs and molecularly targeted therapy. Previous researches show that Gli1 may be a molecular target for the treatment of gliomas. In addition, Gli1 regulates apoptosis-related factors Bcl-2 and Bax, as well as the cell cycle factor cyclin D1. Of note, Bcl-2 and cyclin D1 are the key points in the signaling pathways of some tumors, and the effectors of some chemotherapy drugs [2,13,31,32].
The combination of targeted drugs and conventional chemotherapy is also a hot area in the future treatment of gliomas [16,33,34]. Cioca et al. report that RNAi against c-raf and Bcl-2 induces apoptosis of leukemia cells, and increases the sensitivity of the cells to chemotherapy drugs etoposide and daunorubicin. In the present study, siRNA-Gli1 that targets Gli1 is proven to inhibit the proliferation and promote the apoptosis of U251 cells. In addition, the combination of siRNA-Gli1 and BCNU leads to more dead cells than siRNA-Gli1 or BCNU according to observation under a light microscope. Cell proliferation curves show that the combination of siRNA-Gli1 and BCNU has higher proliferation inhibitory rate than siRNA-Gli1 or BCNU alone (P < 0.05). As an alkylating agent, BCNU exhibits its cytotoxicity by damaging DNA synthesis or inhibiting DNA polymerase activity, leading to abnormal DNA structure and function that induce the release of cytochrome C. The released cytochrome C activates capsase cascade reactions that finally result in apoptosis [12,31]. Bax, a Bcl family member that promotes apoptosis, can insert into the membrane structure of mitochondria, forming relatively large passageways that allow cytochrome C to pass through to enter cytoplasm. However, apoptosis-inhibiting factors Bcl-2 and Bcl-XL can compete with Bax to bind mitochondrial permeability transition pore (mtPTP) to inhibit apoptosis [35-37]. Therefore, the regulation of apoptosis is dependent on the expression levels and ratio of Bcl-2 and Bax. The present study shows that the combination of siRNA-Gli1 and BCNU inhibits the proliferation of U251 cells and promotes U251 cell apoptosis (P < 0.05). We interpret these data to suggest that RNA interference with Gli1 transcription down-regulates the expression of Bcl-2 and up-regulates the expression of Bax, leading to enhanced release of cytochrome C that results in caspase cascade reactions and then promoted apoptosis. Studies indicate that overexpression of Bcl-2 endows cells with longer survival periods, during which the chances for gene mutations are dramatically increased, generating conditions suitable for the occurrence of tumors [38,39]. These observations suggest that siRNA-Gli1 might inhibit the self-repair of tumor cells after DNA damage by BCNU, and thus promote the damaging effect of BCNU on DNA, as well as tumor cells.
In physiological conditions, the activity of Hedgehog signaling pathway is inhibited, Gli1 is hydrolyzed by phosphorylation, and down-stream cyclin D1 and c-Myc show low transcription levels [12]. During the occurrence of cancer, Hedgehog pathway is abnormally activated, and positive and negative feedbacks are out of order, leading to the binding of Gli1 with its down-stream gene promoter region that causes abnormal transcription and expression, and maintains the activated status of tumor cell proliferation [6,7,35-37,40-46]. Researches on tumor cell cycles suggest that disordered cell cycle leads to abnormal cell proliferation and tumorigenesis [35-37,44-46]. More studies show that cyclin D1 can lead to a series of target gene transcriptions related to S phase, shortening G1 phase and bringing S phase forward. These will result in abnormal initiation, progression and termination of cell cycles that promote cell proliferation and inhibit cell apoptosis, finally leading to cancer [2-5]. Consistent with previous reports [15,28,47], the present study demonstrates that BCNU inhibits the entrance of U251 cells into S phase. After BCNU treatment, the ratio of cells in G0/G1 phase was significantly increased (P < 0.05), while that in S phase was significantly reduced (P < 0.05). In addition, the combination of siRNA-Gli1 and BCNU showed even more significant inhibitory effect on U251 cell cycles (P < 0.05). Our study also shows that siRNA-Gli1 down-regulates cyclin D1 expression by interfering with Gli1 transcription, and arrests the cells in G0/G1 phase. However, there has been no evidence on the inhibition of cyclin D1 expression by BCNU, or proof for the down-regulation of cyclin D1 expression by siRNA-Gli1 assisted by BCNU. These facts suggest that BCNU may interfere with cell cycles by regulating cell cycle factors other than cyclin D1.
Multidrug resistance (MDR) is one of the most important defense mechanisms against chemotherapy drugs in tumor cells. MDR is the result of the overexpression of MDR-1 gene that is located on human chromosome 7. The overexpression of MDR-1 gene in malignant tumors is related to the degree of malignancy of the tumor. For example, Linassier et al. report that resistance to nitrosourea and podophyllotoxin derivatives is highly consistent with MDR-1 expression [34,48]. Most researchers believe that abnormally high expression of MDR-1 exists in gliomas [34,48], and RNAi technique provides beneficial ways for the treatment of gliomas by reversing MDR [43]. Zhao et al. inhibited the expression of MDR-1 gene in glioma BT325 cells and found that the sensitivity of the cells to chemotherapy drugs adriamycin and vincristine was enhanced.
Base excision repair pathway is another important pathway for drug resistance of alkylating agents, and its mechanism is related to the DNA products of automatic repair of O6-alkylguanine-DNA alkyltransference (O6-AGT) in tumor cells. BCNU can kill tumor cells, but tumor cells can reverse the damages of DNA caused by BCNU via O6-AGT, eliminating the sensitivity of proliferated cells to chemotherapy drugs such as BCNU [20,27,48-50]. Consistent with these observations, our study also suggests that siRNA-Gli1 possibly inhibits the self-repair of tumor cells against DNA damages caused by BCNU.
As one of the most important methyltransferases that repairs DNA damages, O6-methylguanine-DNA methyltransferase (MGMT) directly participates in the repair of O6-methylguanine (O6-mG) damages in DNA sequence. The promoter of MGMT contains abundant guanines and cytosines at 5’-untranslated region and the first exon region, which is called CpG islands (CGIs). In the genomes of healthy people, the CpG sites within CGIs are usually unmethylated, but those outside CGIs are usually methylated [51-53]. In normal cells, the CGIs in the promoter region of tumor suppressor genes are in little or no methylation status, and tumor suppressor genes are open and continuously expressed to inhibit tumor occurrence. By contrast, the CGIs in this region in tumor cells are highly methylated and tumor suppressor gene expression is turned off, finally leading to tumorigenesis. Researches show that MGMT expression status is mainly dependent on the methylation of promoters, and is closely related to the occurrence, development, proliferation, and chemotherapy resistance of tumors [13,51,53-55]. Hypermethylation of promoter CGIs alters the spatial configuration of MGMT, affects its capacity of binding to transcription factors, and inhibits the expression of MGMT [51,52]. If abnormal structure and function of MGMT occur, GC and AT pairs may be wrongly matched, leading to the activation of oncogenes and deactivation of tumor suppressor genes [51-53]. Some researchers report that nuclear factor-kappa B (NF-κB) can be activated by MGMT. NF-κB can regulate multiple gene transcription factors that are related to inflammation, cell cycle, apoptosis, malignancy, and tissue proliferation [28,32,56]. Activated NF-κB stimulates the activation of Bcl-2. The formation of Bcl-2/NF-κB complex suppresses the occurrence of apoptosis by inhibiting the activation of caspase, preventing release of cytochrome C and antagonizing Bax [38,45,57-59]. It is a pity that we did not investigate the expression of MGMT and NF-κB, but it is still worth investigating the expression of MGMT after combined treatment with chemotherapy drugs and RNA interference on the expression of key factors in the future. In conclusion, the combined treatment with siRNA-Gli1 and BCNU significantly inhibits the proliferation and promotes the apoptosis of glioma U251 cells, possibly by the up-regulation of Bax and the down-regulation of Bcl-2. The mechanism by which the combination of siRNA-Gli1 and BCNU enhances the inhibition of cell cycles, but does not down-regulate the expression of cell cycle protein cyclin D1, still needs further investigations. The present study demonstrates that the combination of RNAi of Gli1 with BCNU is more effective in inhibiting the proliferation of glioma cells, providing a theoretical basis for the treatment of gliomas using the combination of molecularly targeted therapy and chemotherapy drugs.
Acknowledgements
This work was supported by the National Natural Science Foundation of China (No. 81360373).
Disclosure of conflict of interest
None.
References
- 1.Bartek J, Lukas J, Bartkova J. Perspective: defects in cell cycle control and cancer. J Pathol. 1999;187:95–99. doi: 10.1002/(SICI)1096-9896(199901)187:1<95::AID-PATH249>3.0.CO;2-#. [DOI] [PubMed] [Google Scholar]
- 2.Branzei D, Foiani M. Regulation of DNA repair throughout the cell cycle. Nat Rev Mol Cell Biol. 2008;9:297–308. doi: 10.1038/nrm2351. [DOI] [PubMed] [Google Scholar]
- 3.Kinzler KW, Bigner SH, Bigner DD, Trent JM, Law ML, O’Brien SJ, Wong AJ, Vogelstein B. Identification of an amplified, highly expressed gene in a human glioma. Science. 1987;236:70–73. doi: 10.1126/science.3563490. [DOI] [PubMed] [Google Scholar]
- 4.Rosenwald IB. The role of translation in neoplastic transformation from a pathologist’s point of view. Oncogene. 2004;23:3230–3247. doi: 10.1038/sj.onc.1207552. [DOI] [PubMed] [Google Scholar]
- 5.Al-Hajj M, Wicha MS, Benito-Hernandez A, Morrison SJ, Clarke MF. Prospective identification of tumorigenic breast cancer cells. Proc Natl Acad Sci U S A. 2003;100:3983–3988. doi: 10.1073/pnas.0530291100. [DOI] [PMC free article] [PubMed] [Google Scholar]
- 6.Watkins DN, Berman DM, Burkholder SG, Wang B, Beachy PA, Baylin SB. Hedgehog signalling within airway epithelial progenitors and in small-cell lung cancer. Nature. 2003;422:313–317. doi: 10.1038/nature01493. [DOI] [PubMed] [Google Scholar]
- 7.Thayer SP, di Magliano MP, Heiser PW, Nielsen CM, Roberts DJ, Lauwers GY, Qi YP, Gysin S, Fernandez-del Castillo C, Yajnik V, Antoniu B, McMahon M, Warshaw AL, Hebrok M. Hedgehog is an early and late mediator of pancreatic cancer tumorigenesis. Nature. 2003;425:851–856. doi: 10.1038/nature02009. [DOI] [PMC free article] [PubMed] [Google Scholar]
- 8.Burkhard C, Di Patre PL, Schuler D, Schuler G, Yasargil MG, Yonekawa Y, Lutolf UM, Kleihues P, Ohgaki H. A population-based study of the incidence and survival rates in patients with pilocytic astrocytoma. J Neurosurg. 2003;98:1170–1174. doi: 10.3171/jns.2003.98.6.1170. [DOI] [PubMed] [Google Scholar]
- 9.Sanchez P, Hernandez AM, Stecca B, Kahler AJ, DeGueme AM, Barrett A, Beyna M, Datta MW, Datta S, Ruiz i Altaba A. Inhibition of prostate cancer proliferation by interference with SONIC HEDGEHOG-GLI1 signaling. Proc Natl Acad Sci U S A. 2004;101:12561–12566. doi: 10.1073/pnas.0404956101. [DOI] [PMC free article] [PubMed] [Google Scholar]
- 10.Dahmane N, Lee J, Robins P, Heller P, Ruiz i Altaba A. Activation of the transcription factor Gli1 and the Sonic hedgehog signalling pathway in skin tumours. Nature. 1997;389:876–881. doi: 10.1038/39918. [DOI] [PubMed] [Google Scholar]
- 11.Teh MT, Wong ST, Neill GW, Ghali LR, Philpott MP, Quinn AG. FOXM1 is a downstream target of Gli1 in basal cell carcinomas. Cancer Res. 2002;62:4773–4780. [PubMed] [Google Scholar]
- 12.Yang Z, Huang X, WANG T, Wang J, Fan S. The effect of carmustine on human brain tumor stem cell proliferation and cell cycles. J Pract Med. 2008;24:2933–2936. [Google Scholar]
- 13.Numa Y, Tsukazaki Y, Yamamoto M, Matsudaira T, Kawamoto K. Cyclin protein expression on malignant glioma cells. Hum Cell. 1998;11:21–26. [PubMed] [Google Scholar]
- 14.Sun WG, Weydert CJ, Zhang Y, Yu L, Liu J, Spitz DR, Cullen JJ, Oberley LW. Superoxide Enhances the Antitumor Combination of AdMnSOD Plus BCNU in Breast Cancer. Cancers (Basel) 2010;2:68–87. doi: 10.3390/cancers2010068. [DOI] [PMC free article] [PubMed] [Google Scholar]
- 15.Jordan CT. Cancer stem cell biology: from leukemia to solid tumors. Curr Opin Cell Biol. 2004;16:708–712. doi: 10.1016/j.ceb.2004.09.002. [DOI] [PubMed] [Google Scholar]
- 16.Gong X, Song C, Liu S, Wang P. Experimental researches on targeted Gli1 gene that enhances ovarian cancer cell sensitivity to chemotherap. Chin J Surg Oncol. 2010;2:81–85. [Google Scholar]
- 17.Yin Y, Yang F, Jin X, Zhou H, Liu C. Regulation of Sonic Hedgehog signaling pathways in brain glioma U87 cells by the combination of cisplatin and mitoxantrone. Journal of Modern Oncology. 2011;19:1306–1308. [Google Scholar]
- 18.Beier D, Rohrl S, Pillai DR, Schwarz S, Kunz-Schughart LA, Leukel P, Proescholdt M, Brawanski A, Bogdahn U, Trampe-Kieslich A, Giebel B, Wischhusen J, Reifenberger G, Hau P, Beier CP. Temozolomide preferentially depletes cancer stem cells in glioblastoma. Cancer Res. 2008;68:5706–5715. doi: 10.1158/0008-5472.CAN-07-6878. [DOI] [PubMed] [Google Scholar]
- 19.Loebinger MR, Giangreco A, Groot KR, Prichard L, Allen K, Simpson C, Bazley L, Navani N, Tibrewal S, Davies D, Janes SM. Squamous cell cancers contain a side population of stem-like cells that are made chemosensitive by ABC transporter blockade. Br J Cancer. 2008;98:380–387. doi: 10.1038/sj.bjc.6604185. [DOI] [PMC free article] [PubMed] [Google Scholar]
- 20.Chen Z, Zhang J. New developments in chemotherapy for malignant cerebral tumors: molecularly targeted therapy. Chinese Journal of Neuro-Oncology. 2005;3:1–6. [Google Scholar]
- 21.Yu SC, Ping YF, Yi L, Zhou ZH, Chen JH, Yao XH, Gao L, Wang JM, Bian XW. Isolation and characterization of cancer stem cells from a human glioblastoma cell line U87. Cancer Lett. 2008;265:124–134. doi: 10.1016/j.canlet.2008.02.010. [DOI] [PubMed] [Google Scholar]
- 22.Mantovani A. Cancer: Inflaming metastasis. Nature. 2009;457:36–37. doi: 10.1038/457036b. [DOI] [PubMed] [Google Scholar]
- 23.Ren H, Yang BF, Rainov NG. Receptor tyrosine kinases as therapeutic targets in malignant glioma. Rev Recent Clin Trials. 2007;2:87–101. doi: 10.2174/157488707780599384. [DOI] [PubMed] [Google Scholar]
- 24.Osborne RH, Houben MP, Tijssen CC, Coebergh JW, van Duijn CM. The genetic epidemiology of glioma. Neurology. 2001;57:1751–1755. doi: 10.1212/wnl.57.10.1751. [DOI] [PubMed] [Google Scholar]
- 25.Walter KA, Tamargo RJ, Olivi A, Burger PC, Brem H. Intratumoral chemotherapy. Neurosurgery. 1995;37:1128–1145. [PubMed] [Google Scholar]
- 26.Wang J, Wakeman TP, Lathia JD, Hjelmeland AB, Wang XF, White RR, Rich JN, Sullenger BA. Notch promotes radioresistance of glioma stem cells. Stem Cells. 2010;28:17–28. doi: 10.1002/stem.261. [DOI] [PMC free article] [PubMed] [Google Scholar]
- 27.Chen Z. The significance of chemotherapy of gliomas. Chinese Journal of Neuro-Oncology. 2003;1:65–68. [Google Scholar]
- 28.Shimizu S, Narita M, Tsujimoto Y. Bcl-2 family proteins regulate the release of apoptogenic cytochrome c by the mitochondrial channel VDAC. Nature. 1999;399:483–487. doi: 10.1038/20959. [DOI] [PubMed] [Google Scholar]
- 29.Jiao B. Gliomas: basic and clinical studies. Beijing: Scientific and Technical Documentation Press; 2006. [Google Scholar]
- 30.Wang Z. Neurosurgery. Wuhan: Hubei Science and Technology Press; 1998. [Google Scholar]
- 31.Chen Z, Gerard M. Effect of induced ERCC2 expression on BCNU tolerancein human brain glioma cells Chinese. Journal of Neurosurgery. 2003;19:18–21. [Google Scholar]
- 32.Lytle RA, Jiang Z, Zheng X, Rich KM. BCNU down-regulates anti-apoptotic proteins bcl-xL and Bcl-2 in association with cell death in oligodendroglioma-derived cells. J Neurooncol. 2004;68:233–241. doi: 10.1023/b:neon.0000033382.40601.5a. [DOI] [PubMed] [Google Scholar]
- 33.Cioca DP, Aoki Y, Kiyosawa K. RNA interference is a functional pathway with therapeutic potential in human myeloid leukemia cell lines. Cancer Gene Ther. 2003;10:125–133. doi: 10.1038/sj.cgt.7700544. [DOI] [PubMed] [Google Scholar]
- 34.Linassier C, Destrieux C, Benboubker L, Alcaraz L, Bergemer-Fouquet AM, Jan M, Calais G, Colombat P. Role of high-dose chemotherapy with hemopoietic stem-cell support in the treatment of adult patients with high-grade glioma. Bull Cancer. 2001;88:871–876. [PubMed] [Google Scholar]
- 35.Kenney AM, Rowitch DH. Sonic hedgehog promotes G (1) cyclin expression and sustained cell cycle progression in mammalian neuronal precursors. Mol Cell Biol. 2000;20:9055–9067. doi: 10.1128/mcb.20.23.9055-9067.2000. [DOI] [PMC free article] [PubMed] [Google Scholar]
- 36.Fleming AB, Saltzman WM. Pharmacokinetics of the carmustine implant. Clin Pharmacokinet. 2002;41:403–419. doi: 10.2165/00003088-200241060-00002. [DOI] [PubMed] [Google Scholar]
- 37.Kirkin V, Joos S, Zornig M. The role of Bcl-2 family members in tumorigenesis. Biochim Biophys Acta. 2004;1644:229–249. doi: 10.1016/j.bbamcr.2003.08.009. [DOI] [PubMed] [Google Scholar]
- 38.Jin J, Yuan H, Xiong J. The expression and significance of bag-1 and bcl-2 in large intestine adenoma and cancer. Cancer Research on Prevention and Treatment. 2005;32:284–286. [Google Scholar]
- 39.Stegh AH, Kim H, Bachoo RM, Forloney KL, Zhang J, Schulze H, Park K, Hannon GJ, Yuan J, Louis DN, DePinho RA, Chin L. Bcl2L12 inhibits post-mitochondrial apoptosis signaling in glioblastoma. Genes Dev. 2007;21:98–111. doi: 10.1101/gad.1480007. [DOI] [PMC free article] [PubMed] [Google Scholar]
- 40.Kim S, Dougherty ER, Shmulevich I, Hess KR, Hamilton SR, Trent JM, Fuller GN, Zhang W. Identification of combination gene sets for glioma classification. Mol Cancer Ther. 2002;1:1229–1236. [PubMed] [Google Scholar]
- 41.Kleihues P, Burger PC, Scheithauer BW. The new WHO classification of brain tumours. Brain Pathol. 1993;3:255–268. doi: 10.1111/j.1750-3639.1993.tb00752.x. [DOI] [PubMed] [Google Scholar]
- 42.Karhadkar SS, Bova GS, Abdallah N, Dhara S, Gardner D, Maitra A, Isaacs JT, Berman DM, Beachy PA. Hedgehog signalling in prostate regeneration, neoplasia and metastasis. Nature. 2004;431:707–712. doi: 10.1038/nature02962. [DOI] [PubMed] [Google Scholar]
- 43.Mercier C, Decleves X, Masseguin C, Fragner P, Tardy M, Roux F, Gabrion J, Scherrmann JM. P-glycoprotein (ABCB1) but not multidrug resistance-associated protein 1 (ABCC1) is induced by doxorubicin in primary cultures of rat astrocytes. J Neurochem. 2003;87:820–830. doi: 10.1046/j.1471-4159.2003.02034.x. [DOI] [PubMed] [Google Scholar]
- 44.Wang Z, Fu Z, Zhao Z. Abnormal Cyclin D1/p16-pRB pathway and changes of cell proliferation and apoptosis in human brain gliomas. Journal of Jiangsu University (Medicine Edition) 2003;13:101–103. [Google Scholar]
- 45.Coultas L, Strasser A. The role of the Bcl-2 protein family in cancer. Semin Cancer Biol. 2003;13:115–123. doi: 10.1016/s1044-579x(02)00129-3. [DOI] [PubMed] [Google Scholar]
- 46.Gysin R, Azzi A, Visarius T. Gamma-tocopherol inhibits human cancer cell cycle progression and cell proliferation by down-regulation of cyclins. FASEB J. 2002;16:1952–1954. doi: 10.1096/fj.02-0362fje. [DOI] [PubMed] [Google Scholar]
- 47.Hoffmann A, Levchenko A, Scott ML, Baltimore D. The IkappaB-NF-kappaB signaling module: temporal control and selective gene activation. Science. 2002;298:1241–1245. doi: 10.1126/science.1071914. [DOI] [PubMed] [Google Scholar]
- 48.Stan AC, Casares S, Radu D, Walter GF, Brumeanu TD. Doxorubicin-induced cell death in highly invasive human gliomas. Anticancer Res. 1999;19:941–950. [PubMed] [Google Scholar]
- 49.Sheikh MS, Shao ZM, Hussain A, Fontana JA. The p53-binding protein MDM2 gene is differentially expressed in human breast carcinoma. Cancer Res. 1993;53:3226–3228. [PubMed] [Google Scholar]
- 50.Sims-Mourtada J, Izzo JG, Apisarnthanarax S, Wu TT, Malhotra U, Luthra R, Liao Z, Komaki R, van der Kogel A, Ajani J, Chao KS. Hedgehog: an attribute to tumor regrowth after chemoradiotherapy and a target to improve radiation response. Clin Cancer Res. 2006;12:6565–6572. doi: 10.1158/1078-0432.CCR-06-0176. [DOI] [PubMed] [Google Scholar]
- 51.Srivenugopal KS, Ali-Osman F. The DNA repair protein, O(6)-methylguanine-DNA methyltransferase is a proteolytic target for the E6 human papillomavirus oncoprotein. Oncogene. 2002;21:5940–5945. doi: 10.1038/sj.onc.1205762. [DOI] [PubMed] [Google Scholar]
- 52.Ishikawa T, Zhang SS, Qin X, Takahashi Y, Oda H, Nakatsuru Y, Ide F. DNA repair and cancer: lessons from mutant mouse models. Cancer Sci. 2004;95:112–117. doi: 10.1111/j.1349-7006.2004.tb03190.x. [DOI] [PMC free article] [PubMed] [Google Scholar]
- 53.Wolf P, Hu YC, Doffek K, Sidransky D, Ahrendt SA. O(6)-Methylguanine-DNA methyltransferase promoter hypermethylation shifts the p53 mutational spectrum in non-small cell lung cancer. Cancer Res. 2001;61:8113–8117. [PubMed] [Google Scholar]
- 54.Harris LC, von Wronski MA, Venable CC, Remack JS, Howell SR, Brent TP. Changes in O6-methylguanine-DNA methyltransferase expression during immortalization of cloned human fibroblasts. Carcinogenesis. 1996;17:219–224. doi: 10.1093/carcin/17.2.219. [DOI] [PubMed] [Google Scholar]
- 55.Qiu Z, Shen D, Sai K, Chen Y, Feng B, Chen Z. MGMT expression in glioma stem cell-like cells and tolerance to temozolomide. Chinese Journal of Neuro-oncology. 2011;9:107–114. [Google Scholar]
- 56.Zhan Q, Kontny U, Iglesias M, Alamo I Jr, Yu K, Hollander MC, Woodworth CD, Fornace AJ Jr. Inhibitory effect of Bcl-2 on p53-mediated transactivation following genotoxic stress. Oncogene. 1999;18:297–304. doi: 10.1038/sj.onc.1202310. [DOI] [PubMed] [Google Scholar]
- 57.Adams JM, Cory S. The Bcl-2 protein family: arbiters of cell survival. Science. 1998;281:1322–1326. doi: 10.1126/science.281.5381.1322. [DOI] [PubMed] [Google Scholar]
- 58.Pan Q, Yang X. Research progress in molecular mechanisms of chemotherapy drug tolerance of gliomas. Chinese Journal of Clinical Neurosurgery. 2010;15:118–122. [Google Scholar]
- 59.Youn CK, Cho HJ, Kim SH, Kim HB, Kim MH, Chang IY, Lee JS, Chung MH, Hahm KS, You HJ. Bcl-2 expression suppresses mismatch repair activity through inhibition of E2F transcriptional activity. Nat Cell Biol. 2005;7:137–147. doi: 10.1038/ncb1215. [DOI] [PubMed] [Google Scholar]