

Abstract
The objective of this study was to assess the expression of SARI (Suppressor of AP-1, Regulated by IFN) in prostate cancer (Pca) and explore the effects and possible mechanism of action of SARI in the occurrence and development of Pca. In the current study, the expression of SARI was detected using PCR in 40 patients with prostate cancer, 20 patients with prostatic hyperplasia, and prostate cancer cells (LNCaP. and DU145). In addition, the effects of the pro-inflammatory cytokine interferon (IFN)-β on the expression of SARI in DU145 prostate cancer cells and the possible potential signaling pathways activated by SARI were detected using RT-PCR. The expression of SARI protein was downregulated from 0.6957 ± 0.0104 to 0.1597 ± 0.0032 in prostate cancer cells compared with normal prostate tissues and cells. In addition, SARI gene expression increased from 0.0794 ± 0.0133 to 0.1232 ± 0.0162 significantly in a concentration- and time-dependent manner in DU145 cells treated with IFN-β (P<0.05). Finally, MTT assays demonstrated that DU145 cells growth slowed down, flow cytometry demonstrated that IFN-β induced apoptosis increased from 0.0343 ± 0.0039 to 0.0612 + 0.0025 in DU145 prostate cancer cells. In conclusion, the results of the current study suggest that SARI might play an important role in the occurrence and development of prostate cancer. In addition, IFN-β might inhibit the growth of prostate cancer and promote cellular apoptosis by inducing the expression of SARI.
Keywords: SARI, cancer growth suppressing gene, prostate cancer, IFN-β
Introduction
Prostate cancer (Pca) is the most frequent tumor in male reproductive system, with a common age of onset of 45-89 years. The incidence of Pca is significantly higher in developed countries compared with developing countries, and the global incidence shows an increasing trend [1,2]. The increasing number of studies performed on malignant tumors has led to the discovery of more and more signaling pathways and cancer genes. Su [3] describe a novel basic leucine zipper containing type I IFN-inducible early response gene SARI (Suppressor of AP-1, Regulated by IFN). Steady-state SARI mRNA expression was detected in multiple lineage-specific normal cells, but not in their transformed/tumorigenic counterparts. Several studies [4-6] shown that SARI expression was significantly reduced in most hepatocellular carcinoma, non-small cell lung cancer and oral tongue squamous cell carcinoma tissues, when compared with nontumorous tissues, as well as in the cell lines. Survival time was significantly shorter than those without reduction in SARI expression in non-small cell lung cancer [6].
In the current study, we compared the expression of SARI in 60 prostate specimens isolated from patients with prostate cancer and benign prostate hyperplasia using RT-PCR and western blotting. We also analyzed the effects of IFN-β on prostate cancer cell growth and apoptosis using flow cytometry, as well as on the expression on SARI and related signaling genes using RT-PCR. Finally, the diagnostic and prognostic potential of SARI in prostate cancer was evaluated.
Materials and methods
Patients and sample collection
Prostate tissue specimens from 60 hospitalized patients in the Third Xiangya Hospital of Central South University Department of Urology were selected between January 2011 and December 2013, including 40 cases from prostate cancer patients and 20 cases from individuals with benign prostatic hyperplasia. Written informed consent was obtained from all patients, and the study was approved by the ethics committee of our institution. All samples were fixed in 10% formalin, embedded in paraffin, and cut into serial sections with a thickness of 4 μm. One section was stained with hematoxylin and eosin (H&E), and then analyzed by two chief physicians in the Department of Pathology. The samples were then diagnosed according to the tumor classification standard reported by the World Health Organization (WHO; 2004 edition) [7]. The mean age of patients in the prostate cancer group was 71 years (range, 51-89 years). All patients were diagnosed with prostate cancer during a prostate operation (TURP or Radical prostatectomy) or transperineal prostate pathological biopsy. No patients received radiotherapy and chemotherapy before the operation. The mean age of individuals in the prostatic hyperplasia group was 70.2 years (range, 58-85 years).
Reagents
LNCaP (androgen-dependent prostate cancer cells), DU145 (androgen-independent prostate cancer cells), and RWPE-1 (normal prostate epithelial cells) were purchased from the cell bank of the Chinese Academy of Sciences (Shanghai, China). SARI was purchased from Santa Cruz Biotechnology (CA, USA). Secondary antibodies and diaminobenzidine (DAB) chromogenic agent were obtained from Fuzhou Maixin Technology (Fuzhou, China). The PCR primers used in the current study were synthesized by Shanghai Shenggong Biological Engineering (Shanghai, China). DEME was obtained from Gibco (Carlsbad, CA). IFN-β was obtained from PEPEOTECH (NJ, USA). GAPDH was purchased from Kaiji Biological (Nanjing, China).
Cell culture
LNCaP and DU145 cells were cultured in DMEM supplemented with 10% newborn calf serum (Gibco), 100 U/ml penicillin, 100 U/ml streptomycin, and 0.01 U/ml insulin. RWEP-1 cells were cultured in RPMI 1640 medium, containing active carbon/dextran-treated fetal bovine serum (Biological Industries). All cells were cultured at 37°C in an atmosphere containing 5% CO2 saturated humidity. The media were changed every 2-3 days.
PCR
DNA was extracted from tissues. The primers were designed according to sequences of target genes and relevant information provided in GenBank using the software Primer 5.0. PCR reactions were the performed using a TaKaRa kit (number of RR820A) following the manufacturer’s instructions. The sequences used to amplify the SARI, GAPDH-1 genes are provided in Table 1. The PCR condition was as follows: Step 1, 94°C 7 min; Step 2, 94°C 30 s, 60°C 30 s, 72°C 30 s, total 32 cycles; Finally, 72°C 7 min. Five-microliter PCR reaction product was electrophoresed on 1.5% agarose gel for 30smin (80 V), and images were captured and the density was analyzed using an image analyzer. The density of GAPDH was used as the standard for semi-quantitative analysis.
Table 1.
PCR primer sequences
| Gene | Primer sequence | Product length (bp) |
|---|---|---|
| GAPDH | F, 5’-CAAGGTCATCCATGACAACTTTG-3’ | 496 |
| R, 5’-GTCCACCACCCTGTTGCTGTAG-3’ | ||
| SARI | F. 5’-TCCTCTGCTCTCCTCTGCTC-3’ | |
| R, 5’-CTTGGACTTGTCACTTGGCTTC-3’ | 319 |
Western blotting
Cells in a logarithmic growth phase were incubated with 0.25% trypsin and plated into 6-well plate at a density of 3 × 10⁴/well. LNCaP, DU145, and RWPE-1 cells were divided into three groups. Cells were homogenized and lysed with RIPA lysis buffer (Beyotime, Nantong, China) to extract the total protein, followed by protein concentration measurements by the micro-BCA protein assay (Pierce). A total of 150 μg protein per lane was separately electrophoresed by 12% SDS-PAGE, and then were transferred to a PVDF membrane (Schleicher & Schuell, Germany). To blocking the nonspecific binding, the membranes were incubated with 5% nonfat milk in TBST buffer at 4°C overnight. Then, the indicated primary antibodies against SARI were added for 1 h. The membrane was then incubated with secondary antibodies. The bands were visualized using enhanced chemiluminescence (ECL; Amersham Corporation), scanned and photographed.
Treating DU-145 cells with IFN-β
DU-145 cells were treated with different concentrations (0, 2, 10, 50, 100, 250, 500, 1000, and 5000 U/ml) of IFN-β for 24 h, and the expression of SARI mRNA was analyzed using RT-PCR as described above. In additional experiments, the expression of the same mRNAs was analyzed in DU-145 cells that had been treated with 1000 U/m IFN-β for different times (1, 2, 6, 12, 24, 36, 48 h).
MTT assays
DU145 Cells were incubated in 96-well plates at a density of 1 × l05 cells/well. After culture for 48 h, culture media containing two concentrations of IFN-β (0 and 1000 U/ml) were added to wells in triplicate, and the cells were incubated for 24 h. Then, 20 μl of 5 mg/ml MTT solution was added to each well, and plates were incubated for 4 h. The supernatant was discarded, 150 μl DMSO solution was added to each well, and plates were shaken for 10 min. The absorbance was the measured at 490 nm.
Measuring apoptosis using Annexin V-FITC/PI double-staining
Cells were treated with two concentrations of IFN-β (0 and 1000 U/ml) for 24 h, inoculated into a 100-ml culture flask at a concentration of 2 × 10⁵ cells/mL, and cultured for 48 h. A total of 5 × 10⁵ cells/group were collected after trypsin digestion, and double stained with annexin V FITC/PI. Apoptosis was then assessed using flow cytometry.
Statistical analysis
Data were analyzed using SPSS version 17.0 statistical software. The normal distribution was assessed using Skewness normal distribution tests. Measurement data are presented as means ± standard deviations (X ± S). Independent samples t-tests were used for comparisons between the two groups. Levene’s tests for equality of variance on homogeneity of variance were used to determine whether differences between the two groups were statistically significant, and P<0.05 was considered significant. Pearson’s correlation analysis was used to determine whether there was a correlation between the two groups. Finally, single factor analysis of variance was used for comparisons between groups at different concentrations and different times.
Results
Expression of SARI in prostate cancer and benign prostatic hyperplasia tissues
The expression of SARI DNA in prostate cancer and prostatic hyperplasia tissues was 0.2149 ± 0.0872 and 0.5113 ± 0.0863, respectively. The expression of SARI DNA was significantly higher in prostate hyperplasia tissue than in prostate carcinoma (P<0.05). (Figure 1).
Figure 1.
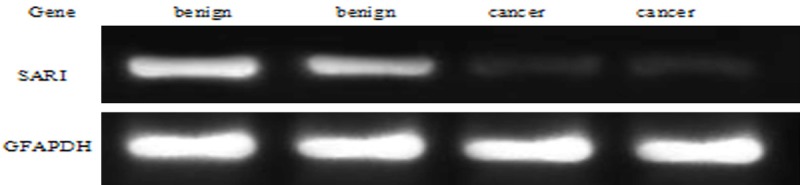
Expression of SARI DNA in prostate cancer and benign prostatic hyperplasia tissues.
Correlation between SARI DNA expression and the clinicopathologic parameters of prostate cancer
The expression of SARI in prostate cancer tissues is independent on age (χ2=0.161, P=0.874), and correlated with the serum PSA (χ2=26.792, P=0), the clinical stage of the tumor (χ2=63.582, P=0), Gleason score (χ2=8.105, P=0.001), and presence or absence of distant metastasis (χ2=3.099, P=0.005). (Table 2).
Table 2.
Correlation between SARI DNA expression and the clinicopathologic parameters of prostate cancer (n=42)
| Clinicopathological fators | Expression of SARI DNA | χ2 | P-Value |
|---|---|---|---|
| Age (year) | |||
| <70 | 0.222 ± 0.091 | 0.161 | 0.874 |
| ≥70 | 0.227 ± 0.097 | ||
| PSA (ng/ml) | |||
| <4 | 0.306 ± 0.051 | 26.792 | 0 |
| 4-10 | 0.292 ± 0.058 | ||
| >10 | 0.155 ± 0.068 | ||
| Clinical stage | |||
| T2 | 0.321 ± 0.044 | 63.582 | 0 |
| T3 | 0.267 ± 0.054 | ||
| T4 | 0.135 ± 0.0434 | ||
| Gleason score | |||
| ≤6 | 0.290 ± 0.061 | 8.105 | 0.001 |
| 7 | 0.228 ± 0.099 | ||
| ≥8 | 0.143 ± 0.040 | ||
| Distant metastasis | |||
| Yes | 0.196 ± 0.082 | ||
| No | 0.285 ± 0.091 | 3.099 | 0.005 |
SARI expression in prostate cancer cells
First, the expression of SARI RNA was assessed in DU-145 and LNCaP prostate cancer and RWPE-1 cells (Figure 2). The expression of SARI RNA in DU-145 and LNCaP prostate cancer was 0.0792 ± 0.0034 and 0.1576 ± 0.0053, respectively. The expression of SARI RNA in RWPE-1 was 0.3691 ± 0.0164. SARI was expressed highly in RWPE-1 normal prostate epithelial cells, but only at low levels in DU-145 and LNCaP prostate cancer cells; the difference in expression between normal prostate epithelial cells and Pca cells was statistically significant (P<0.05). In addition, there was statistically significant difference in SARI expression between DU-145 and LNCaP cells (P<0.05).
Figure 2.
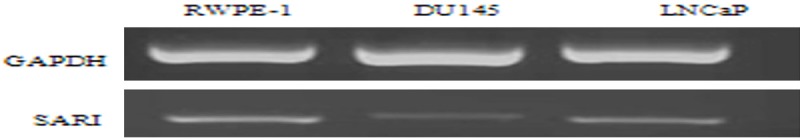
Electrophoresis bands of RT-PCR amplification products in different prostate cell lines.
Expression of SARI protein in different prostate cell lines
Western blotting analysis of SARI protein levels is presented in (Figure 3). The expression of SARI protein levels in DU-145 and LNCaP prostate cancer was 0.1597 ± 0.0032 and 0.4373 ± 0.0061, respectively. The expression of SARI RNA in RWPE-1 was 0.6957 ± 0.0104. The expression of SARI protein in prostate cell lines was shown with the gray value ratio of target gene and β-actin band (X ± S). A band corresponding to SARI protein was detected in all three cell lines; however, the expression differed among cells. Specifically, SARI expression was significantly higher in RWPE-1 cells compared with DU-145 and LNCaP cells. In addition, SARI expression was significantly higher in LNCaP androgen-dependent prostate cancer cells than in DU-145 androgen-independent cells (P<0.05).
Figure 3.
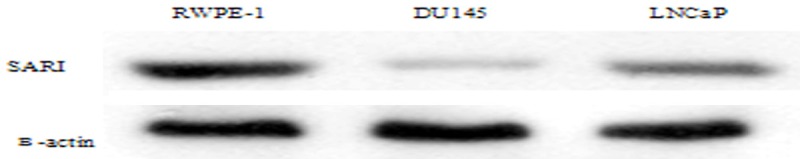
Western blotting analysis of SARI in different prostate cell lines.
Pearson’s correlation analysis of the expression of SARI protein and mRNA revealed that SARI protein levels were correlated positively with the expression of SARI mRNA (Δct) in the different prostate cell lines (P<0.05); therefore, SARI protein expression was positively correlated with SARI gene expression.
Effects of IFN-β on DU-145 prostate cancer cells
The expression of SARI mRNA in DU-145 cells that had been treated with different concentrations of IFN-β for 24 h is shown in Table 3. SARI gene expression increased in on DU145 cells treated with IFN-β for 24 h in a dose-dependent manner (F=2.982, P<0.05). When the concentration of IFN-β reached 1000 U/ml, there was a statistically significant difference in the expression of SARI compared with the control group.
Table 3.
The expression of SARI in DU-145 prostate cancer cells that had been treated with IFN-β for 24 h
| Concentration (U/ml) | 0 | 2 | 10 | 50 | 250 | 500 | 1000 | 5000 |
|---|---|---|---|---|---|---|---|---|
| SARI | 0.1217 ± 0.0144 | 0.1240 ± 0.0111 | 0.1300 ± 0.0160 | 0.1367 ± 0.0112 | 0.1409 ± 0.0093 | 0.1478 ± 0.0159 | 0.1534 ± 0.0088*,# | 0.6398 ± 0.0252 |
P<0.05 vs. control group;
P<0.05 vs. 2 U/ml.
Next, the expression of SARI mRNA in DU-145 cells that had been treated with 1000 U/ml IFN-β for different periods of time was assessed. As shown in Table 4, SARI gene expression in response to IFN-β was time-dependent (P<0.05), and the expression was highest after 24 h (Figure 4).
Table 4.
The expression of SARI after treatment with DU-145 cells with 1000 U/ml IFN-β
| Time (h) | 0 | 2 | 6 | 12 | 24 | 36 | 48 |
|---|---|---|---|---|---|---|---|
| SARI | 0.0794 ± 0.0133 | 0.109 ± 0.0078* | 0.1226 ± 0.0114* | 0.1338 ± 0.0119*,# | 0.1321 ± 0.0162*,# | 0.1256 ± 0.0173* | 0.1291 ± 0.0174* |
P<0.05 vs. control group;
P<0.05 vs. 2 h.
Figure 4.
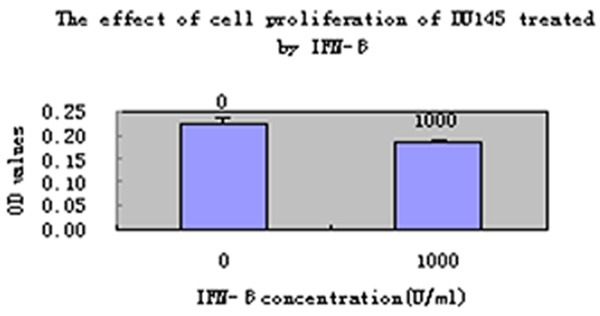
The effect of DU145 down-regulation on cell proliferation treated by IFN-β (1000 U/ml).
Effects of IFN-β on of DU-145 cell proliferation and apoptosis
As shown in Figure 5, treating DU-145 cells with IFN-β (1000 U/ml) for 24 h, inhibited DU-145 cell proliferation significantly compared with the untreated control group, DU145 cells growth slowed down and the proliferation was inhibited in the experimental group (Figure 5). To confirm these effects, apoptosis was also assessed in DU145 cells that had been treated with 1000 U/ml IFN-β for 24 h using flow cytometry. Compared with the untreated group, apoptosis was increased in DU-145 cellsfrom 0.0343 ± 0.0039 to 0.0612 + 0.0025. Unpaired Student’s t-tests revealed that the difference between the two groups was statistically significant (P<0.05).
Figure 5.
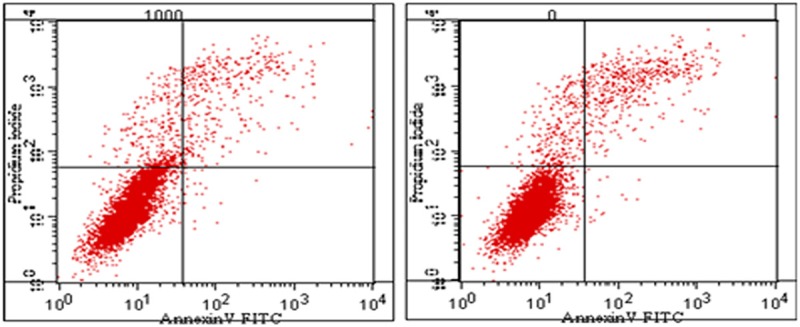
DU145 cell apoptosis after treatment with 1000 U/ml IFN-β.
Discussion
SARI, also named BATF2, is a tumor suppressor gene that is expressed widely in many normal tissues, but expressed only at low levels in tumor tissues [3,8]. In 2008, Su [3] transfected a SARI-overexpressing adenovirus and empty vector into cells, and demonstrated that SARI killed tumor cells selectively. Using a human lung xenograft-mouse model, it can be observed that knocking down endogenous SARI in human carcinoma cells leads to the development of multiple lymph node metastases [9].
In this study, SARI DNA were extracted from the cancerous and proliferative tissues of prostate, and the results showed the SARI DNA expression in prostate cancer tissues was significantly lower than that in prostatic hyperplasia tissues, suggesting the difference in SARI expression level may be correlated with the development of prostate cancer. It was discovered after further statistical analysis that the relative expression of SARI DNA in prostate cancer patients was independent on age, but closely correlated with the serum PSA, tumor stage, and Gleason score, suggesting SARI expression down-regulation is closely correlated with the malignant biological behavior of the tumor.
The expression of SARI mRNA was significantly higher in normal prostate epithelial cells than in prostate cancer cells. Consistent with this, SARI expression was higher in prostatic hyperplasia tissues compared with prostate cancer tissues. Thus, we hypothesized that the expression of SARI was cell-type specific and that SARI protein expression was regulated at the transcriptional level. The current experiments confirmed that there was a large difference in the expression of SARI among different prostate cancer cell lines. As far as was known, DU145 and LNCAP were commonly used in studies of the prostate, which had different biological characteristics. LNCaP are an androgen-dependent cell line that represents early stage cancer. Conversely, DU-145 cells are androgen-independent, and so have high invasive and metastatic characteristics. The expression of SARI mRNA and protein was higher in LNCaP compared with DU-145 cells. This suggests that SARI expression might begin to decrease early in the development of prostate cancer and might be involved in inhibiting tumor invasion and metastasis.
In recent years, increasing attention has been paid to the relationship between IFN and prostate cancer. IFN can prevent the occurrence of prostate cancer by mediating acute inflammatory pathways that inhibit proliferation and promote apoptosis; IFN-γ may slow proliferation of some gastric cancer cells by affecting the cell cycle to play a negative role in the development of gastric cancer [10]; these effects are achieved primarily by the downregulation of oncogenes (neu and HER-2) [11] and the upregulation of tumor suppressors (p21, p53, and TRAIL) [12,13]. In addition, IFN can stimulate the expression of the downstream antiviral gene OASL and its receptor RNASEL and PKR (double-stranded RNA-dependent protein kinase) [14] to inhibit the prostate cancer cell proliferation [15]. In recent years IFN has also been used, either as a single treatment or as an adjuvant therapy to chemotherapy in solid tumors (Pancreatic adenocarcinoma [16], hepatocellular carcinoma [17] and malignant hematological diseases (lymphoma and leukemia). Moreover, IFN can induce hematological remission as well as the remission of cytogenetics in the treatment of chronic myeloid leukemia, suggesting that IFN has potential anti-tumor effects. An in-depth study of its effect in prostate cancer might be useful, particularly in patients with hormone-refractory tumors.
DU-145 cell proliferation and apoptosis were analyzed using flow cytometry after treatment with IFN-β. Data revealed that DU-145 cells treated with IFN-β proliferated less than did those in the control group; they also had a higher rate of apoptosis. This suggests that IFN-β could inhibit cell proliferation and promote apoptosis significantly. Analysis of the expression of SARI mRNA before and after treatment with IFN-β demonstrated that IFN-β had concentration- and time-dependent effects of SARI expression. This suggests that modulating SARI expression might be a mechanism by which IFN-β inhibits tumor proliferation and promotes tumor cell apoptosis. IFN-β acts on prostate cancer cells, and the SARI expression is significantly time-dependent and concentration-dependent. At 24 after induction, the SARI mRNA relative expressions of 1000 group were higher than those of 0 U/ml group (all P<0.05); after the concentration was continuously increased, the SARI mRNA expression was increased, suggesting the induction is gradually strengthened following the increase of IFN-β concentration. In the aspect of induction time, of 1000 U/ml group, at 24 h after induction, the SARI mRNA expression reached the highest; as the induction time was continuously prolonged, the SARI mRNA expression was decreased on the contrary, suggesting 24 h may be the most suitable time for IFN-β to induce SARI mRNA expression to promote tumor apoptosis. We presume that IFN-β acts on prostate cancer cells, which may be via adjustment of SARI gene, which requires confirmation by further studies.
In conclusion, the results of the current study suggest that SARI might play an important role in the occurrence and development of prostate cancer. In addition, IFN-β might inhibit the growth of prostate cancer and promote cellular apoptosis by inducing the expression of SARI. IFN-β acts on prostate cancer cells, and the SARI expression is significantly time-dependent and concentration-dependent. IFN may be used as a therapeutic tool for prostate cancer, especially non-hormonal-dependent advanced prostate cancer.
Disclosure of conflict of interest
None.
References
- 1.Brawley OW. Prostate cancer epidemiology in the United States. World J Urol. 2012;30:195–200. doi: 10.1007/s00345-012-0824-2. [DOI] [PubMed] [Google Scholar]
- 2.Cullen J, Elsamanoudi S, Brassell SA, Chen Y, Colombo M, Srivastava A, McLeod DG. The burden of prostate cancer in Asian nations. J Carcinog. 2012;11:7. doi: 10.4103/1477-3163.94025. [DOI] [PMC free article] [PubMed] [Google Scholar]
- 3.Su ZZ, Lee SG, Emdad L, Lebdeva IV, Gupta P, Valerie K, Sarkar D, Fisher PB. Cloning and characterization of SARI (suppressor of AP-1, regulated by IFN) Proc Natl Acad Sci U S A. 2008;105:20906–20911. doi: 10.1073/pnas.0807975106. [DOI] [PMC free article] [PubMed] [Google Scholar]
- 4.Ma H, Liang X, Chen Y, Pan K, Sun J, Wang H, Wang Q, Li Y, Zhao J, Li J, Chen M, Xia J. Decreased expression of BATF2 is associated with a poor prognosis in hepatocellular carcinoma. Int J Cancer. 2011;128:771–7. doi: 10.1002/ijc.25407. [DOI] [PubMed] [Google Scholar]
- 5.Wen H, Chen Y, Hu Z, Mo Q, Tang J, Sun C. Decreased expression of BATF2 is significantly associated with poor prognosis in oral tongue squamous cell carcinoma. Oncol Rep. 2014;31:169–74. doi: 10.3892/or.2013.2863. [DOI] [PubMed] [Google Scholar]
- 6.Zhou RJ, Shi Z, Zhou K, Wang HD, Zhang GQ, Li XT, Xu JP. Decreased SARI expression predicts poor prognosis of Chinese patients with non-small cell lung cancer. Int J Clin Exp Pathol. 2013;6:2056–63. [PMC free article] [PubMed] [Google Scholar]
- 7.Eble JN, Sauter G, et al. World Health Organization classification of Tumors of the Urinary System and Male Genital Organs. 2004. [Google Scholar]
- 8.Rayet B, Gelinas C. Aberrant Rel/NFkB genes and activity in human cacer. Oncogene. 1999;18:6938–47. doi: 10.1038/sj.onc.1203221. [DOI] [PubMed] [Google Scholar]
- 9.Wang C, Su Y, Zhang L, Wang M, You J, Zhao X, Zhang Z, Liu J, Hao X. The function of SARI in modulating epithelial-mesenchymal transition and lung adenocarcinoma metastasis. PLoS One. 2012;7:e38046. doi: 10.1371/journal.pone.0038046. [DOI] [PMC free article] [PubMed] [Google Scholar]
- 10.Zhao YH, Wang T, Yu GF, Zhuang DM, Zhang Z, Zhang HX, Zhao DP, Yu AL. Anti-proliferation Effects of Interferon-gamma on Gastric Cancer Cells. Asian Pac J Cancer Prev. 2013;14:5513–8. doi: 10.7314/apjcp.2013.14.9.5513. [DOI] [PubMed] [Google Scholar]
- 11.Kominsky SL, Hobeika AC, Lake FA, Torres BA, Johnson HM. Down-regulation of neu/HER-2 by interferon-gamma in Prostate cancer cells. Cancer Res. 2000;60:3904–08. [PubMed] [Google Scholar]
- 12.Ruiz-Ruiz C, LoPez-Rivas A. Mitochondrial-dependent and -independent mechanisms in tumour necrosis factor-related apoptosis-inducing liand(TRAIL)-induced apoptosis are both regulated by interferon-gamma in human breast tomour cells. Biochem J. 2002;365:825–32. doi: 10.1042/BJ20020184. [DOI] [PMC free article] [PubMed] [Google Scholar]
- 13.Park SY, Seol JW, Lee YJ, Cho JH, Kang HS, Kim IS, Park SH, Kim TH, Yim JH, Kim M, Billiar TR, Seol DW. IFN-gamma enhances TRAIL-induced apoptosis through IRF-1. Eur J Biochem. 2004;271:4222–28. doi: 10.1111/j.1432-1033.2004.04362.x. [DOI] [PubMed] [Google Scholar]
- 14.Ichikawa T, Nakao K, Nakata K, Yamashita M, Hamasaki K, Shigeno M, Abiru S, Ishikawa H, Ishii N, Eguchi K. Involvement of IL-1beta and IL-10 in IFN-alpha-mediated antiviral gene induction in human hepatoma cells. Biochem Biophys Res Commun. 2002;294:414–22. doi: 10.1016/S0006-291X(02)00502-8. [DOI] [PubMed] [Google Scholar]
- 15.Malathi K, Paranjape JM, Bulanova E, Shim M, Guenther-Johnson JM, Faber PW, Eling TE, Williams BR, Silverman RH. A transcriptional signaling pathway in the IFN system mediated by 2’-5’-oligoadenylate activation of RNase. Proc Natl Acad Sci U S A. 2005;102:14533–14538. doi: 10.1073/pnas.0507551102. [DOI] [PMC free article] [PubMed] [Google Scholar]
- 16.Wang WJ, Qin SH, Zhang JW, Jiang YY, Zhang JN, Zhao L. Combination Doxorubicin and Interferon-α Therapy Stimulates Immunogenicity of Murine Pancreatic Cancer Panc02 Cells via Up-regulation of NKG2D ligands and MHC Class. Asian Pac J Cancer Prev. 2014;15:9667–72. doi: 10.7314/apjcp.2014.15.22.9667. [DOI] [PubMed] [Google Scholar]
- 17.Zuo CH, Xia M, Liu JS, Qiu XX, Lei X, Xu RC, Liu HC, Li JL, Li YG, Li QL, Xiao H, Hong Y, Wang XH, Zhu HZ, Wu QF, Burns M, Liu C. Transcatheter Arterial Chemoembolization Combined with Interferon-α is Safe and Effective for Patients with Hepatocellular Carcinoma after Curative Resection. Asian Pac J Cancer Prev. 2015;16:245–51. doi: 10.7314/apjcp.2015.16.1.245. [DOI] [PubMed] [Google Scholar]