Abstract
Many studies have shown that training and testing conditions modulate specificity of visual learning to trained stimuli and tasks. In visually impaired populations, generalizability of visual learning to untrained stimuli/tasks is almost always reported, with contrast sensitivity (CS) featuring prominently among these collaterally-improved functions. To understand factors underlying this difference, we measured CS for direction and orientation discrimination in the visual periphery of three groups of visually-intact subjects. Group 1 trained on an orientation discrimination task with static Gabors whose luminance contrast was decreased as performance improved. Group 2 trained on a global direction discrimination task using high-contrast random dot stimuli previously used to recover motion perception in cortically blind patients. Group 3 underwent no training. Both forms of training improved CS with some degree of specificity for basic attributes of the trained stimulus/task. Group 1's largest enhancement was in CS around the trained spatial/temporal frequencies; similarly, Group 2's largest improvements occurred in CS for discriminating moving and flickering stimuli. Group 3 saw no significant CS changes. These results indicate that CS improvements may be a natural consequence of multiple forms of visual training in visually intact humans, albeit with some specificity to the trained visual domain(s).
Keywords: Gabors, global motion direction, learning, specificity, generalizability
Introduction
Many visual abilities can be readily improved with practice, including Vernier acuity (Fahle, 1997; McKee & Westheimer, 1978), orientation discrimination (Fahle, 1997; Schoups, Vogels, & Orban, 1995), spatial frequency discrimination (Fiorentini & Berardi, 1980), direction discrimination (Ball & Sekuler, 1982) and texture discrimination (Karni & Sagi, 1991). However, while contrast sensitivity (CS) is one of the most basic attributes of vision (Campbell, 1983; Campbell & Green, 1965; Campbell & Robson, 1968; Kelly, 1975; Kelly, 1979; Roufs, 1972), some common training paradigms fail to improve it, while others succeed (Adini, Sagi, & Tsodyks, 2002; Adini, Wilkonsky, Haspel, Tsodyks, & Sagi, 2004; Deveau, Lovcik, & Seitz, 2014; Deveau & Seitz, 2014; Dorais & Sagi, 1997; Xiao et al., 2008; Yu, Klein, & Levi, 2004; Zhang et al., 2008; Zhang, Zhang et al., 2010). Such inconsistent effects of training on CS are puzzling and yet, because CS is usually affected in visually-impaired populations, its restoration is highly sought after.
In adults with amblyopia, contrast detection training in the amblyopic eye can significantly enhance CS, with improvements occurring over a much greater spatial frequency bandwidth than in visually-intact, age-matched controls (Huang, Zhou, & Lu, 2008; Zhou et al., 2006). Similarly, adult patients with stroke-induced V1 damage, who were trained to detect or discriminate Gabor targets exhibited CS improvements at both trained and untrained spatial frequencies (Das, Tadin, & Huxlin, 2014; Sahraie et al., 2006). Even more curious were CS improvements observed when such patients trained with high-contrast stimuli, whose luminance contrast never varied (Das et al., 2014; Huxlin et al., 2009). Just as in individuals with amblyopia, CS improvements in V1-damaged subjects were unusually broad across spatial and temporal frequencies, and across orientations (Das et al., 2014).
When elicited in visually-intact humans, improvements in CS are usually specific to features of the trained stimulus, like spatial frequency, retinal location and orientation (Sowden, Rose, & Davies, 2002; Yu et al., 2004). However, if subjects are exposed to multiple stimulus/task attributes during training, contrast learning can transfer across retinal locations (Deveau et al., 2014; Xiao et al., 2008; Zhang et al., 2010), orientations (Zhang et al., 2010) and spatial frequencies (Deveau et al., 2014). For instance, in “double training” paradigms, subjects undergo either blocked or sequential training of contrast discrimination at one location, and orientation discrimination at a second location. This results in contrast discrimination learning across both locations (Xiao et al., 2008). Similarly, in training plus exposure paradigms involving orientation discrimination, observers are simultaneously or subsequently passively exposed to a second, untrained orientation; learning transfers to this second orientation in tasks previously thought to be orientation-specific (Zhang et al., 2010). In a more integrative approach, Deveau and colleagues created a “video game” task that incorporates selecting targets that vary in orientation, spatial frequency, location, and contrast amongst similarly varied patches of noise with the goal of maximizing accuracy and response time. This resulted in broadband increases in central and peripheral CS, as well as in acuity improvements (Deveau et al., 2014). These results motivated the current study, which asked whether broad CS improvements are: (1) specific to damaged/abnormal visual systems; (2) specific to the stimuli and tasks typically used for rehabilitation in damaged/abnormal visual systems; or (3) a natural consequence of many forms of visual training, in both visually-intact and visually-impaired humans. To begin probing potential mechanisms of the learning observed, we also evaluated whether the improvements attained were specific to the eye and visual field locations trained.
Methods
Subjects and experimental set-up
Twenty-four subjects were recruited (15 females, nine males). They were all University of Rochester students or employees between the ages of 19 and 42 years, with a mean age of 22 ± 5 years. All were neurologically healthy, with normal or corrected-to-normal visual acuity. All experiments and procedures here described adhered to the Declaration of Helsinki.
The experiments took place in three distinct parts: pretraining (baseline) tests, training, or no training for a period of 10 days, followed by posttraining tests. Subjects were randomly assigned to one of three groups:
Group 1: Five subjects were trained using an orientation discrimination task with static, nonflickering Gabors, whose luminance contrast decreased with performance.
Group 2: 12 subjects were trained on a global direction discrimination task using high-contrast, random dot stimuli.
Group 3: Seven subjects underwent no training, so as to ascertain the impact of repeat testing on CS.
All testing and training stimuli were presented in a gaze-contingent manner using an ISCAN eye tracker (ISCAN Inc., Woburn, MA) calibrated to each subject's left eye and interfaced with a custom, stimulus-presentation program. Training was performed monocularly with the left eye, blocking the right eye with an eye patch. Subjects were asked to fixate during stimulus presentation. If fixation moved more than one degree of visual angle from the fixation point during stimulus presentation, the trial was aborted and a distinct sound played to inform the participant that they had broken fixation. Each subject kept his/her head on a chin-forehead-rest (Richmond Products, Albuquerque, NM) located 42 cm away from a linearized, 19-inch Nanao monitor (Eizo Nanao, Ishikawa, Japan).
Pre- and post-training measurements
Luminance CS was measured for a range of spatial and temporal frequencies with drifting gratings presented in a circular “pillbox” envelope (diameter = 5°) or static gratings presented in a Gaussian envelope (i.e., Gabor patches; sigma = 1.2°). These envelope differences were due to limitations in the software used to generate moving stimuli, which cannot generate gradual spatial envelopes. However, because we measured contrast thresholds, both envelopes were perceived as having a gradual boundary (i.e., at contrast threshold for the whole stimulus, the sharp edge of the circular envelope is below threshold). All stimuli were presented using a 250 ms raised cosine temporal envelope, and their space-averaged luminance was computed to be the same as that of the background to avoid stimulus detection as a result of changes in overall light flux. Four different contrast sensitivity functions (CSFs) were measured using a two-alternative forced-choice (2AFC) task for either left-right direction discrimination (Figure 1A) or vertical-horizontal orientation discrimination (Figure 1B):
Figure 1.
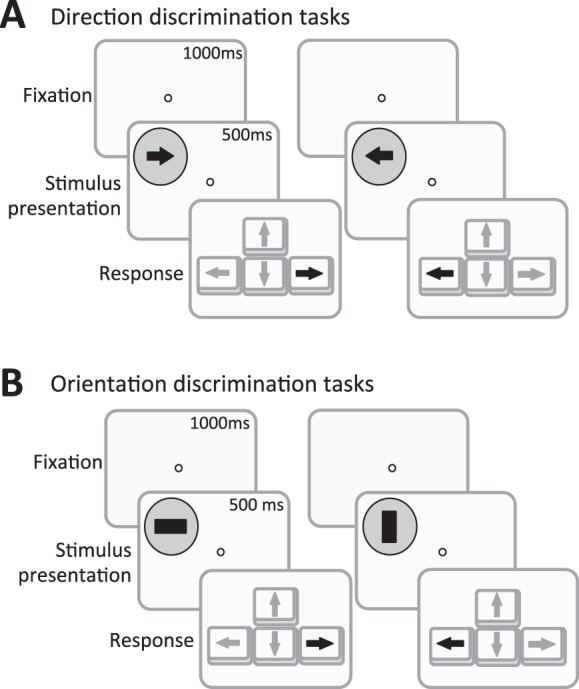
Discrimination tasks used for testing and training in the present study. (A) Direction discrimination. Subjects were first instructed to fixate on a central target. Eye tracking enforced fixation during stimulus presentation, aborting trials during which fixation moved > 1 degree of visual angle from the fixation target. After an initial 1000-ms fixation period period, a moving stimulus appeared peripherally for 500 ms. The subjects pressed the right arrow key if they perceived rightward motion, and the left arrow key if they perceived leftward motion. Direction discrimination was performed with either drifting gratings or moving dots. (B) Orientation discrimination was measured under the same constraints. Subjects pressed the left arrow key if they perceived a vertical stimulus orientation and the right arrow key if they perceived a horizontal stimulus orientation. Orientation discrimination was measured with either drifting gratings or static Gabors. Actual stimuli used in different conditions are shown in Figures 2–7.
Orientation discrimination (vertical vs. horizontal) of static, nonflickering Gabors, varying spatial frequencies between 0.1 and 8 cycles/°.
Orientation discrimination (vertical vs. horizontal) of moving gratings, with temporal frequency held constant at 10 Hz, and spatial frequencies varied between 0.1 and 8 cycles/°.
Left/right direction discrimination of moving gratings, with temporal frequency held constant at 10 Hz, while varying spatial frequency between 0.1 and 8 cycles/°.
Left/right direction discrimination of moving gratings, with spatial frequency held constant at 2 cycles/°, while varying temporal frequencies between 1 and 20 Hz.
Stimuli were presented using a 3:1 staircase, starting with the highest luminance contrast; contrast decreased with three consecutive, correct responses, and increased by one level with a single incorrect response. Thresholds were calculated by fitting a Weibull function to the percent correct performance at each stimulus contrast level and computing the luminance contrast corresponding to a threshold criterion of 75% correct performance. Threshold luminance contrast was further converted to CS by calculating its inverse and multiplying it by 100. One hundred trials were performed for each data point of each CSF in each subject, before and after training.
All four CSFs were measured at a single, trained, eccentric stimulus location in all subjects. This location was centered at (x, y) coordinates of (−5, 5) degrees, chosen to mimic the peripheral training done by cortically blind subjects in previous studies (Das et al., 2014; Huxlin et al., 2009). In addition to training-induced improvements in performance at the trained location, we evaluated eye and location transfer of this learning during post-training tests. Specifically, we tested performance through the untrained (right) eye at the trained location, as well as through the trained (left) eye, but at a corresponding untrained location in the lower visual field quadrant [(x,y) coordinates = (−5, −5) degrees]. Three Group 1 and six Group 2 subjects, selected at random, participated in these additional tests.
Training
Group 1
Five subjects were trained to discriminate the orientation (horizontal or vertical) of static, nonflickering Gabors with a spatial frequency of 2 cycles/°. As mentioned above, subjects were trained using a 3:1 staircase, starting with the highest luminance contrast. All subjects underwent 10 training sessions consisting of 300 trials each, on 10 consecutive days, with the exception of intervening weekends.
Group 2
Twelve subjects were trained on a 2AFC task of global, left versus right direction discrimination using random dot stimuli with the goal of improving direction range thresholds. The stimuli were circular, 5 degrees in diameter, containing 65, 4 × 4 pixel dark dots of fixed, near maximal contrast relative to background, and moving at 10°/s. In 10 of the 12 subjects, dot coherence was set to 15% (i.e., 15% of dots in each stimulus moved in a designated, narrow range of signal dot directions, with the remaining dots moving in random directions). The amount of coherence in the stimulus was chosen based on preliminary tests to identify a motion signal level at which subjects could perform just above chance (50% correct). The two remaining subjects required 20% and 45% coherence (i.e., less noise) to achieve this same level of performance—they were thus trained using 20% and 45% motion signal, respectively.
Subjects started each testing and training session with direction range set to 0°. Just as for contrast training, stimuli were presented using a 3:1 staircase, starting with the most coherent global motion. Direction range increased by 40° (between 0 and 360°) with three consecutive correct responses, and decreased by 40° with each incorrect response. Thresholds were calculated by fitting a Weibull function to the percent correct performance at each direction range level and computing the direction range corresponding to a threshold criterion of 75% correct performance.
Group 3
To control for the impact of repeat testing, seven subjects did not go through any training. Instead, they waited ten days (with intervening weekends) and then underwent the same post-training tests as Groups 1 and 2.
Statistical analysis
Data were fit with a log-parabola CSF (Lesmes, Lu, Baek, & Albright, 2010; Watson & Ahumada, 2005), adjusted for peripheral vision by eliminating the low spatial frequency truncation (Equation 1). This resulted in three parameters: peak sensitivity (γmax), peak spatial frequency ( fmax) and bandwidth (β, full-width at half-maximum in octaves) of the CSF:
 |
where κ = log10(2) and β′ = log10(2β).
To analyze the effects of training on CSF, we used a bootstrap analysis. First, we drew, with replacement, 10,000 pairs of bootstrap samples from individual subject results (i.e., pre- and post-test data shown by the small circles in Figures 3, 4, 5, and 6). Each pair of pre-test and post-test samples was matched to account for the repeated measures design. For example, if a certain spatial frequency was selected for Subject 1 at pre-testing, then the post-testing sample also included that spatial frequency for Subject 1. For each sample, we then fit Equation 1 to the data, obtaining 10,000 pairs of estimates of the CSF gain, center frequency, and bandwidth. P values were obtained by comparing the differences between pre-testing and post-testing distributions of the 10,000 bootstrapped estimates of gain, center frequency, and bandwidth. This bootstrap analysis was used only to compare CSF models from pre-testing to post-testing. Student's t tests were used for comparison of thresholds on the trained task (Figure 2) and a two-way ANOVA for transfer to untrained eye and location (Figure 7).
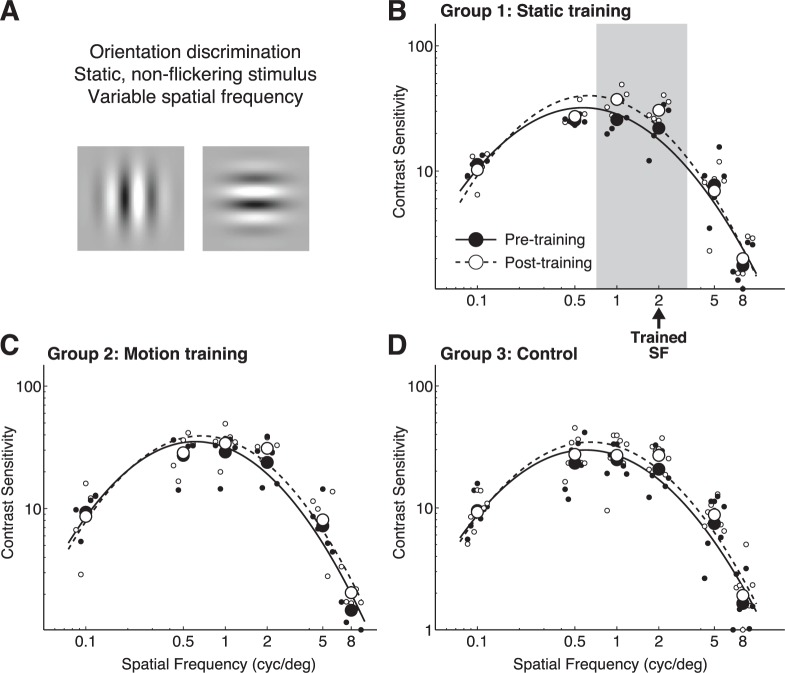
Figure 3.
CS versus spatial frequency for orientation discrimination of static, nonflickering Gabors. (A) Representation of stimuli used for testing. (B) Pre- and post-training contrast sensitivity functions at the trained location and measured through the trained eye in Group 1 (orientation trained) subjects. The arrow denotes the spatial frequency used during training. (C) Pre- and post-training contrast sensitivity functions at the trained location and measured through the trained eye in Group 2 (global motion-trained) subjects. (D) Contrast sensitivity functions measured through the left eye in Group 3 (untrained) subjects before and after a 10-day interval, during which no training was administered. Solid lines and black symbols correspond to pre-test values across each group; dashed lines and white symbols represent post-test values. Light gray shading denotes spatial frequencies for which post-hoc t tests revealed significant differences between pre- and post-testing performance.
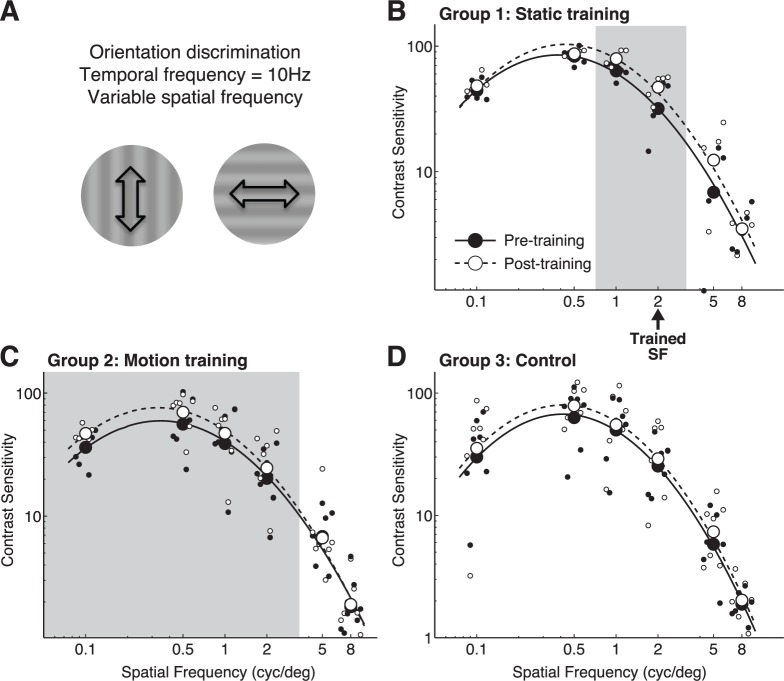
Figure 4.
CS versus spatial frequency for orientation discrimination of drifting gratings. (A) Representation of stimuli used for testing. (B) Pre- and post-training contrast sensitivity functions at the trained location and measured through the trained eye in Group 1 (orientation trained) subjects. The arrow denotes the spatial frequency used during training in this group. (C) Pre- and post-training contrast sensitivity functions at the trained location and measured through the trained eye in Group 2 (global motion-trained) subjects. (D) Contrast sensitivity functions measured through the left eye in Group 3 (untrained) subjects before and after a 10-day interval, during which no training was administered. Solid lines and black symbols correspond to pre-test values across each group; dashed lines and white symbols represent post-test values. Light gray shading denotes spatial frequencies for which post-hoc t tests revealed significant differences between pre- and post-testing performance.
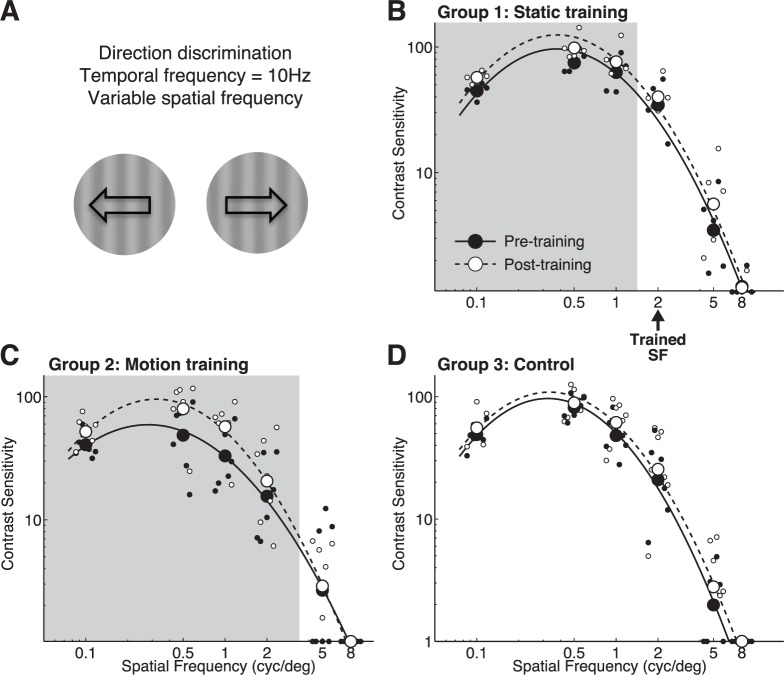
Figure 5.
CS versus spatial frequency for direction discrimination of drifting gratings. (A) Representation of stimuli used for testing. (B) Pre- and post-training contrast sensitivity functions at the trained location and measured through the trained eye in Group 1 (orientation trained) subjects. The arrow denotes the spatial frequency used during training. (C) Pre- and post-training contrast sensitivity functions at the trained location and measured through the trained eye in Group 2 (global motion-trained) subjects. (D) Contrast sensitivity functions measured through the left eye in Group 3 (untrained) subjects before and after a 10-day interval, during which no training was administered. Solid lines and black symbols correspond to pre-test values across each group; dashed lines and white symbols represent post-test values. Light gray shading denotes spatial frequencies for which post-hoc t tests revealed significant differences between pre- and post-testing performance.
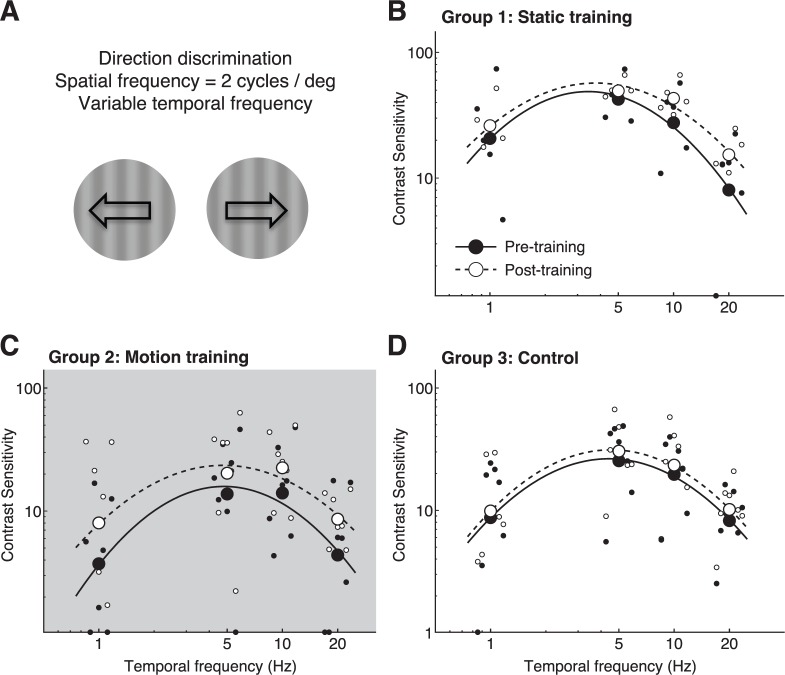
Figure 6.
CS versus temporal frequency for direction discrimination of drifting gratings. (A) Representation of stimuli used for testing. (B) Pre- and post-training contrast sensitivity functions at the trained location and measured through the trained eye in Group 1 (orientation trained) subjects. The arrow denotes the spatial frequency used during training. (C) Pre- and post-training contrast sensitivity functions at the trained location and measured through the trained eye in Group 2 (global motion-trained) subjects. (D) Contrast sensitivity functions measured through the left eye in Group 3 (untrained) subjects before and after a 10-day interval, during which no training was administered. Solid lines and black symbols correspond to pre-test values across each group; dashed lines and white symbols represent post-test values. Light gray shading denotes temporal frequencies for which post-hoc t tests revealed significant differences between pre- and post-testing performance.
Figure 2.
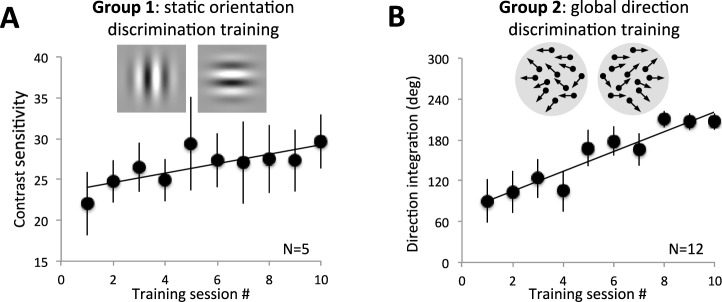
Effect of training on performance of the trained tasks. (A) Plot of contrast sensitivity averaged across all five subjects in Group 1 who trained on the static orientation discrimination task. Each data point represents the mean ± SEM contrast sensitivity attained on each day of training. Note progressive improvement in performance across the 10 days of training. (B) Plot of direction integration performance for the 12 participants in Group 2 who trained on the global direction discrimination task. A progressive improvement was also observed across the 10 training sessions.
Figure 7.
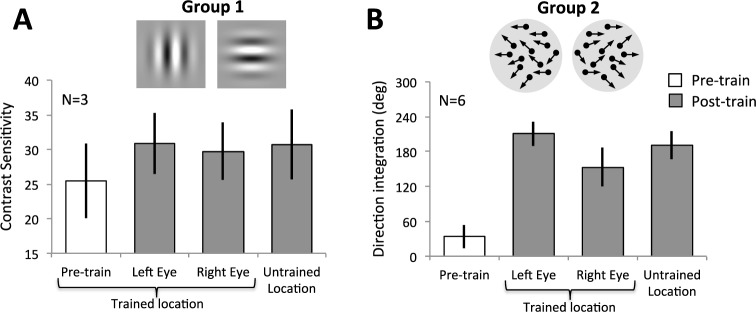
Transfer of learning to untrained eye and location. (A) Depiction of pretraining contrast sensitivity (white bar) in a subset of Group 1 subjects at the trained location, together with post-training performance (gray bars) at the trained location through the trained eye (left eye), the untrained right eye and at an untrained location. (B) Depiction of pre-training direction integration performance (white bar) in a subset of Group 2 subjects, averaged across the trained location, the untrained location, and the untrained eye. Post-training performance (gray bars) was significantly improved at the trained location through the trained (left) eye, the untrained right eye and at an untrained location. All values are means ± SEM.
Results
Effects of training on performance of the trained task
We found that training on a static, orientation discrimination task (Group 1) gradually improved CS (Figure 2A). At the end of training, mean ± SEM CS was significantly greater (31 ± 3) than pretraining (23 ± 4; two-tailed, paired t test, t4 = −3.6, p = 0.023). Similarly, subjects trained on a global direction discrimination task with high-contrast, random dot stimuli (Group 2) exhibited a gradual improvement in direction integration performance (Figure 2B). Direction range thresholds changed from 49 ± 19 degrees prior to training to 203 ± 12 degrees after training (two-tailed, paired t test, t11 = −6.51, p < 0.0001). Both of these results were expected, and simply showed that our training paradigm was effective at eliciting perceptual learning.
Effects of training on contrast sensitivity
Orientation discrimination tasks
When CS for static orientation discrimination was measured at the trained location, and through the trained eye, Group 1 subjects, who were trained on this task, exhibited increased gain (p < 0.0001), a higher center spatial frequency (p = 0.0296) and narrower SF bandwidth (p = 0.0006; Figure 3A, B, see Table 1 for a summary of results). The significant CS changes were largely around the trained spatial frequency (Figure 3B). No such improvements were seen in untrained controls (Group 3; Figure 3D, Table 1) or in subjects trained on the global direction discrimination task (Group 2; Figure 3C, Table 1).
Table 1.
A summary of statistically significant changes between pre- and post-tests for gain, center frequency, and bandwidth parameters of measured CSFs at trained locations. White: no significant difference; light gray: p < 0.05; medium gray: p < 0.01; black: p < 0.001. CS: contrast sensitivity, SF: spatial frequency, TF: temporal frequency, Ctr. Freq.: center frequency.
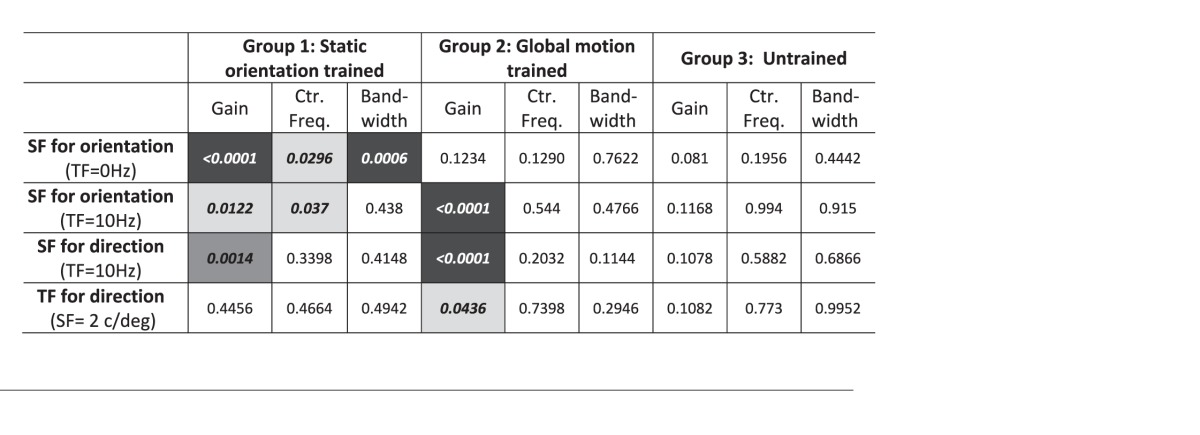
When CS was measured for discriminating the orientation of drifting sine wave gratings (Figure 4A), Group 1 subjects exhibited both a gain change (p = 0.0122) and a shift of the center spatial frequency towards higher values (p = 0.037), with greatest CS improvements for 1 and 2 cycles/° (i.e., around the trained SF, Figure 4B, Table 1).
No significant changes in bandwidth were observed. Group 2 subjects (trained on global direction discrimination; Figure 4B, Table 1) also exhibited a change in gain on this task (p < 0.0001), but increased CS at lower SFs (0.1 to 2 cycles/°; Figure 4B) than for Group 1 subjects. The net change in CSF gain from pre-testing to post-testing was comparable in Groups 1 and 2. Untrained, Group 3 subjects exhibited no significant changes in CSFs (Figure 4D, Table 1).
Direction discrimination tasks
Group 2 subjects were the only subjects trained explicitly on direction discrimination, using a random dot stimulus that was considerably different from stimuli used to measure CS. They exhibited the largest changes in CS when asked to discriminate the direction of drifting sinewave gratings (Figure 5A). Bootstrap analysis revealed an increase in gain (Table 1, p < 0.0001) driven mostly by large sensitivity improvements at lower SFs (Figure 5C). Group 1 subjects, who were trained to discriminate orientation of static targets, also exhibited increased gain post-training (Table 1, p = 0.0014) in their CSF for direction, driven largely by increased sensitivity at low SFs (Figure 5B). Only untrained Group 3 subjects exhibited no significant changes in CSF parameters (Table 1).
Finally, when discriminating direction of 2 cycles/° gratings with variable TFs (i.e., drift rates; Figure 6A), Group 1 and 3 subjects showed no significant changes in gain, center spatial frequency or CSF bandwidth (Table 1; Figures 6B, C). Only Group 2 subjects (trained to discriminate global motion direction) exhibited a significant increase in gain (Table 1, p = 0.0436), with improved CS at all tested TFs (Figure 6C). Moreover, Group 1 results are numerically similar to those of the untrained Group 3, with both groups showing similarly small, nonsignificant improvements. It is possible that with a much larger sample size, these differences could become significant. However, we speculate that these changes are driven by repeated CS testing.
Transfer to untrained visual field locations and eyes
As a secondary objective, we assessed the transfer of learning to untrained visual field locations and the untrained eye in three Group 1 and six Group 2 subjects. Pre-training, direction range performance in Group 2 subjects was comparably poor across left and right eyes, and visual field locations tested, F(2, 10) = 1.05, p = 0.38. Given the larger number of trials needed for CS measurements, pre-training data was only collected at the visual field location to be trained in Group 1 subjects. Given the results obtained in Group 2 subjects, we felt it safe to assume that pre-training CS would be similar through both eyes, and at equivalent locations in the upper as well as lower visual quadrant. Thus, for the CS analyses described below, we used pre-training data collected at the trained location as pretraining data for the other two conditions (untrained eye at the trained location and untrained location through the trained eye).
Following perceptual training in both groups, we found similarly improved performance for the trained configurations (trained eye and trained location) and for the untrained configurations (untrained eye at the trained location, and untrained location through the trained eye; Figure 7).
Specifically, in Group 1 (Figure 7A), we found a significant effect of perceptual training, F(1, 2) = 20.3, p = 0.046, but no main effect of condition (trained eye and location, untrained location, untrained eye; F(2, 4) = 0.26, p = 0.78) and no significant interaction between training and condition, F(2, 4) = 0.26, p = 0.78. In Group 2, where pre-training data was collected for all individual conditions (trained eye and location, untrained location, untrained eye), the results were qualitatively the same as in Group 1 (Figure 7B). We found a significant effect of training, F(1, 5) = 58.7, p = 0.0006, but no main effect of condition, F(2, 10) = 3.1, p = 0.089, and no significant interaction between training and condition, F(2,10) = 0.15, p = 0.86. In summary, there was significant post-training improvement in all conditions. Specifically, following training at one location through one eye, improvement occurred similarly at an untrained location, and through the untrained eye, as it did at the trained location through the trained eye.
Discussion
The present experiments showed that CS improvements occur in visually-intact individuals following very different forms of visual training. Specifically, CS improvements occurred even when training did not specifically target (or vary) luminance contrast. However, while learning of the trained tasks transferred across eyes and locations, improvements in CS were nevertheless biased for low-level features of the trained stimuli and tasks, suggesting fine-tuning of trained (rather than just exposed) neural circuits.
Possible mechanisms of CS improvements following visual training
Why should CS improve following training that specifically modulates it (as in Group 1), as well as training that does not (as in Group 2)? One possibility is that difficult training, where subjects spend significant amounts of time close to threshold (which occurred in both of Groups 1 and 2), induces a general improvement in visual processing by decreasing internal noise and/or improving the system's ability to extract relevant signals from externally noisy stimuli (Dosher & Lu, 1998; Lu & Dosher, 1999).
However, while CS was increased in all trained subjects, different training groups exhibited subtle advantages for different CS tests. Group 1 subjects saw their most pronounced improvements on CSFs measured with an orientation discrimination task, and stationary stimuli with SF of 1 to 2 cycles/°—parameters close to those used during training. When CSFs were measured with drifting gratings post-training, most improvements in Group 1 were seen for the orientation discrimination version of the task. When targets flickered, there was no increase in CS. Thus, training to discriminate the orientation of stationary, nonflickering Gabors of decreasing luminance contrast likely forced subjects to pay closer attention to orientation and luminance contrast. When these features were encountered in subsequent tasks, an improvement in CS was observed, even when the stimulus was a drifting grating. However, if the stimulus changed to a drifting grating and the task changed to direction discrimination, CS improvements were less pronounced. While such “preference” of learning for features trained may be taken to signify mediation by early visual circuits (such as those in V1), this cannot be the whole story. Indeed, the CS improvements were also evidenced through the untrained eye and at an untrained location in a different visual quadrant, about 10° away (center to center distance) from the trained location (Figure 7).
An accumulating literature shows that double-training, with a second, irrelevant task, and/or passive exposure to a second location without training, can overcome the location specificity of visual discrimination tasks (Deveau et al., 2014; Xiao et al., 2008; Zhang et al., 2010; Zhang, Xiao, Klein, Levi, & Yu, 2010). In the present study, Groups 1 and 2 underwent formal training, involving repetitive task performance with tracked progression and feedback on every trial. In contrast, Group 3 underwent only “exposure,” which involved single session testing done with only enough trials to get a reliable measure of the subject's performance thresholds. The results obtained in Group 3 subjects show that simple exposure to the entire battery of CS tests was not sufficient to generate the level of improvement exhibited by trained subjects. Instead, CS improvements likely resulted from both training and exposure. Solgi and colleagues suggested that when subjects are trained at one location, prior exposure to a second visual field location may trigger “self-organization of connections” from high-level “concept” neurons to lower-level neurons, thus improving performance at the second [untrained] location (Solgi, Liu, & Weng, 2013). However, in our experiment, what is most striking is a relative “preference” of these units for low spatial frequencies, and non-motion stimuli, in spite of subjects being exposed to different spatial and temporal frequencies, and motion tasks during pre-tests. Thus, Solgi and colleagues' self-organizational model can explain the location transfer, but not the stimulus/task specificity observed.
Dosher and Lu in their revised integrated reweighting theory (Dosher, Jeter, Liu, & Lu, 2013) also proposed that transfer of learning across locations may occur because there are high-level, location independent representations, which can be reweighted through training. Thus, one interpretation of the improved CS observed for discriminating static Gabors across visual field locations is that it likely involved changes in processing efficiency at multiple levels of the visual hierarchy (Ahissar & Hochstein, 2004), including up-regulation of location independent weights among higher level units. As long as these location independent units pool preferentially from units narrowly tuned for SF/TF/orientation, one might conceive a mechanism whereby location transfer may be seen together with feature “bias.” Another, likely (nonmutually exclusive) candidate mechanism is feature-based attention, which has been suggested to activate neurons with similar tuning properties in spatially unattended locations represented in multiple, earlier visual areas, through feedback from higher-level brain areas (Cohen & Maunsell, 2011; Martinez-Trujillo & Treue, 2004; McAdams & Maunsell, 2000).
Impact of global motion training with a single contrast
Group 2 subjects, trained with moving random dots showed increased gain on all CSFs measured with drifting gratings, regardless of task (orientation or direction discrimination). The fact that CS improved at all after global motion training is impressive by itself, given that in the training stimulus, luminance contrast was high and stable. Moreover, the changes in gain for the CSFs measured suggested that improvements were broad across spatial and temporal frequencies. This is not surprising given that random dot stimuli have relatively broad spatial frequency content (Pasternak, Tompkins, & Olson, 1995). And if the component dots move at the same speed (10°/s) but contain a range of SFs, it follows that the training stimulus also exposes subjects to a range of temporal frequencies. However, Group 2 subjects exhibited no improvement in CS for discriminating orientation of static, nonflickering Gabors. In essence, there was no transfer to static, nonflickering stimuli. These results indicate once again that even for tasks in which CS is not explicitly trained, gains of function are still observed. And while there is generalizability of this gain of function across untrained, peripheral visual field locations (suggesting the involvement of higher-level visual circuits), the greatest gains in sensitivity still occur for fundamental features of the training stimulus (rather than for features of the pre-test, “exposure” stimuli).
Finally, as for Gabor trained subjects, the improvements in direction range thresholds elicited by training in Group 2 subjects were also observed through the untrained, right eye, and at an untrained visual field location in the lower hemifield of vision. The generalizability of training-induced performance improvements across peripheral visual field locations is consistent with observations from other groups (Hung & Seitz, 2014; Jeter, Dosher, Petrov, & Lu, 2009; Zhang, Zhang, & Li, 2013; Zhang et al., 2010). It could also be consistent with reweighting theories (Dosher & Lu, 1999; Dosher et al., 2013; Mollon & Danilova, 1996; Petrov, Dosher, & Lu, 2005; Yu et al., 2004) if the most strongly activated neurons whose response are reweighted are actually specific to certain stimulus features.
Conclusions
Luminance contrast is among the most basic and essential elements of visual information processing. The present study ascertained that CS improvements following visual training were not just a property of damaged or abnormal visual systems, they also occur in visually-intact subjects, whether contrast was explicitly trained or not. This suggests that improved CS may be a natural consequence of many forms of visual training, likely reflecting increased visual processing efficiency at multiple levels of the visual hierarchy. However, all improvements bore the “stamp” of basic attributes present in the training stimuli. This suggests an important role of low level visual cortical processing in this phenomenon and may explain why patients with either miswired (as in amblyopia) or damaged (as in cortical blindness) primary visual areas exhibit relatively broad transfer of learning to untrained stimuli and tasks.
Supplementary Material
Acknowledgments
This work was supported by NIH NEI grants to KRH (EY021209) and DT (EY019295), a Collaborative Grant from the Schmitt Program on Integrative Brain Research (to KRH), a Center for Visual Science (CVS) summer undergraduate fellowship to AL (sponsored by NEI training grant T32 EY007125 to the CVS), an NEI Center Core grant to the CVS (P30 EY001319), and an unrestricted grant from the Research to Prevent Blindness Foundation (RPB) to the Flaum Eye Institute. KRH is an RPB Lew R. Wasserman Merit Award recipient.
Commercial relationships: none.
Corresponding author: Krystel R. Huxlin.
Email: huxlin@cvs.rochester.edu.
Address: Flaum Eye Institute, University of Rochester, Rochester, NY, USA.
Contributor Information
Aaron Levi, Email: alevi813@gmail.com.
Danielle Shaked, Email: danielle.shaked1@gmail.com.
Duje Tadin, Email: duje@cvs.rochester.edu.
Krystel R. Huxlin, Email: huxlin@cvs.rochester.edu.
References
- Adini Y.,, Sagi D.,, Tsodyks M. V. (2002). Context-enabled learning in the human visual system. Nature, 415 (6873), 790–793. [DOI] [PubMed] [Google Scholar]
- Adini Y.,, Wilkonsky A.,, Haspel R.,, Tsodyks M.,, Sagi D. (2004). Perceptual learning in contrast discrimination: The effect of contrast uncertainty. Journal of Vision, 4(12): 2, 993–1005, doi:10.1167/4.12.2. [PubMed] [Article] [DOI] [PubMed] [Google Scholar]
- Ahissar M.,, Hochstein S. (2004). The reverse hierarchy theory of visual perceptual learning. Trends in Cognitive Sciences, 8, 457–464. [DOI] [PubMed] [Google Scholar]
- Ball K.,, Sekuler R. (1982). A specific and enduring improvement in visual motion discrimination. Science, 218 (4573), 697–698. [DOI] [PubMed] [Google Scholar]
- Campbell F. W. (1983). Why do we measure contrast sensitivity? Behavioral Brain Research, 10 (1), 87–97. [DOI] [PubMed] [Google Scholar]
- Campbell F. W.,, Green D. G. (1965). Optical and retinal factors affecting visual resolution. Journal of Physiology, 181, 576–593. [DOI] [PMC free article] [PubMed] [Google Scholar]
- Campbell F. W.,, Robson J. G. (1968). Application of Fourier analysis to the visibility of gratings. Journal of Physiology, 197, 551–566. [DOI] [PMC free article] [PubMed] [Google Scholar]
- Cohen M. R.,, Maunsell J. H. R. (2011). Using neuronal populations to study the mechanisms underlying spatial and feature attention. Neuron, 70 (6), 1192–1204. [DOI] [PMC free article] [PubMed] [Google Scholar]
- Das A.,, Tadin D.,, Huxlin K. R. (2014). Beyond blindsight: properties of visual relearning in cortically blind fields. Journal of Neuroscience, 34 (35), 11652–11664. [DOI] [PMC free article] [PubMed] [Google Scholar]
- Deveau J.,, Lovcik G.,, Seitz A. R. (2014). Broad-based visual benefits from training with an integrated perceptual-learning video game. Vision Research, 99, 134–140. [DOI] [PMC free article] [PubMed] [Google Scholar]
- Deveau J.,, Seitz A. R. (2014). Applying perceptual learning to achieve practical changes in vision. Frontiers in Psychology, 4, 1–6. [DOI] [PMC free article] [PubMed] [Google Scholar]
- Dorais A.,, Sagi D. (1997). Contrast masking effects change with practice. Vision Research, 37 (13), 1725–1733. [DOI] [PubMed] [Google Scholar]
- Dosher B.,, Lu Z. (1999). Mechanisms of perceptual learning. Vision Research, 39, 3197–3221. [DOI] [PubMed] [Google Scholar]
- Dosher B. A.,, Jeter P. E.,, Liu J.,, Lu Z. L. (2013). An integrated reweighting theory of perceptual learning. Proceedings of the National Academy of Sciences, USA, 110 (33), 13678–13683. [DOI] [PMC free article] [PubMed] [Google Scholar]
- Dosher B. A.,, Lu Z. I. (1998). Perceptual learning reflects external noise filtering and internal noise reduction through channel reweighting. Proceedings of the National Academy of Sciences, USA, 95, 13988–13993. [DOI] [PMC free article] [PubMed] [Google Scholar]
- Fahle M. (1997). Specificity of learning curvature, orientation, and vernier discriminations. Vision Research, 37 (14), 1885–1895. [DOI] [PubMed] [Google Scholar]
- Fiorentini A.,, Berardi N. (1980). Perceptual learning specific for orientation and spatial frequency. Nature, 287, 43–44. [DOI] [PubMed] [Google Scholar]
- Huang C.-B.,, Zhou Y.,, Lu Z. L. (2008). Broad bandwidth of perceptual learning in the visual system of adults with anisometric amblyopia. Proceedings of the National Academy of Sciences, USA, 105 (10), 4068–4073. [DOI] [PMC free article] [PubMed] [Google Scholar]
- Hung S.-C.,, Seitz A. R. (2014). Prolonged training at threshold promotes robust retinotopic specificity in perceptual learning. Journal of Neuroscience, 34 (25), 8423–8431. [DOI] [PMC free article] [PubMed] [Google Scholar]
- Huxlin K. R.,, Riley M. E.,, Martin T.,, Kelly K. N.,, Friedman D. I.,, Burgin W. S.,, Hayhoe M. (2009). Perceptual re-learning of complex visual motion after V1 damage in humans. Journal of Neuroscience, 29 (13), 3981–3991. [DOI] [PMC free article] [PubMed] [Google Scholar]
- Jeter P. E.,, Dosher B. A.,, Petrov A.,, Lu Z.-L. (2009). Task precision at transfer determines specificity of perceptual learning. Journal of Vision, 9(3): 1, 1–13, doi:10.1167/9.3.1. [PubMed] [Article] [DOI] [PMC free article] [PubMed] [Google Scholar]
- Karni A.,, Sagi D. (1991). Where practice makes perfect in texture discrimination: evidence for primary visual cortex plasticity. Proceedings of the National Academy of Sciences, USA, 88, 4966. [DOI] [PMC free article] [PubMed] [Google Scholar]
- Kelly D. H. (1975). Spatial frequency selectivity in the retina. Vision Research, 15, 665–672. [DOI] [PubMed] [Google Scholar]
- Kelly D. H. (1979). Motion and vision. II. Stabilization spatio-temporal threshold surface. Journal of the Optical Society of America, 69, 1340–1345. [DOI] [PubMed] [Google Scholar]
- Lesmes L. A.,, Lu Z. L.,, Baek J.,, Albright T. D. (2010). Bayesian adaptive estimation of the contrast sensitivity function: The quick CSF method. Journal of Vision, 10(3): 17, 1–21, doi:10.1167/10.3.17. [PubMed] [Article] [DOI] [PMC free article] [PubMed] [Google Scholar]
- Lu Z. L.,, Dosher B. (1999). Characterizing human perceptual inefficiencies with equivalent internal noise. Journal of the Optical Society of America A, 16, 764–778. [DOI] [PubMed] [Google Scholar]
- Martinez-Trujillo J. C.,, Treue S. (2004). Feature-based attention increases the selectivity of population responses in primate visual cortex. Current Biology, 14 (9), 744–751. [DOI] [PubMed] [Google Scholar]
- McAdams C. J.,, Maunsell J. H. (2000). Attention to both space and feature modulates neuronal responses in macaque area V4. Journal of Neurophysiology, 83 (3), 1751–1755. [DOI] [PubMed] [Google Scholar]
- McKee S. P.,, Westheimer G. (1978). Improvement in vernier acuity with practice. Perception and Psychophysics, 24 (3), 258–262. [DOI] [PubMed] [Google Scholar]
- Mollon J. D.,, Danilova M. V. (1996). Three remarks on perceptual learning. Spatial Vision, 10 (1), 51–58. [DOI] [PubMed] [Google Scholar]
- Pasternak T.,, Tompkins J.,, Olson C. R. (1995). The role of striate cortex in visual function of the cat. Journal of Neuroscience, 15 (3 Pt 1), 1940–1950. [DOI] [PMC free article] [PubMed] [Google Scholar]
- Petrov A. A.,, Dosher B. A.,, Lu Z. L. (2005). The dynamics of perceptual learning: An incremental reweighting model. Psychological Review, 112 (4), 715–743. [DOI] [PubMed] [Google Scholar]
- Roufs J. A. (1972). Dynamic properties of vision—1. Experimental relationship between flicker and flash thresholds. Vision Research, 12, 261–278. [DOI] [PubMed] [Google Scholar]
- Sahraie A.,, Trevethan C. T.,, MacLeod M. J.,, Murray A. D.,, Olson J. A.,, Weiskrantz L. (2006). Increased sensitivity after repeated stimulation of residual spatial channels in blindsight. Proceedings of the National Academy of Sciences, USA, 103 (40), 14971–14976. [DOI] [PMC free article] [PubMed] [Google Scholar]
- Schoups A.,, Vogels R.,, Orban G. A. (1995). Human perceptual learning in identifying the oblique orientation: Retinotopy, orientation specificity and monocularity. Journal of Physiology, 483, 797–810. [DOI] [PMC free article] [PubMed] [Google Scholar]
- Solgi M.,, Liu T.,, Weng J. (2013). A computational developmental model for specificity and transfer in perceptual learning. Journal of Vision, 13(1): 7, 1–23, doi:10.1167/13.1.7. [PubMed] [Article] [DOI] [PubMed] [Google Scholar]
- Sowden P. T.,, Rose D.,, Davies I. R. L. (2002). Perceptual learning of luminance contrast detection: Specific for spatial frequency and retinal location but not orientation. Vision Research, 42 (10), 1249–1258. [DOI] [PubMed] [Google Scholar]
- Watson A. B.,, Ahumada A. J. (2005). A standard model for foveal detection of spatial contrast. Journal of Vision, 5(9): 6, 717–740, doi:10.1167/5.9.6. [PubMed] [Article] [DOI] [PubMed] [Google Scholar]
- Xiao L. Q.,, Zhang J. Y.,, Wang R.,, Klein S. A.,, Levi D. M.,, Yu C. (2008). Complete transfer of perceptual learning across retinal locations enabled by double training. Current Biology, 18, 1922–1926. [DOI] [PMC free article] [PubMed] [Google Scholar]
- Yu C.,, Klein S. A.,, Levi D. M. (2004). Perceptual learning in contrast discrimination and the (minimal) role of context. Journal of Vision, 4(3): 4, 169–182, doi:10.1167/4.3.4. [PubMed] [Article] [DOI] [PubMed] [Google Scholar]
- Zhang E.,, Zhang G. L.,, Li W. (2013). Spatiotopic perceptual learning mediated by retinotopic processing and attentional remapping. European Journal of Neuroscience, 38 (12), 3758–3767. [DOI] [PubMed] [Google Scholar]
- Zhang J.-Y.,, Kuai S.-G.,, Xiao L.-Q.,, Klein S. A.,, Levi D. M.,, Yu C. (2008). Stimulus coding rules for perceptual learning. PLoS Biology, 6 (8), e197. [DOI] [PMC free article] [PubMed] [Google Scholar]
- Zhang J. Y.,, Zhang G. L.,, Xiao L. Q.,, Klein S. A.,, Levi D. M.,, Yu C. (2010). Rule-based learning explains visual perceptual learning and its specificity and transfer. Journal of Neuroscience, 30 (37), 12323–12328. [DOI] [PMC free article] [PubMed] [Google Scholar]
- Zhang T.,, Xiao L. Q.,, Klein S. A.,, Levi D. M.,, Yu C. (2010). Decoupling location specificity from perceptual learning of orientation discrimination. Vision Research, 50 (4), 368–374. doi:10.1016/j.visres.2009.08.024 [DOI] [PubMed] [Google Scholar]
- Zhou Y.,, Huang C.,, Xu P.,, Tao L.,, Qiu Z.,, Li X.,, Lu Z.-L. (2006). Perceptual learning improves contrast sensitivity and visual acuity in adults with anisometropic amblyopia. Vision Research, 6, 739–750. [DOI] [PubMed] [Google Scholar]
Associated Data
This section collects any data citations, data availability statements, or supplementary materials included in this article.


