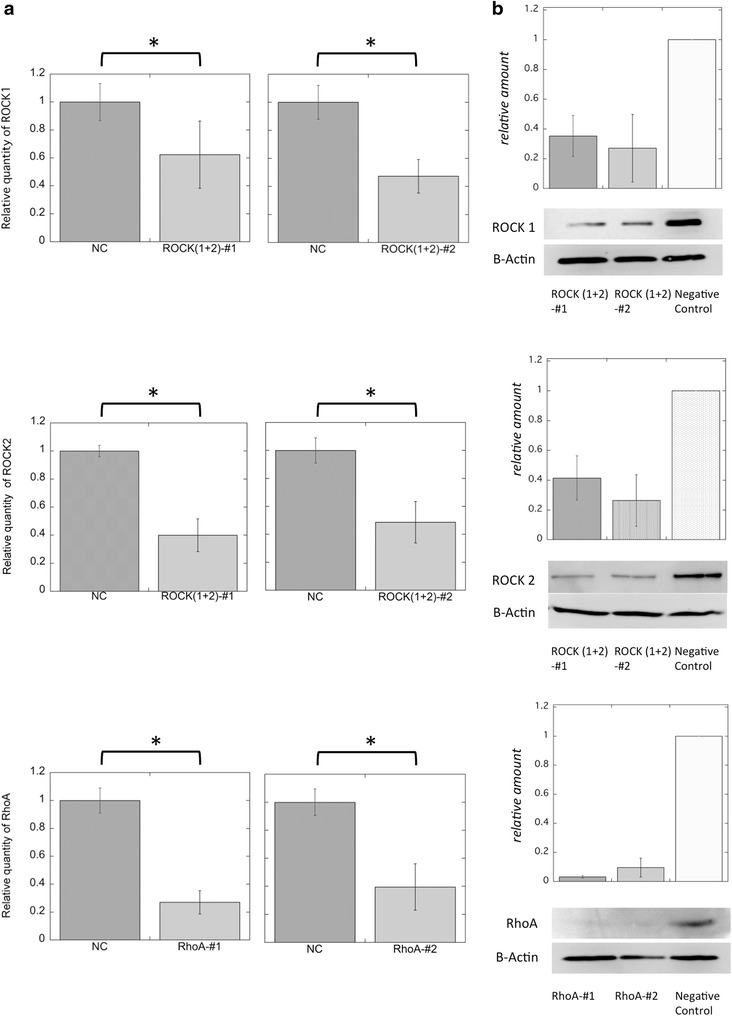
Fig. 4.

Efficiency of siRNAs targeting ROCKs and RhoA. a The effectiveness of each siRNA knockdown was evaluated by quantitative polymerase chain reaction analysis. The relative quantities of ROCK1, ROCK2, and RhoA mRNAs were compared between each experiment. Top ROCK1 expression was reduced to about 60 and 40 % that of the control using ROCKs-#1 or ROCKs#2 siRNAs. Middle Both combinations of ROCK siRNAs reduced ROCK2 mRNA levels to 40–50 % that of the control. Bottom Each RhoA siRNA reduced RhoA mRNA levels by about 40 % that of the negative control. Data represent the mean ± SEM of 3 independent experiments. NC negative control. Each graph indicates significant difference (*p < 0.01, n = 3). b Immunoblots showing protein expression of ROCK1, ROCK2, RhoA, and β-actin following the incubation of TE-10 cells with siRNA for each target. The expression of each protein was well suppressed, even after 24 h after RNAi treatment. Bars indicate the mean ± SEM of experiments performed in duplicate (RhoA) or triplicate (ROCKs)
