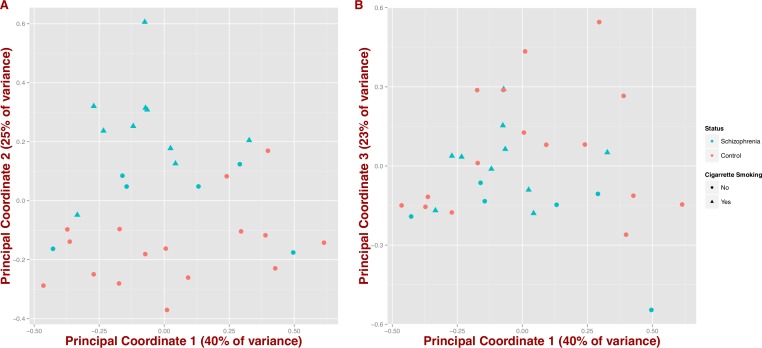
Figure 2. Covariation of community structure shows that diversity patterns of samples correlate with disease status, i.e., schizophrenia and controls, and potentially with smoking (at the genus level).
Points represent principal coordinate analysis (PCoA loadings) on Jensen–Shannon Diversity distances. Principal coordinates 1 and 2 in (A) (65% of variance) and principal coordinates 1 and 3 in (B) (63% of variance).

