Abstract
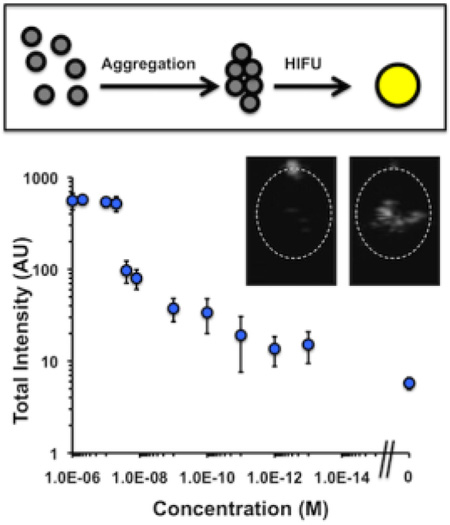
Superheated perfluorocarbon nanodroplets exhibit promise as sensitive acoustic biosensors. Aggregation of biotin-decorated lipid-shelled droplets by streptavidin greatly increased the yield of bubbles formed by ultrasound-induced vaporization. Streptavidin was sensed down to 100 fM, with differentiable signal appearing in as little as two minutes, using a scalable assay without washing, processing, or development steps.
Keywords: Biomedical Applications, Colloids, Self-Assembly, Sensors/Biosensors, Stimuli-Responsive Materials
Graphical Abstract
The development of new materials that can sense or quantify levels of biomarkers within specific regions of interest in vivo would represent a substantial advance in applications of personalized medicine such as monitoring the aggressiveness of solid tumors or growth of arterial plaque. While many contrast agents can be functionalized with ligands that bind membrane-bound targets, fewer agents are able to sense soluble biomarkers such as Prostate Specific Antigen or Vascular Endothelial Growth Factor. Some profluorophores have been designed to react with endogenous enzymes or reactive oxygen species to induce a chemical or conformational change that increases photoluminescence.[1] Other examples include iron oxide nanoparticles that change their magnetic relaxivity upon self-assembly, which can be used for both in vivo imaging and in vitro biosensing.[2] In each of these cases, the modest difference between signal generated by activated contrast agents and background limits their ability to sense small concentrations of nonreactive or enzymatic biomarkers. This work instead utilizes the specific acoustic signature of stable gas bodies in aqueous media that allows microbubbles to act as extremely potent contrast agents for ultrasound imaging. While sound is scattered elastically at the interface of most materials, a gas bubble in resonance with an ultrasound wave will undergo nonlinear expansion and contraction to generate harmonic and subharmonic frequencies.[3, 4] Specific ultrasound imaging pulse programs such as cadence contrast pulse sequencing (CPS, Siemens) have been designed to accentuate nonlinear signal while essentially removing elastic scatter,[5] resulting in microbubble detection limits of 10 aM[6] or less[7] with spatial resolution of ~0.1–1 mm. This property has led to development of polymer and lipid-stabilized microbubbles as ultrasound contrast agents for intravascular imaging.[8] Since size oscillations by the bubble are crucial for generating the highly-specific nonlinear echoes,[4] biosensing capabilities can be conferred onto a bubble by tuning its compressibility in response to challenge with a biomolecular analyte. In previous research, for example, we designed microbubbles that could change the mechanical properties of their encapsulating shell, which allowed sensing of thrombin in the vicinity of acute blood clots.[6, 9] Other examples include use of bubbles as labels for surface-mediated assays, incorporation of alkaline phosphatase and lysozyme into nanoparticle-shelled bubbles, and labeling of stem cells or bacteria.[10]
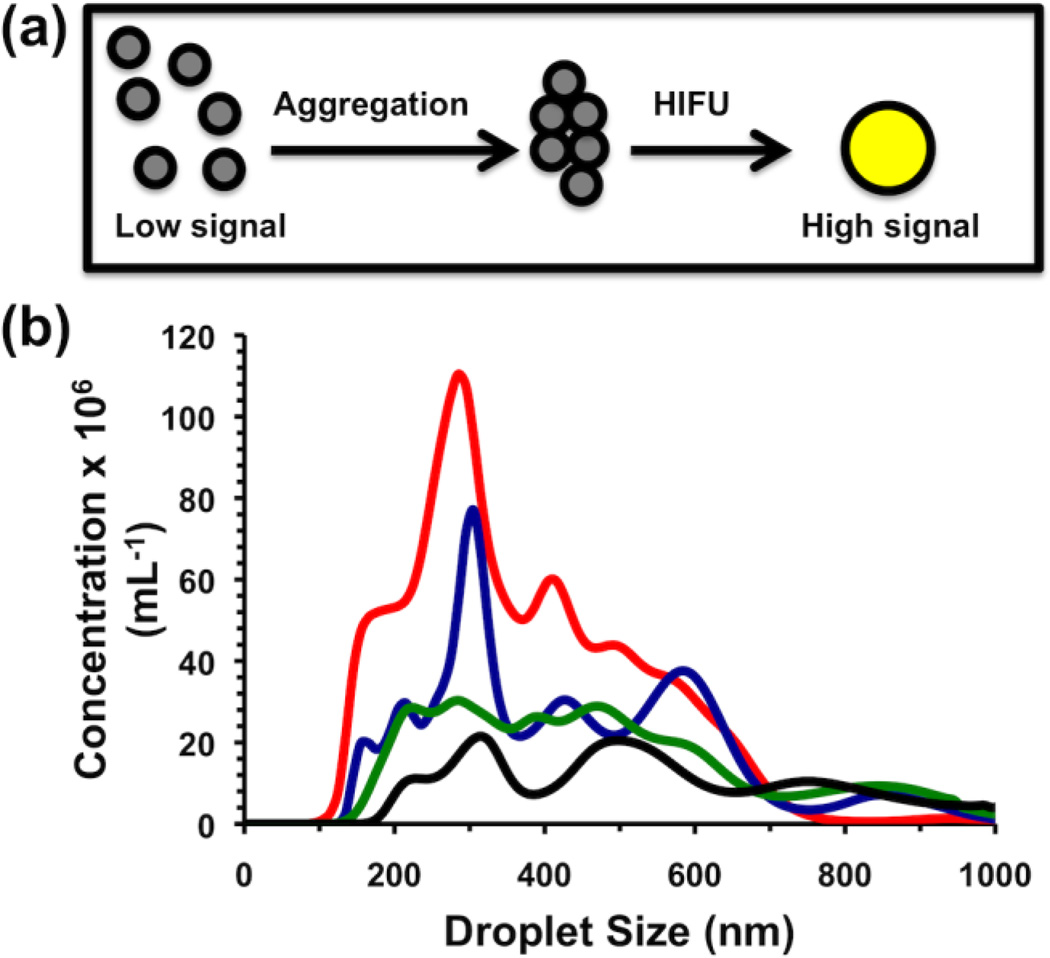
Thus, an even greater change in ultrasound contrast may be obtained by converting an incompressible liquid droplet into a compressible microbubble. For this reason, “phase-shift emulsions,” or superheated liquid nanodroplets that can be converted into gas bodies in vivo, represent a potentially more powerful development in ultrasound contrast technology.[11, 12] Prior to vaporization, liquid nanodroplets exhibit far greater stability in vivo than bubbles and can be formulated down to less than 400 nm in diameter for improved extravasation into tissue. While in their liquid form droplets possess poor acoustic contrast properties owing to their incompressibility, droplets with an internal phase of sufficiently high vapor pressure may be vaporized in situ using High Intensity Focused Ultrasound (HIFU), resulting in the generation of high-contrast microbubbles in situ.[13, 14, 15] The effect of HIFU parameters and nanodroplet properties on acoustic nanodroplet vaporization has been the subject of several studies, and generally as mean nanodroplet size increases the peak HIFU pressure required to vaporize the nanodroplets decreases.[12, 14–17] Thus, we hypothesized that aggregating nanodroplets through biomolecular interactions might result in a decrease in HIFU vaporization threshold as well, thereby enhancing signal specifically after interaction with a biomarker of interest (Figure 1a).
Figure 1.
(a) Schematic of low-contrast droplet aggregation allowing vaporization to high contrast bubbles. (b) Size histogram of droplet diameter as measured by Nanoparticle Tracking Analysis. Shown are as-made (black), 200g-fractionated (green), 300g-fractionated (blue), and 400g-fractionated (red) droplets.
Results and Discussion
Because these nanodroplets were intended to sense small concentrations of analyte, initial studies focused on reducing background signal by non-aggregated nanodroplets. To prepare the nanodroplets, a lipid film consisting of DPPC, DSPE-PEG2000, and DSPE-PEG2000-biotin was reconstituted in tris-buffered saline (TBS) to form liposomes. The liposomes were mixed at 4 v/v% perfluorocarbon and probe sonicated to form the droplets. Anticipated sources of background signal would be from either (a) nanodroplets of insufficient stability that would vaporize in a sample holder, or (b) nanodroplets of size large enough to be vaporized prior to aggregation. For example, although perfluoropentane (PFP, Tbp ~ 29°C) is commonly used as a nanodroplet internal phase, the nanodroplets tended to form bubbles on the side of sample holders by eye, which increased background signal. Perfluorohexane (PFH, Tbp ~ 56°C) instead gave nanodroplets that were stable over the course of the experiments. To reduce the size dispersity of the nanodroplets, the as-made suspension was subjected to various centrifuge speeds from 200g to 400g to pellet and remove the largest fraction of nanodroplets, followed by characterization of the supernatants by Nanoparticle Tracking Analysis (Malvern).[18] Centrifugation of the as-made droplets at 400g gave the best reduction in mean diameter, from 609 nm to 368 nm (Table S1). Notably, the concentration of nanodroplets >800 nm in diameter were removed from the suspension almost entirely (Figure 1b).
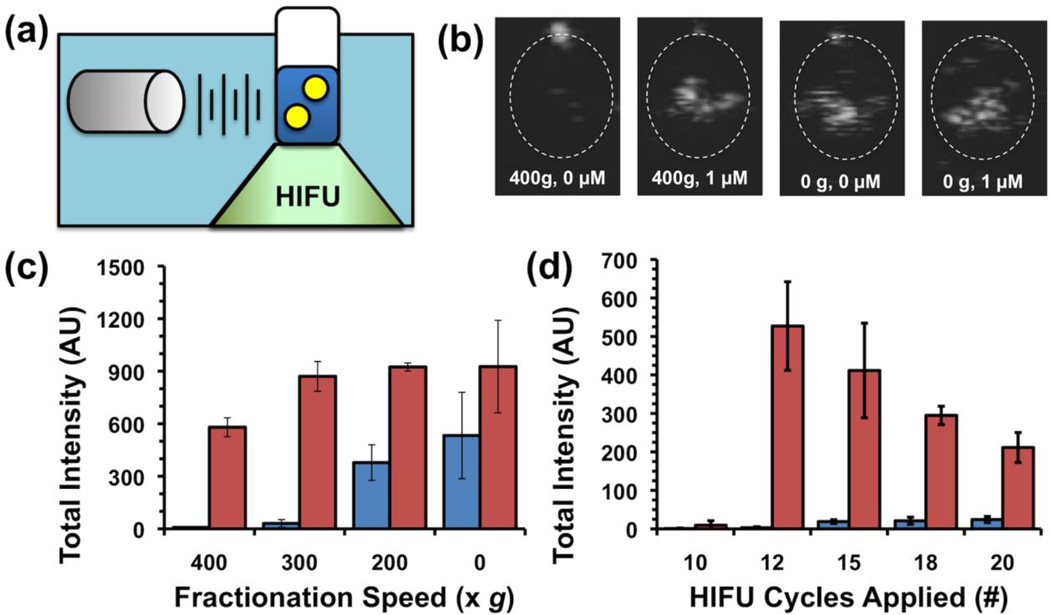
The ultrasound response of the nanodroplets was measured through continuous scanning at 1.5 MHz in CPS mode to highlight nonlinear, bubble-specific response.[5] Samples were placed in a plastic tube and submerged in a water tank containing a phased array scanning probe; movies were recorded and the integrated brightness in the sample was measured as captured signal (Figure 2a, Figure S1). Prior to exposure to HIFU, the sample was essentially dark within the walls of the tube. A HIFU transducer was aligned so that pulses would be focused into the center of the sample. Nanodroplets containing either 1 µM streptavidin or plain TBS buffer were subjected to different HIFU conditions in which a pulse packet of several sine waves was administered at a rate of 10 Hz. Non-aggregated nanodroplets showed little signal as expected, but after adding 1 µM streptavidin, administration of HIFU caused bright spots to appear in the image as a direct result of the vaporization (Figure 2b). While unfractionated droplets (0g) with 1 µM streptavidin exhibited a strong signal, the signal was also prominent with streptavidin as well; thus these samples only exhibited about a 2-fold enhancement (Figure 2c). By comparison, nanodroplets fractionated at 400g exhibited lower signal than unfractionated droplets; this decrease in signal may be explained by the disappearance of droplets greater than 800 nm, which are expected to provide a greater overall signal. However, the background signal dropped dramatically, producing a streptavidin-induced signal enhancement of about 77, and thus nanodroplets that had been fractionated at 400g were utilized for further experiments. As a control, nanodroplets with the same exterior composition but an interior phase of Neobee oil were subjected to the same conditions but showed no change in signal over baseline (Figure S2). Interestingly, the number of sine waves in each pulse packet had a profound effect on the vaporization of the nanodroplets. For non-aggregated nanodroplets, increasing the number of sine waves per pulse increased the output signal, though only slightly. For streptavidin-aggregated nanodroplets, a large difference in signal was observed between 10 cycles and 12 cycles, with a gradual decrease thereafter (Figure 2d). While we do not know why 12 cycles was specifically required for vaporization of PFH, additional HIFU pulses should destroy the bubbles that have been formed, leading to decreased signal.
Figure 2.
(a) Schematic of setup for measuring ultrasound signal from HIFU-vaporized droplets. (b) Representative still images taken from movies acquired during HIFU pulsing of droplet samples. From left to right: 400g-fractionated droplets with no streptavidin, 400g-fractionated droplets with 1 µM streptavidin, as-made droplets with no streptavidin, and as-made droplets with 1 µM streptavidin. (c,d) Integrated brightness from HIFU pulsing of droplet samples. Blue bars (left) indicate without streptavidin, red bars (right) indicate 1 µM streptavidin. Error bars = 1 SD; studies were run in at least triplicate. (c) Integrated brightness as function of fractionation conditions. (d) Integrated brightness as function of number of sine waves per pulse packet.
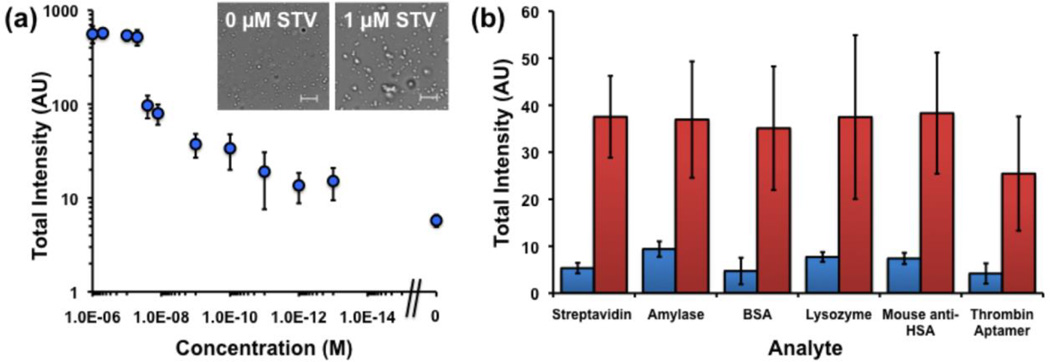
Next, 400g-fractionated PFH biotinylated nanodroplets were incubated with different concentrations of streptavidin from 1 µM down to 100 fM, as well as no streptavidin (Figure 3a). The signal response curve showed three major regions of response. At the highest streptavidin concentrations, from 1 µM to 100 nM, the signal appeared to be saturated. Bright field microscopy studies comparing 0 and 1 µM streptavidin concentrations showed the appearance of larger, higher order aggregates that most likely served as nucleation sites for the appearance of signal. Since these droplets would most likely vaporize together to produce very large bubbles, the resultant signal at these streptavidin concentrations was quite high. Concentrations in the range of 100 nM to 1 nM appear to correspond to the center of the S-curve. Using the measured nanodroplet concentration of 5×10¹² L−1 (NTA), the mean radius of the droplets as 200 nm, the area per lipid as 0.5 nm2, and the ratio of biotin to lipid as 1:100, each droplet has an average of about 10,000 biotin molecules per droplet and the total biotin concentration is approximately 100 nM. Thus the greatest difference in signal was observed at concentrations near and below 100 nM, which corresponded to the greatest difference in aggregate structure as a function of streptavidin concentration. Finally, at concentrations between 1 nM and 100 fM, the number of biotin molecules exceeds the number of streptavidin molecules, and so fewer numbers of smaller order aggregates (dimers or trimers) are formed. This reasoning would explain the observation that the two lowest concentrations tested, 1 pM and 100 fM show essentially the same signal. However, the measured mean signal at 100 fM is still distinguishably larger than the noise floor. Moreover, the increased signal appears to be specific to streptavidin. A panel of other blood proteins, DNA, and enzymes at 1 nM was incubated with droplets with and without streptavidin (Figure 3b). Without streptavidin, the other analytes did not raise the signal to a level greater than 10, in accordance with the 100 fM streptavidin sample in Figure 3a. Similarly, co-incubation of molecules did not significantly change the activation of droplets, with the exception of thrombin aptamer, which appeared to reduce signal (Figure 3b). In future studies, the experimental imaging setup will be optimized to better distinguish small numbers of aggregates and reduce signal variance between samples.
Figure 3.
Integrated brightness from HIFU pulsing of droplet samples. (a) Brightness as function of streptavidin concentration. Right-most data point indicates no streptavidin addition. Inset: Bright field microscopy images of droplets at indicated streptavidin loading. Scale bar = 5 µm. (b) Brightness for various analytes at 1 nM each. Blue bar indicates brightness without 1 nM streptavidin, red bar indicates brightness with both stretptavidin and indicated analyte co-mixed.
The acquired data also provided evidence as to the mechanism of droplet vaporization. First, the aggregation of droplets may lead to fusion and formation of nuclei for enhanced vaporization, but this was ruled out by the lack of any significant signal found in the highly aggregated 1 µM streptavidin samples prior to introduction of HIFU (Figure S1).[19] Second, aggregation of droplets may lead to decreased Laplace pressure,[14] but this is an unlikely explanation because the agglomerates appear to be intact by microscopy, so each of the droplets in the aggregate should still have the same surface area and thus the same Laplace pressure. In addition, this theory would not explain the low limit of detection of small order aggregates, for which a potential change in surface area would be small. Another explanation was recently posited by Shpak, et al., who found that droplets could refract planar acoustic waves into focal zones of constructive interference that could lead to nucleation sites typically positioned outside the walls of the droplet.[16] While their study only considered the case in which interference was focused into the confined volume of a single droplet, the focal zone in our studies may actually be present within an adjacent droplet instead. Aggregation may also cause the refraction to change, which in turn may cause enhanced or more localized focusing. This observation indicates promise for future in vivo studies, in which nanodroplet accumulation at a specific site (e. g. a tumor) may be limited and thus only smaller order aggregates are likely to form.
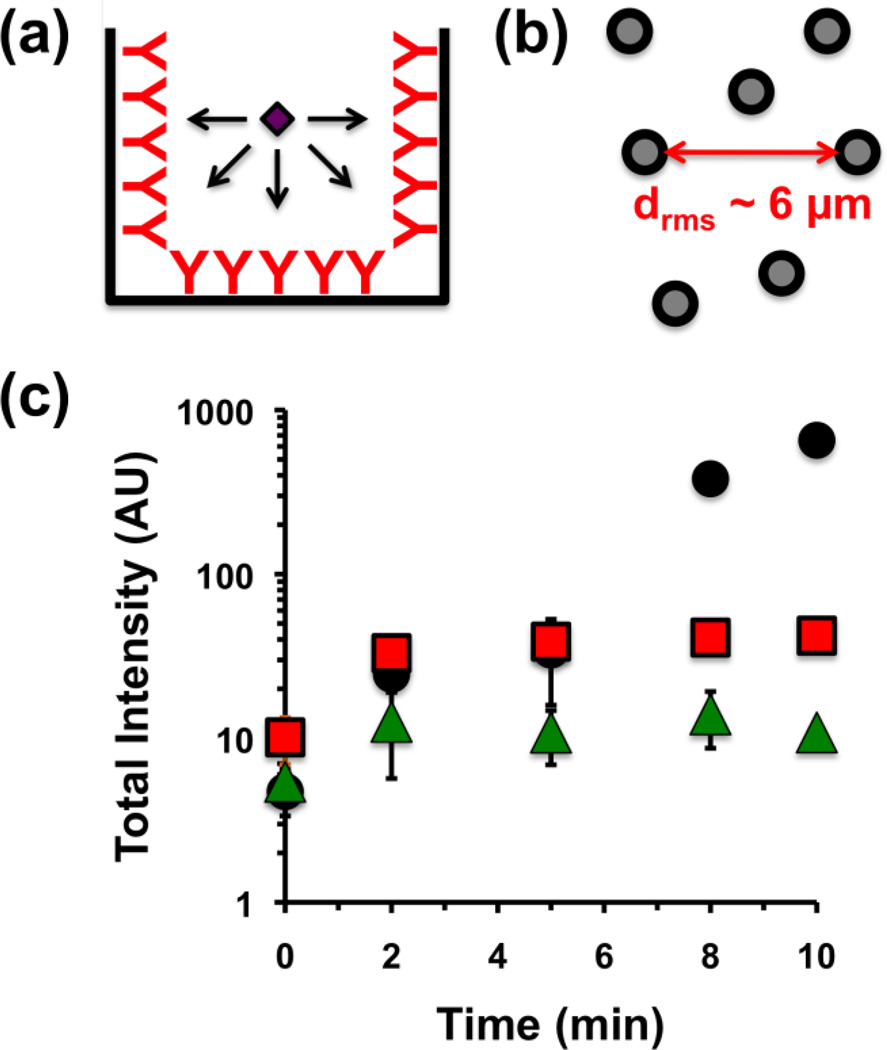
Finally, because the mechanism of detection is based on dispersed nanodroplets, the time required to achieve a positive result is greatly reduced as compared to conventional surface-bound sandwich assays. Typical ELISA assays require about four hours from initial sample incubation to development, partly due to the time required for sample to diffuse from the droplet down to the capture antibodies on the walls of the well. In addition, analyte incubation time must be optimized to allow sufficient sensitivity while ensuring that the signal does not saturate at high analyte concentrations (Figure 4). Since the mechanism of sensing requires aggregation of droplets, and since the protein analytes will diffuse faster than the droplets, the limiting step is simply two droplets finding one another. Initially, the mean interdroplet distance can be estimated for a concentration N of 5×10¹⁵ as measured by NTA as being approximately 6 µm:
| (1) |
Figure 4.
(a) Schematic of analyte diffusion onto walls of well during sandwich assay. (b) Schematic of interdroplet distance as measured from droplet concentration of 5×10¹⁵ m−3. (c) Integrated brightness vs. time from HIFU pulsing of droplets with 1 µM (black circles), 1 nM (red squares), or 1 pM (green triangles) streptavidin added at time 0. Error bar = 1 SD, study was run in triplicate.
Using Swift and Friedlander’s treatment of the Smoluchowski and Stokes-Einstein equations, the half-life of nanodroplet aggregation found from Equation (1), where η is the viscosity of the buffer (8.9×10⁻⁴ Pa-s), kB is Boltzmann’s constant (1.38×10⁻²³ J K−1), T is the absolute temperature (298 K), and N is concentration (5×10¹⁵ m−3 as measured by NTA). This was calculated to be approximately 30 s for two droplets aggregating.[20] For larger analyte concentrations the aggregation rate is expected to slow as the particle agglomerate diffuse more slowly through solution. To test this theory, a suspension of nanodroplets was mixed with 1 pM, 1 nM, and 1 µM streptavidin, and their responses to HIFU were measured at various time intervals up to 10 min (Figure 4). In the case of 1 pM and 1 nM, the corresponding full signal response was seen in only 2 min, relating nicely to the predicted aggregation halflife. For 1 µM streptavidin, the signal appears to increase further after 5 min, which is consistent with the formation of higher-order aggregates, as formation of initial aggregates slows diffusion speed. For the 1 µM streptavidin sample, full signal was still achieved in only 10 min. These results indicate that nanodroplet-based ultrasound detection may be utilized for rapid analyte sensing.
| (2) |
In conclusion, this report describes superheated liquid nanodroplets capable of acting as acoustic biosensors via a novel aggregation mechanism. It was found that biomolecules could induce aggregation of the nanodroplets, which in turn changed their to be vaporized into bubbles by High Intensity Focused Ultrasound. Nanodroplets were induced to form aggregates via biotin-streptavidin interactions, allowing detection of streptavidin by ultrasound scanning with concentrations as little as 100 fM and times under 10 min. Owing to the innate sensitivity of the detection process and low background for CPS imaging in vivo, these nanodroplets have substantial potential to be in vivo imaging agents capable of sensing small of quantities of prognostic biomarkers in localized areas within deep tissue. Future studies will focus on optimizing this new technology for sensing biomarkers for tumor malignancy in vivo.
Methods
Formulation of Nanodroplets
Prior to droplet formulation, Tris-buffered saline (TBS) was prepared to a final concentration of 10 nM Tris base (Fisher Scientific) and 100 mM NaCl (Fisher Scientific), adjusted to a pH of 8.0 with dilute HCl. A stock suspension of hydrated DPPC (Avanti Polar Lipids, Inc.) was prepared as described previously.[19] The stock DPPC suspension was mixed with DSPE-PEG2000 (Avanti Polar Lipids, Inc.) and DSPE-PEG2000-Biotin (Avanti Polar Lipids, Inc.) to make a final concentration of 1.3 mM/40 µM/15 µM, respectively, in TBS, and stirred at 75°C for 30 min. The lipid-PEG-biotin suspension was then allowed to cool to RT. 40 µL of perfluorohexane (PFH) (Strem Chemicals) was added per mL of the lipid suspension using pre-cooled pipette tips to make a 4 v/v % mixture. To obtain droplets, the mixture was probe sonicated (Branson SLPe), 1 mL at a time, with two 1 min cycles of 1s on-9s off bursts at 70% amplitude while immersing the suspension in an ice bath. Droplets with Neobee oil (Spectrum Chemical Mfg. Corp.) as the internal phase instead of PFH were formulated following the same procedure described above, without the requirement of having to cool the pipette tips or immersion in an ice-bath.
Size Separation of Nanodroplets
To fractionate the droplets to a specific size range, the emulsions were first centrifuged at a lower speed (400, 300, 200 g, or not at all, as indicated in the text) for 1.5 min. The supernatant was then recovered and further centrifuged at 1000 g for 2.5 min to pellet the droplets. Each pellet was resuspended in an amount of TBS required to obtain an optimal droplet concentration for NTA analysis; for instance, pellets from 400 g were resuspended in 40 µL TBS per mL pelleted while 0 g pellets were resuspended in 500 µL TBS per mL pelleted. The concentration and size distribution of these droplets were measured via Nanoparticle Tracking Analysis using a NanoSight LM10 setup (Malvern) (Table S1). Following initial experiments optimizing centrifugation speed, all subsequent droplet samples were prepared using the 400 g-then-1000 g double centrifugation procedure. Droplets containing Neobee oil were centrifuged at 1600 g for 1 min, and the supernatant was then centrifuged in a 0.45 µm centrifugal filter tube at 12,000 g for 4 min. The pellet of the Neobee oil droplets was resuspended in TBS to obtain a droplet suspension.
Aggregation and Imaging of Nanodroplets
Resuspended PFH droplets were diluted, as necessary, in TBS buffer to a final concentration of 5×10¹² droplets L−1 (NTA), followed by addition of streptavidin (Pierce) to the concentration indicated in the text. The mixture was then incubated in a glass vial at 4–8 °C for 30–40 min. Bright-field images were taken of both aggregated and non-aggregated droplets using a microscope (Zeiss). Images were processed by MATLAB (Mathworks, Inc.), using code developed in our labs.
Ultrasound Contrast Imaging and Analysis
Prior to imaging studies, a spherically focused, single-element, High Intensity Focused Ultrasound transducer (Sonic Concepts H101, 64.0 mm Active Diameter×63.2 mm Radius of Curvature) was equipped with a coupling cone (Sonic Concepts C101) filled with degassed and deionized water; the transducer and core were submerged in a water tank. The HIFU transducer was connected to a 30 MHz Function/Arbitrary Waveform Generator (Agilent Technologies) via an AG Series Amplifier (T&C Power Conversion, Inc.), the latter operating at 100% output throughout the study, the peak pressure of which was measured to be 5.8 MPa via needle hydrophone calibration (Onda Corp.).
In a typical experiment, PFH nanodroplets were diluted to a concentration of approximately 5×10¹² droplets L−1 in TBS to a final volume of 1 mL per sample. The sample was mixed with streptavidin at the indicated concentration and immediately transferred to the bulb of a plastic transfer pipette. The bulb was positioned on top of the coupling cone to ensure proper HIFU focusing into the center of the sample. A 4V1 (Acuson) transducer was aligned to acquire horizontal cross-sectional images of the sample while minimizing direct exposure of the transducer to HIFU pulses. For each sample, a low intensity clearing pulse was first applied by the 4V1 to destroy the few isolated microbubbles formed during incubation. Next, HIFU was applied with the following function generator settings: 1 Vpp, 1.1 MHz center frequency, 0.1 s pulse interval (burst period), and a number of cycles indicated in the main text; after initial optimization studies, the cycle number was set to 12. Real-time videos were then recorded by a Siemens Acuson Sequoia™ C512 scanner operating in cadence pulse sequencing (CPS) mode at 1.5 MHz and a mechanical index (MI) of 0.19; a total HIFU application time of about 15 s was used for each sample. For data analysis, the recorded videos were deconstructed into separate binary images, with each frame corresponding to 1 s. The mean pixel intensity within the bulb phantom was measured using ImageJ (NIH). To achieve this, a grayscale pixel threshold level of 23±1 % – in a range of 0 (white) to 255 (black) – was applied to the region of interest inside the phantom, and the intensity was measured as the difference in contrast between the signal and the white background (Figure S3). The signal obtained prior to HIFU pulsing was negligible. The total mean intensity generated from each video, calculated as the sum of the intensities from each 1s frame over 15 s of HIFU application, was depicted as a representation of the strength of the signal obtained from the corresponding sample.
For specificity studies, the following biomolecules were utilized: α-amylase from human saliva (Sigma-Aldrich), bovine serum albumin (US Biological), lysozyme from egg white (Fisher Scientific), mouse anti-HSA (Pierce), and thrombin aptamer (Integrated DNA Technologies). In order to study the affinity of a biotinylated droplet to its specific analyte, a fixed concentration (1 nM) of each analyte was incubated 30–40 min with 400 g fractionated droplets prepared as described above. The acoustic response of the droplets for each sample was measured as described above. In a separate competition experiment, the same concentration of analyte was co-incubated with 1 nM streptavidin for 30–40 min, and acoustic response was measured as described.
For the time-resolved imaging experiments, the signal was recorded first, as indicated above, for non-aggregated droplets. Streptavidin of appropriate concentration was then added to the plastic bulb containing the sample, and the signal was recorded again after 2, 5, 8, and 10 min, while mildly and intermittently shaking the sample between readings.
Supplementary Material
Acknowledgements
This work was supported by NIH grants R00CA153935, DP2EB020401, and R21EB018034. The authors would like to thank Prof. Mark Borden for use of his Sequoia Acuson C512 ultrasound imager. The authors would also like to thank Prof. Mark Borden, Prof. Todd Murray, and Prof. Jennifer Cha helpful discussions.
Footnotes
Supporting Information is available from the Wiley Online Library or from the author and contains supplementary tables and figures referenced in the text regarding mean droplet size, time-lapsed imaging, and aggregation data.
References
- 1.Weissleder R, Tung CH, Mahmood U, Bogdanov A. Nat. Biotechnol. 1999;17:375. doi: 10.1038/7933. [DOI] [PubMed] [Google Scholar]; Olson ES, Jiang T, Aguilera TA, Nguyen QT, Ellies LG, Scadeng M, Tsien RY. Proc. Natl. Acad. Sci. 2010;107:4311. doi: 10.1073/pnas.0910283107. [DOI] [PMC free article] [PubMed] [Google Scholar]; Razgulin A, Ma N, Rao JH. Chem. Soc. Rev. 2011;40:4186. doi: 10.1039/c1cs15035a. [DOI] [PubMed] [Google Scholar]; Guo ZQ, Park S, Yoon J, Shin I. Chem. Soc. Rev. 2014;43:16. doi: 10.1039/c3cs60271k. [DOI] [PubMed] [Google Scholar]; Terai T, Nagano T. Curr. Opin. Chem. Biol. 2008;12:515. doi: 10.1016/j.cbpa.2008.08.007. [DOI] [PubMed] [Google Scholar]; Kobayashi H, Choyke PL. Acc. Chem. Res. 2011;44:83. doi: 10.1021/ar1000633. [DOI] [PMC free article] [PubMed] [Google Scholar]; Jiang T, Olson ES, Nguyen QT, Roy M, Jennings PA, Tsien RY. Proc. Natl. Acad. Sci. 2004;101:17867. doi: 10.1073/pnas.0408191101. [DOI] [PMC free article] [PubMed] [Google Scholar]
- 2.Min C, Shao HL, Liong M, Yoon TJ, Weissleder R, Lee H. ACS Nano. 2012;6:6821. doi: 10.1021/nn301615b. [DOI] [PMC free article] [PubMed] [Google Scholar]; von Maltzahn G, Park JH, Lin KY, Singh N, Schwoppe C, Mesters R, Berdel WE, Ruoslahti E, Sailor MJ, Bhatia SN. Nat. Mater. 2011;10:545. doi: 10.1038/nmat3049. [DOI] [PMC free article] [PubMed] [Google Scholar]; Park JH, von Maltzahn G, Zhang LL, Schwartz MP, Ruoslahti E, Bhatia SN, Sailor MJ. Adv. Mater. 2008;20:1630. doi: 10.1002/adma.200800004. [DOI] [PMC free article] [PubMed] [Google Scholar]
- 3.Sboros V. Adv. Drug Delivery Rev. 2008;60:1117. doi: 10.1016/j.addr.2008.03.011. [DOI] [PubMed] [Google Scholar]
- 4.Schutt EG, Klein DH, Mattrey RM, Riess JG. Angew. Chem., Int. Ed. 2003;42:3218. doi: 10.1002/anie.200200550. [DOI] [PubMed] [Google Scholar]
- 5.Phillips P, Gardner E. Eur. Radiol. 2004;14(Suppl 8):P4. [PubMed] [Google Scholar]
- 6.Nakatsuka MA, Hsu MJ, Esener SC, Cha JN, Goodwin AP. Adv. Mater. 2011;23:4908. doi: 10.1002/adma.201102677. [DOI] [PMC free article] [PubMed] [Google Scholar]
- 7.Klibanov AL, Rasche PT, Hughes MS, Wojdyla JK, Galen KP, Wible JH, Brandenburger GH. Acad. Radiol. 2002;9:S279. doi: 10.1016/s1076-6332(03)80203-9. [DOI] [PubMed] [Google Scholar]
- 8.Grinstaff MW, Suslick KS. Proc. Natl. Acad. Sci. 1991;88:7708. doi: 10.1073/pnas.88.17.7708. [DOI] [PMC free article] [PubMed] [Google Scholar]; Coley BD, Trambert MA, Mattrey RF. Am. J. Roentgenol. 1994;163:961. doi: 10.2214/ajr.163.4.8092043. [DOI] [PubMed] [Google Scholar]; Porter TR, Iversen PL, Li SP, Xie F. J. Ultrasound Med. 1996;15:577. doi: 10.7863/jum.1996.15.8.577. [DOI] [PubMed] [Google Scholar]; Forsberg F, Roy R, Merton DA, Rawool NM, Liu JB, Huang M, Kessler D, Goldberg BB. Ultrasound Med. Biol. 1998;24:1143. doi: 10.1016/s0301-5629(98)00062-3. [DOI] [PubMed] [Google Scholar]
- 9.Nakatsuka MA, Mattrey RF, Esener SC, Cha JN, Goodwin AP. Adv. Mater. 2012;24(6010) doi: 10.1002/adma.201201484. [DOI] [PMC free article] [PubMed] [Google Scholar]; Nakatsuka MA, Barback CV, Fitch KR, Farwell AR, Esener SC, Mattrey RF, Cha JN, Goodwin AP. Biomaterials. 2013;34:9559. doi: 10.1016/j.biomaterials.2013.08.040. [DOI] [PMC free article] [PubMed] [Google Scholar]; Goodwin AP, Nakatsuka MA, Mattrey RF. WIREs Nanomed. Nanobiotechnol. 2015;7:111. doi: 10.1002/wnan.1285. [DOI] [PMC free article] [PubMed] [Google Scholar]
- 10.Shapiro MG, Goodwill PW, Neogy A, Yin M, Foster FS, Schaffer DV, Conolly SM. Nat. Nanotechnol. 2014;9:311. doi: 10.1038/nnano.2014.32. [DOI] [PMC free article] [PubMed] [Google Scholar]; Jokerst JV, Khademi C, Gambhir SS. Sci Transl Med. 2013;5 doi: 10.1126/scitranslmed.3005228. [DOI] [PMC free article] [PubMed] [Google Scholar]; Cavalieri F, Micheli L, Kaliappan S, Teo BM, Zhou MF, Palleschi G, Ashokkumar M. Acs Appl Mater Inter. 2013;5:464. doi: 10.1021/am302660j. [DOI] [PubMed] [Google Scholar]; Hettiarachchi K, Lee AP. J. Colloid Interface Sci. 2010;344:521. doi: 10.1016/j.jcis.2010.01.042. [DOI] [PMC free article] [PubMed] [Google Scholar]
- 11.Kopechek JA, Park E, Mei CS, McDannold NJ, Porter TM. Journal of Healthcare Engineering. 2013;4:109. doi: 10.1260/2040-2295.4.1.109. [DOI] [PMC free article] [PubMed] [Google Scholar]
- 12.Zhang P, Porter T. Ultrasound Med. Biol. 2010;36:1856. doi: 10.1016/j.ultrasmedbio.2010.07.001. [DOI] [PubMed] [Google Scholar]
- 13.Giesecke T, Hynynen K. Ultrasound Med. Biol. 2003;29:1359. doi: 10.1016/s0301-5629(03)00980-3. [DOI] [PubMed] [Google Scholar]; Gao Z, Kennedy AM, Christensen DA, Rapoport NY. Ultrasonics. 2008;48:260. doi: 10.1016/j.ultras.2007.11.002. [DOI] [PMC free article] [PubMed] [Google Scholar]; Wang CH, Kang ST, Lee YH, Luo YL, Huang YF, Yeh CK. Biomaterials. 2012;33:1939. doi: 10.1016/j.biomaterials.2011.11.036. [DOI] [PubMed] [Google Scholar]; Sheeran PS, Luois S, Dayton PA, Matsunaga TO. Langmuir. 2011;27:10412. doi: 10.1021/la2013705. [DOI] [PMC free article] [PubMed] [Google Scholar]; Fabiilli ML, Haworth KJ, Sebastian IE, Kripfgans OD, Carson PL, Fowlkes JB. Ultrasound Med. Biol. 2010;36:1364. doi: 10.1016/j.ultrasmedbio.2010.04.019. [DOI] [PMC free article] [PubMed] [Google Scholar]; Rapoport N, Nam KH, Gupta R, Gao ZG, Mohan P, Payne A, Todd N, Liu X, Kim T, Shea J, Scaife C, Parker DL, Jeong EK, Kennedy AM. J. Control. Release. 2011;153:4. doi: 10.1016/j.jconrel.2011.01.022. [DOI] [PMC free article] [PubMed] [Google Scholar]
- 14.Kripfgans OD, Fowlkes JB, Miller DL, Eldevik OP, Carson PL. Ultrasound Med. Biol. 2000;26:1177. doi: 10.1016/s0301-5629(00)00262-3. [DOI] [PubMed] [Google Scholar]
- 15.Kripfgans OD, Fowlkes JB, Eldevik OP, Carson PL, Woydt M. 2000 Ieee Ultrasonics Symposium Proceedings, Vols 1 and 2. 2000. p. 1449. [Google Scholar]
- 16.Shpak O, Verweij M, Vos HJ, de Jong N, Lohse D, Versluis M. Proc. Natl. Acad. Sci. 2014;111:1697. doi: 10.1073/pnas.1312171111. [DOI] [PMC free article] [PubMed] [Google Scholar]
- 17.Xu SS, Zong YJ, Li WS, Zhang SY, Wan MX. Ultrason. Sonochem. 2014;21:975. doi: 10.1016/j.ultsonch.2013.11.016. [DOI] [PubMed] [Google Scholar]; Fabiilli ML, Haworth KJ, Kripfgans OD, Carson PL, Fowlkes JB. Ultrason. 2008:768. [Google Scholar]
- 18.Filipe V, Hawe A, Jiskoot W. Pharm. Res. 2010;27:796. doi: 10.1007/s11095-010-0073-2. [DOI] [PMC free article] [PubMed] [Google Scholar]
- 19.Mohan P, Noonan PS, Nakatsuka MA, Goodwin AP. Langmuir. 2014;30:12321. doi: 10.1021/la502483u. [DOI] [PMC free article] [PubMed] [Google Scholar]
- 20.Swift DL, Friedlander SK. J. Colloid Sci. 1964;19:621. [Google Scholar]; Lin MY, Lindsay HM, Weitz DA, Klein R, Ball RC, Meakin P. J. Phys. Cond. Matter. 1990;2:3093. doi: 10.1103/physreva.41.2005. [DOI] [PubMed] [Google Scholar]; Smoluchowski Mv. Physik. Z. 1917;92:129. [Google Scholar]
Associated Data
This section collects any data citations, data availability statements, or supplementary materials included in this article.


