Summary
Rapid determination of in vitro metabolic stability and metabolite profiling of new chemical entities using microsomes or other liver preparations is one of the most important steps in drug discovery. In this paper, we report the use of liquid chromatography-hybrid triple quadrupole/linear ion trap mass spectrometry for the simultaneous analysis of metabolic stability, metabolite profiling, and the kinetics of metabolite formation of praziquantel and three structural analogs. Multiple reaction monitoring (MRM) scans were used to quantify the disappearance of parent compounds and the formation of metabolites. MRM-information dependent acquisition-enhanced product ion (MRM-IDA-EPI) scans were used for the identification of the metabolites formed. Metabolic stability of these anthelmintics were studied in human liver microsomes (HLM) using MRM as a survey scan, which resulted in the identification of a higher number of metabolites compared to neutral loss (NL), precursor ion (PI), and enhanced mass spectrometry (EMS) scans. MRM-IDA-EPI scans resulted in the generation of similar calibration curves to MRM-only quantitative analysis. Therefore, the quantitative capabilities of the method was not affected by the additional qualitative information obtained during the same run. The formation of major metabolites was also simultaneously monitored, which could be used to understand the kinetics and mechanism of metabolite formation. Finally, our data demonstrate that the three analogs had higher metabolic stability than the anthelmintic prototype (praziquantel).
Keywords: metabolic stability, metabolite profiling, praziquantel, structural analogs, ultra-performance liquid chromatography, tandem mass spectrometry, information-dependent acquisition
Introduction
There is a growing need to characterize the ADME (absorption, distribution, metabolism and excretion) properties of molecules at various stages in the drug discovery and development process.1,2) Identifying metabolic properties is a key component of characterizing the ADME profile, and nowadays it is integrated into the early discovery phase.3) Xenobiotics are biotransformed to less toxic, less active, and more hydrophilic metabolites to enhance their detoxification and elimination. However, biotransformation (metabolism) can also yield metabolites that are more toxic, more active, and/or less hydrophilic than the parent xenobiotics.4,5) The metabolic properties of a drug are characterized by metabolic stability, metabolite profiling, enzyme mapping, and enzyme inhibition/induction studies.6)
Metabolic stability is defined as the susceptibility of a compound to biotransformation, and is usually quantified by monitoring the disappearance of the parent compound over time in an in vitro system to determine the metabolic half-life (t1/2) and intrinsic clearance (CLint).7,8) Results from in vitro metabolic stability studies are used at the early stages of drug discovery to estimate and predict clearance (CL) in vivo.7,9) Furthermore, these data can also be used for the development of in silico quantitative structure-activity relationship models to predict the metabolic behavior in vivo based on molecular structure.10)
Several in vitro systems utilizing heterologously expressed recombinant enzymes, liver microsomes, fresh and cryopreserved hepatocytes, tissue homogenates, or tissue slices are used in metabolic stability studies.8,11–13) The advantages, disadvantages, and applications of each of these systems have been recently reviewed.3) Currently, human liver microsomes (HLM) are the most widely used in vitro model for the early determination of metabolic stability.3)
Metabolite profiling studies involve the detection, identification, and quantification of metabolites in vivo and in vitro. These studies provide quantitative and qualitative information about the metabolic fate of drugs and assist in the identification of the parts of the molecule susceptible to metabolism (soft spots). Collectively, data from metabolic studies help medicinal chemists synthesize compounds that are more metabolically stable and/or more resistant to the formation of toxic metabolites.
In drug metabolism studies, fluorescence, luminescence, radiometric, and liquid chromatography-tandem mass spectrometry (LC-MS/MS) analytical techniques are used to monitor the disappearance of parent compounds and/or the formation of metabolites.14–16) LC-MS/MS using triple quadrupole MS in the multiple reaction monitoring (MRM) mode has become the most widely used analytical technique in support of quantitative drug metabolism studies due to its superior sensitivity and selectivity.17) However, its major shortfall is the limited scan speed (poor duty cycle), which limits the number of qualitative scans (neutral loss, product ion, and precursor ion spectra) that can be performed on-line during chromatography. Therefore, separate analytical runs are performed for the metabolic stability and metabolite profiling studies. Recently, the hybrid triple quadrupole/linear ion trap (QqQLIT) MS was introduced, which maintains the high sensitivity and selectivity of the triple quadrupole with the addition of a high duty cycle in terms of the scanning capabilities using the linear ion trap. This system has been used not only for quantitative analysis, but also for acquiring structural information data (product ion spectra) in the same analytical run.18,19)
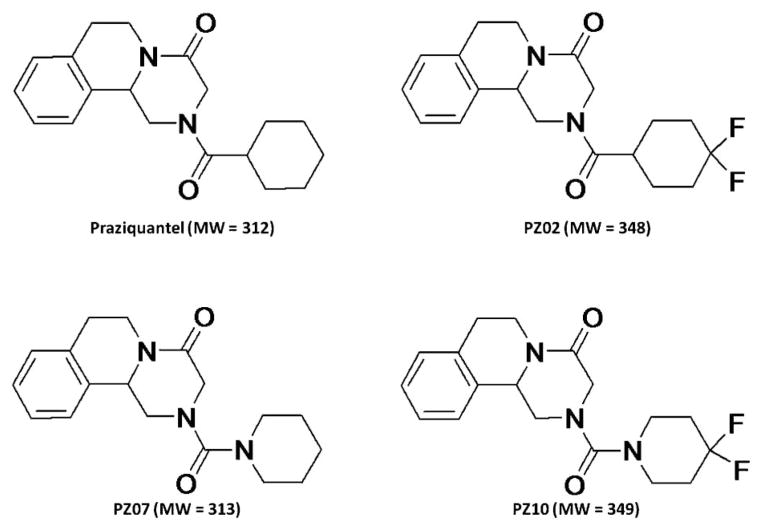
Praziquantel is a broad-spectrum anthelmintic drug used for the treatment of all forms of schistosomiasis and infections caused by other trematodes.20,21) However, praziquantel undergoes rapid first-pass drug metabolism to form a major trans-cyclohexanol metabolite.15) Moreover, most data show that praziquantel metabolites, including the major trans-cyclohexanol metabolite, are less effective or inactive compared to the parent molecule.21,22) Therefore, an attempt was made to synthesize new praziquantel analogs with potentially better metabolic stability and a broad-spectrum antischistosomal activity against both juvenile and adult forms.20) In this paper, an information-dependent acquisition (IDA) approach using MRM as survey scans and enhanced product ion (EPI) as dependent scans on a QqQLIT instrument was developed to simultaneously quantify the disappearance of parent compounds, identify the formed metabolites, and semi-quantitatively monitor metabolite formation. This method was applied to simultaneously support metabolic stability and metabolite profiling studies of praziquantel and its new analogs (PZ02, PZ07, PZ10) (Fig. 1).20)
Fig. 1.
Chemical structures and molecular weights of praziquantel and its analogs
Materials and Methods
Chemicals
Praziquantel (2-cyclohexylcarbonyl-1, 2,3,6,7,11b-hexahydro-4H-pyrazino(2,1-α)isoquinoline-4-one) was purchased from Sigma-Aldrich (St. Louis, MO) and its analogs PZ02 (2-(4,4-difluorocyclohexyl)carbonyl-1,2,3,6,7,11b-hexahydro-4H-pyrazino(2,1-α)isoquinoline-4-one), PZ07 (2-piperidinylcarbonyl-1,2,3,6,7,11b-hexa-hydro-4H-pyrazino(2,1-α)isoquinoline-4-one), and PZ10 (2-(4,4-difluoropiperidinyl)carbonyl-1,2,3,6,7,11b-hexa-hydro-4H-pyrazino(2,1-α)isoquinoline-4-one) were synthesized as described.20) D-Glucose-6-phosphate was purchased from MP Biomedicals (Solon, OH). Glucose-6-phosphate dehydrogenase (G6P-DH) and NADP disodium salt were obtained from Roche Diagnostics (In-dianapolis, IN). Potassium phosphate monobasic, magnesium chloride, and HPLC-grade methanol were purchased from Fisher Scientific (Fair Lawn, NJ).
Microsomal incubations
Pooled HLM (n=200 livers) were purchased from XenoTech, LLC (Lenexa, KS). Substrates (1 μM of praziquantel, PZ02, PZ07, or PZ10 in 0.1% MeOH) were preincubated with 0.5 mg/mL HLM protein in potassium phosphate monobasic buffer (50 mM KH2PO4, pH 7.4) containing 3 mM MgCl2 for 5 min at 37°C. Reactions were initiated by the addition of a NADPH regenerating system (1 mM NADP+, 5 mM glucose-6-phosphate, 1 U/mL glucose-6-phosphate dehydrogenase) to give a final incubation volume of 100 μL. Reactions were then quenched by adding 100 μL of ice-cold methanol containing 40 ng/mL imipramine (internal standard, IS) at 0, 5, 10, 15, 30, 45, 60, 90, and 120 min, followed by centrifugation. Ten μL of the supernatant fluid was directly subjected to LC-MS/MS analysis.
Calculation of in vitro metabolic stability parameters
The in vitro metabolic stability parameters, including t1/2, microsomal CLint, hepatic CLint, extraction ratio (ER), and hepatic CL, were calculated according to the well-stirred model approach.3,23,24) Briefly, the rate constant for the disappearance of parent compound (k) was calculated from the slope of the terminal phase of the percent turnover vs. time plot. The percent turnover was calculated as the percentage of analyte concentrations in incubated samples relative to those of 0-min samples. The in vitro t1/2 was calculated using the equation:
| (1) |
Microsomal CLint was determined according to the following equation:
| (2) |
Where [V] is the incubation volume in μL and [P] is the amount of microsomal protein in the incubation mixture.
Microsomal CLint (μL/min/mg microsomal protein) was scaled to in vivo hepatic CLint (mL/min) using a microsomal recovery value of 33 mg microsomal protein/g liver and a human liver weight of 1480 g:25)
| (3) |
ER was calculated using the following equation:
| (4) |
Where Q is the hepatic blood flow (human Q is estimated to be 1400 mL/min)26) and fu is the free fraction in blood (fu for praziquantel and its analogs was assumed to be 1).
Hepatic CLint can be converted to hepatic clearance using the following equation:
| (5) |
Chromatographic and mass spectrometric conditions
Sample analyses were performed on a LC-MS/MS system consisting of a 4000 QTrap triple quadrupole/linear ion trap hybrid mass spectrometer equipped with an electrospray ionization (ESI) source (Applied Biosystems, Foster City, CA) and a Waters AC-QUITY ultra-performance liquid chromatography (UP-LC) system (Waters, Milford, MA). Data analyses were performed using Analyst 1.4.2 and LightSight 2.1 software (Applied Biosystems, Foster City, CA).
All chromatographic separations were performed with an ACQUITY UPLC BEH C18 column (2.1×100 mm, 1.7 μm; Waters) equipped with an ACQUITY UPLC C18 guard column (Waters). The mobile phase consisted of mobile phase A (7.5 ammonium acetate (pH 4.0)) and mobile phase B (methanol). The gradient profile was held at 30% mobile phase B for 2 min, increased to 70% mobile phase B from 2 to 15 min, and further increased to 95% mobile phase B from 15–15.25 min. Mobile Phase B was held at 95% for 1 min and brought back to 30% in 0.25 min followed by 3 min equilibration. The flow rate was 0.3 mL/min and the injection volume was 10 μL.
Mass spectrometer conditions were optimized by infusing each analyte and IS using a 1 μg/mL solution in 50% methanol via a Harvard 22 standard infusion syringe pump at 10 μL/min flow rate (Harvard Apparatus, South Natick, MA). EPI spectra of analytes were collected to identify the three most abundant fragments for each analyte (Table 1). MRM channels of the parent compounds and MRM channels for “guessed” metabolites were used as survey scans. The MRM channels for guessed metabolites based on the most common 13 biotransformation pathways were generated by an Analyst script from the mass-to-charge ratio of the protonated molecules and the three most intense product ions. For instance, the three most intense product ions of praziquantel ([M+H]+= 313) were m/z 203, 83, and 132. Therefore six MRM survey channels for monohydroxylated (M+H+16) metabolites at 329→203, 329→219, 329→83, 329→99, 329→132, and 329→148, were generated. This ensures that monohydroxylated metabolites with the hydroxylation position in either the product or neutral loss parts of the molecule can be detected. A total of 81 MRM survey channels were created for each compound, as well as two dedicated MRM channels to monitor IS, with dwell times of 5 msec/channel and pause times of 5 msec. Metabolite identification was performed using LightSight software based on matching the product ions and neutral losses of the EPI spectra of detected metabolites to those of the parent compounds.
Table 1.
MRM transitions (based on the three most abundant fragment ions) and MS parameters for praziquantel and its analogs
| MRM transition | Declustering potential (V) | Collision energy (eV) | Cell exit potential (V) | |
|---|---|---|---|---|
| Praziquantel | 313.2→203.0 | 65 | 27 | 10 |
| 313.2→83.0 | 65 | 39 | 14 | |
| 313.2→132.0 | 65 | 49 | 22 | |
| PZ02 | 349.2→329.1 | 65 | 23 | 16 |
| 349.2→203.0 | 65 | 33 | 10 | |
| 349.2→132.0 | 65 | 55 | 5 | |
| PZ07 | 314.2→112.0 | 65 | 25 | 20 |
| 314.2→201.0 | 65 | 35 | 10 | |
| 314.2→146.0 | 65 | 48 | 6 | |
| PZ10 | 350.2→201.0 | 65 | 33 | 10 |
| 350.2→148.0 | 65 | 29 | 28 | |
| 350.2→158.0 | 65 | 48 | 7 | |
| IS | 281.1→86.0 | 65 | 35 | 14 |
| 281.1→193.0 | 65 | 57 | 34 |
IS, internal standard
The same declustering potential (DP), collision energy (CE), and cell exit potential (CXP) values optimized for each parent compound were used for the MRM transitions of its guessed metabolites. The IDA (information-dependent acquisition) threshold was set at 500 counts per second (cps), above which EPI spectra were collected from the parent mass of that particular channel. The EPI scan rate was 4000 amu/sec and the scan range was 75 to 400 amu. The CEs were set at 38, 37, 36, and 37 eV for praziquantel, PZ02, PZ07, and PZ10, respectively, with a CE spread of 10 eV. Dynamic exclusion, which defines the time for which a transition is excluded after acquiring an EPI scan, was set to 8 sec after three consecutive appearances to allow the detection of co-eluting metabolites of lower abundance. The dynamic fill time (DFT) function was used to prevent the space charges effect resulting from overfilling the LIT. The total cycle time for the MRM-IDA-EPI was 1.4 sec/cycle. The IS was placed in the exclusion list of IDA criteria to avoid the unnecessary acquisition of its EPI spectra. Other parameters were set as follows: curtain gas: 20; ion source: 5000 V; temperature: 550°C; gas 1: 30 psi; gas 2: 30 psi; CAD gas: high.
Calibration curves of the parent compounds in the range 0.5–400 ng/mL were prepared by spiking 100 μL of incubation mixtures pre-deactivated with a 100 μL of ice-cold MeOH with 10 μL of appropriate standard solutions. The concentration of imipramine (IS) was 40 ng/mL. Linear regression analyses with a 1/x weighting scheme were used.
Results and Discussion
Method design and evaluation
The detection of the trace concentrations of metabolites formed during in vitro metabolic stability studies requires analytical methods with very high sensitivity and selectivity. The hybrid Qtrap mass spectrometer combines the scanning capabilities of triple quadrupole and linear ion trap instruments into a single platform capable of performing several types of mass spectrometric analyses, including EMS (enhanced MS), EPI (enhanced product ion), PI (precursor ion), NL (neutral loss), and MRM (multiple reaction monitoring) scans. In IDA, one of these scans can be used as a survey scan, and this triggers the acquisition of EPI spectra if the signal intensity of the survey scan exceeds a predefined threshold value. Due to the superior sensitivity and selectivity of MRM scans, the highest number of metabolites for all four compounds was detected using MRM-based survey methods. Therefore, MRM transitions were selected as survey scans for all four compounds. The MRM transition lists of guessed metabolites were created based on the fragmentation pattern of the parent compounds as described in the experimental section and as described previously.19,27,28) MRM-IDA methods have been previously applied for the rapid screening and characterization of metabolites using HLM27) and fresh hepatocytes.29,30)
In IDA methods, measures should be taken to ensure the detection of co-eluting metabolites. Due to their higher abundance, metabolites with higher concentrations might continuously trigger the acquisition of dependent scans, whereas co-eluting metabolites with lower concentrations are missed. Therefore, we set our exclusion criteria at 8 sec after three consecutive appearances. This means that MRM survey transitions are excluded from triggering dependent scans when they trigger three consecutive dependent scans, which leaves the opportunity for any co-eluting metabolites of lower abundance to trigger the acquisition of their own EPI spectra. The IS was also placed in the exclusion list to ensure that any metabolites co-eluting with the IS are not missed.
The major disadvantage of the MRM-IDA method is its inability to detect unexpected metabolites, which are not included in the guessed metabolite list used to create the MRM transitions of metabolites. Therefore, the effectiveness of metabolite screening by MRM is dependent on the right selection of theoretical metabolite ions and their product ions. In contrast, non-targeted survey scans such as EMS and NL do not require the preselection of expected metabolites, and therefore are less likely to miss unexpected metabolites. However, due to their lower sensitivity and selectivity, EMS, PI, and NL scans generate more signal noise and are more likely to miss metabolites at low concentrations compared to MRM scans. Therefore, additional runs using EMS and/or NL survey scans can be performed to complement the MRM-IDA runs and ensure that unexpected metabolites are not missed. In this report, no metabolites (unexpected metabolites) other than those detected by MRM-IDA scans were detected by EMS-, PI-, or NL-IDA approaches.
Metabolite profiling of praziquantel
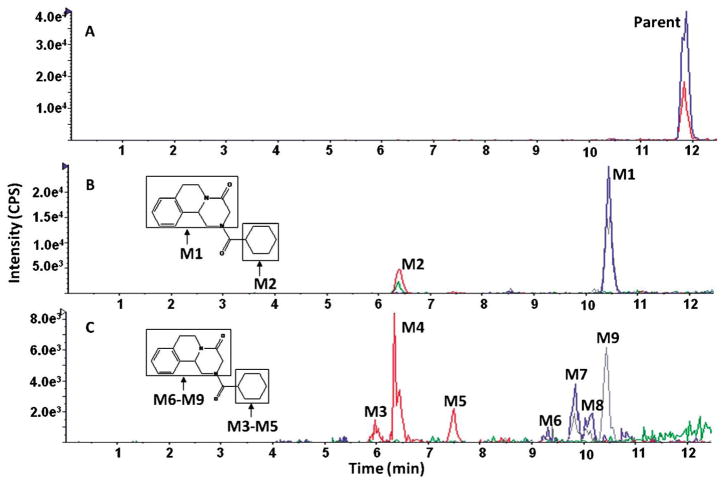
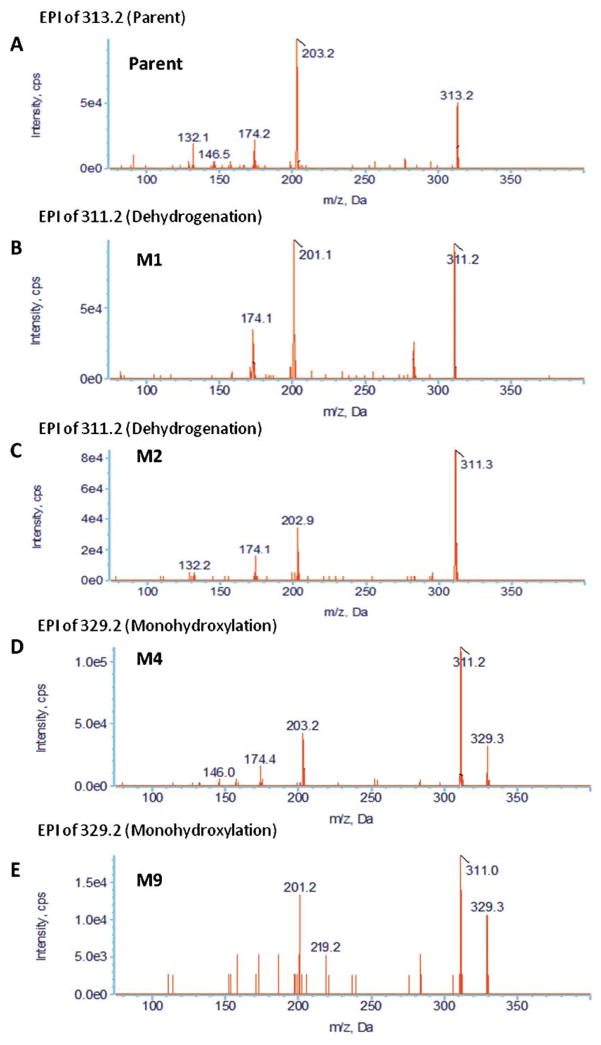
During the study of praziquantel metabolic stability, nine metabolites were formed and detected using our approach. Figure 2 demonstrates the extracted ion chromatograms (EICs) of detected metabolites. Assigning detected masses as metabolites was based on the following criteria: (1) the mass of the ion should match the mass of an expected metabolite, (2) the ion should not be detected in the control sample (time 0), (3) the EPI spectra should produce product ions and neutral losses that match the EPI spectra of the parent compound. Representative EPI spectra of praziquantel and its metabolites (M1, M2, M4, and M9) are shown in Figure 3. Structures of praziquantel metabolites were proposed based on both the signal from MRM transitions (Table 2) and the EPI spectra (Fig. 3). For example, M1 and M2 were assigned as de-hydrogenated metabolites because the precursor ion (m/z 311.2) and/or the product ions (m/z 201 and/or m/z 81) were 2 mass units smaller than the corresponding precursor (m/z 313) and product ions (m/z 203 and m/z 83) of praziquantel. In addition, metabolites M3–M9 were assigned as monohydroxylated metabolites because the precursor ion (m/z 329.2) and the product ions (m/z 219) were 16 mass units larger than the corresponding precursor (m/z 313) and product ions (m/z 203) of praziquantel.
Fig. 2.
Representative extracted ion chromatograms (EICs) obtained from a sample of praziquantel incubated with HLMs for 120 min using the MRM-IDA-EPI method for: (A) parent (313 m/z); (B) dehydrogenated metabolites (311 m/z); (C) monohydroxylated metabolites (329 m/z)
Fig. 3.
Representative enhanced product ion (EPI) spectra of praziquantel and its four major metabolites (A) parent; (B) M1; (C) M2; (D) M4; (E) M9.
Table 2.
List of MRM transitions for each of the detected metabolites
| Praziquantel | PZ02 | PZ07 | PZ10 | ||||
|---|---|---|---|---|---|---|---|
|
| |||||||
| MRM transition | Signal detected | MRM transition | Signal detected | MRM transition | Signal detected | MRM transition | Signal detected |
| 313.2→203.0 | Parent | 349.2→329.1 | Parent | 314.2→112.0 | Parent | 350.2→201.0 | Parent |
| 313.2→83.0 | Parent | 349.2→203.0 | Parent | 314.2→201.0 | Parent | 350.2→148.0 | Parent |
| 311.2→201.0 | M1 | 347.2→327.1 | M1, M2 | 312.2→112.0 | M1, M3, M4 | 348.2→199.0 | M1–M4 |
| 311.2→83.0 | M1 | 347.2→201.0 | M1 | 312.2→199.0 | M1 | 348.2→148.0 | M1–M4 |
| 311.2→203.0 | M2 | 365.2→345.1 | M3–M6 | 312.2→201.0 | M2 | 366.2→217.0 | M5–M8 |
| 311.2→81.0 | M2 | 365.2→219.0 | M4–M6 | 312.2→110.0 | M2 | 366.2→148.0 | M5–M8 |
| 329.2→203.0 | M3–M5 | 381.2→361.1 | M7, M8 | 330.2→128.0 | M5 | ||
| 329.2→219.0 | M6–M8 | 381.2→235.1 | M7, M8 | 330.2→201.0 | M5 | ||
| 329.2→83.0 | M7–M9 | 363.2→343.1 | M9 | 330.2→112.0 | M6, M7 | ||
| 363.2→217.0 | M9 | 330.2→217.0 | M6, M7 | ||||
| 346.2→146.0 | M8 | ||||||
| 346.2→201.0 | M8 | ||||||
| 310.2→108.0 | M9 | ||||||
| 310.2→201.0 | M9 | ||||||
| 332.2→201.0 | M10 | ||||||
Furthermore, based on the fragmentation pattern and the intensity of the MRM signals, the position of the metabolic modification was narrowed to a specific part of the molecules. For example, the fragmentation pattern of M1 is quite similar to that of praziquantel, except that a fragment ion of m/z=201 rather than 203 was observed in the M1 EPI spectrum, indicating dehydrogenation of the part of the molecule corresponding to the m/z=203 product ion in the praziquantel EPI spectrum. In addition, the highest signal among all MRM transitions for M1 resulted from the 311>201 transition. Therefore, dehydrogenation was proposed to occur in the 1,2,3,6,7,11b-hexahydro-4H-pyrazino(2,1-α)isoquinoline-4-one group (part A) (Fig. 2). In contrast, M2 was identified as the product of dehydrogenation of the cyclohexyl group (part B) because no mass shift was observed in the 203 ion of M2 EPI spectrum and the 311>203 rather than 311>201 MRM transition produced the highest signal (Fig. 2). Similarly, M3, M4, and M5 metabolites were proposed to be produced by monohydroxylation of part B, whereas M6–M9 were proposed to be produced by monohydroxylation of part A of praziquantel. Information on the position of metabolic modification could be especially valuable to medicinal chemists, who seek to modify the soft spots to improve the metabolic stability of lead compounds.
In a previous report, two monohydroxylated and four dihydroxylated metabolites were detected in human urine after oral administration of praziquantel using a thin-layer chromatography (TLC)-radiometric method.22) Monohydroxylation was proposed to occur in the cyclo-hexane ring (part B), which is in accordance with our findings. However, we have detected the formation of seven additional monohydroxylated metabolites, three of which occur in part B of the molecule. In addition, the formation of dihydroxylated metabolites of praziquantel was not detected in our HLM system. In another report, only one dehydrogenated metabolite was detected using human cytochrome P-450 3A4 expressed in Escherichia coli and Saccharomyces cerevisiae by a HPLC-UV method.15) However, we were able to detect the formation of two dehydrogenated metabolites. These differences might be due to extrahepatic metabolism in vivo and non-renal elimination of metabolites in vivo, as well as the differences in the analytical techniques used for metabolite identification.15)
To ensure no unexpected metabolites were missed using MRM survey scans, different types of survey scan triggering EPI methods were used to detect any other metabolites of praziquantel. Table 3 lists all the metabolites tentatively identified by using different survey scans. The EMS survey scan was conducted in the mass range from 250 to 400 amu. Using EMS survey scans, only three metabolites were detected, two dehydrogenation products and one oxidation product (data not shown). The signal-to-noise ratios of these metabolites in the EMS-IDA-EPI spectra were 5-fold lower than those in the MRM-IDA-EPI spectra. Using PI and NL as survey scans, only four and five metabolites were detected, respectively. Therefore, the nontargeted IDA analysis failed to detect all the metabolites detected using targeted (knowledge-based) IDA analysis because of the low signal-to-noise ratio resulting from the matrix.
Table 3.
List of praziquantel metabolites detected using various types of survey scans
| Metabolite | Mass shift | Metabolism reaction | Metabolites detected
|
||||
|---|---|---|---|---|---|---|---|
| EMS-EPI | MRM-EPI | MRM & MIM-EPI | PI-EPI | NL-EPI | |||
| M1 | −2 | Dehydrogenation | X | X | X | — | X |
| M2 | −2 | Dehydrogenation | X | X | X | X | — |
| M3 | +16 | Mono-oxidation | — | X | X | Xa | — |
| M4 | +16 | Mono-oxidation | X | X | X | X | — |
| M5 | +16 | Mono-oxidation | — | X | X | Xa | — |
| M6 | +16 | Mono-oxidation | — | X | Xa | — | Xa |
| M7 | +16 | Mono-oxidation | — | X | Xa | — | Xa |
| M8 | +16 | Mono-oxidation | — | X | Xa | — | Xa |
| M9 | +16 | Mono-oxidation | — | X | X | — | Xa |
Metabolites were detected and identified from their MRM transitions, but their EPI acquisition was not triggered.
EMS (enhanced MS), EPI (enhanced product ion), MRM (multiple reaction monitoring), MIM (multiple ion monitoring), PI (precursor ion), NL (neutral loss).
Another approach was investigated based on the selection of the same mass for both MS1 and MS2 in multiple ion monitoring (MIM) transitions. These survey scans can be particularly useful if the metabolic modification of the parent compound drastically changes its fragmentation pattern to the point where no common fragments between the parent compound and metabolites are formed. Praziquantel metabolites formed in an HLM incubation sample (120 min) were analyzed by the survey scan using a combination of MIM (13 transitions) and MRM (81 transitions). Compared to the MRM-IDA-EPI method, the MRM- and MIM-IDA-EPI approach also resulted in the detection of the same nine praziquantel metabolites (Table 3). Nevertheless, three of these nine metabolites did not trigger EPI-dependent scans due to the high noise associated with the MIM transitions. Thus, among all five types of IDA-EPI scans, the MRM-IDA-EPI approach represented the most selective and the most sensitive method, and provided structural information for the highest number of metabolites.
Metabolite profiling of praziquantel analogs
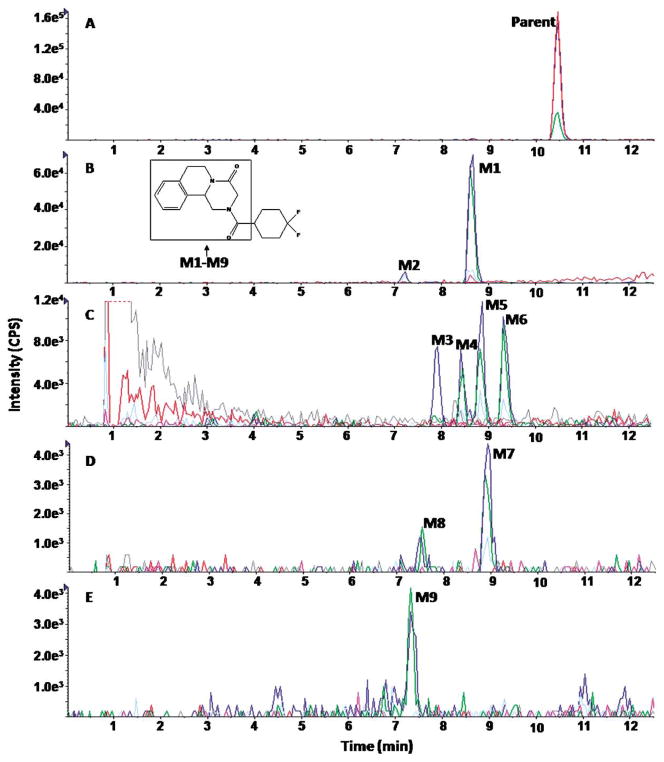
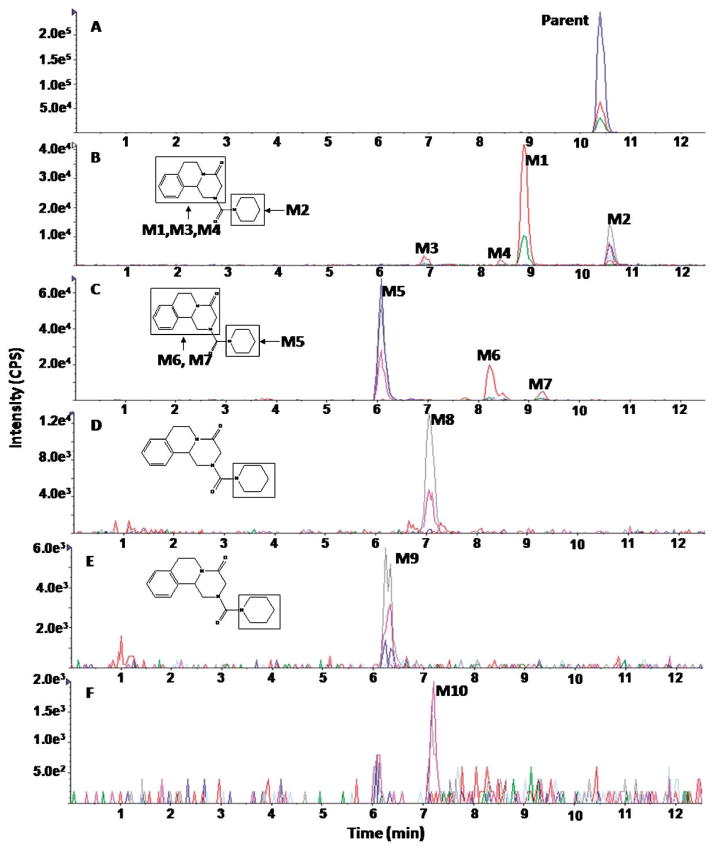
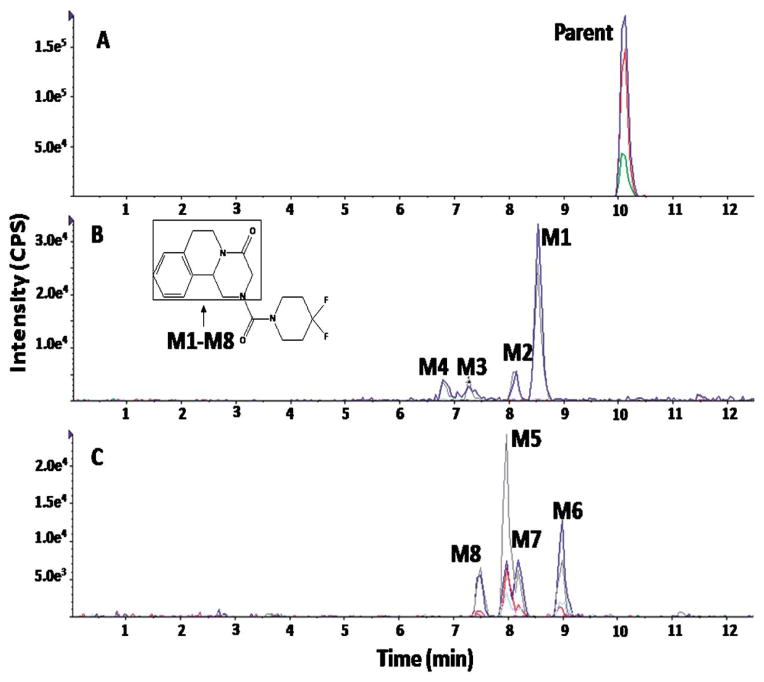
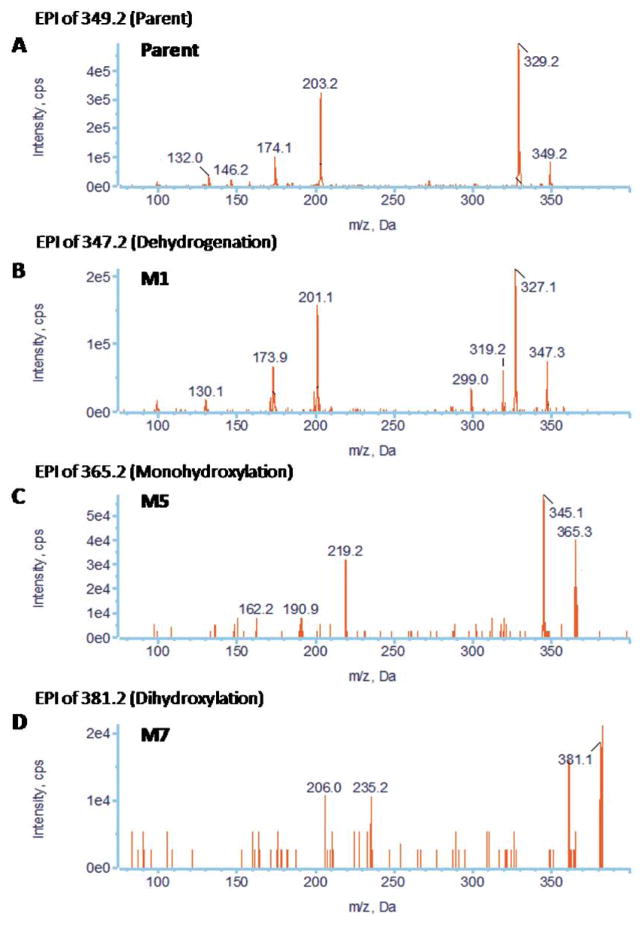
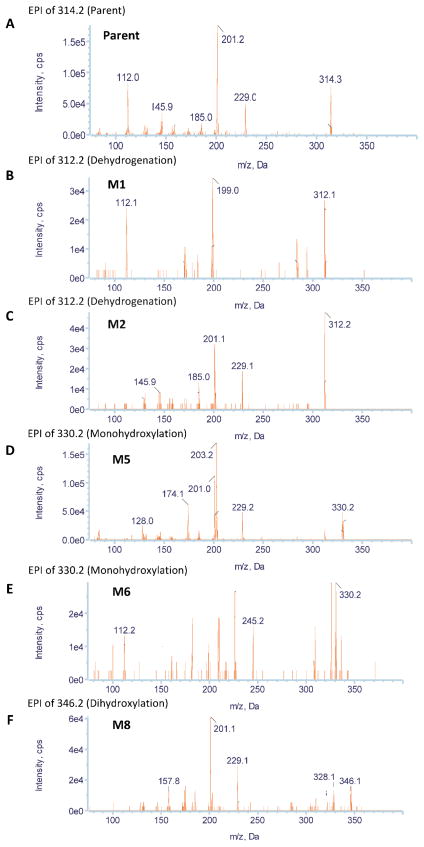
The MRM-IDA-EPI method was also applied for metabolite profiling of three praziquantel analogs (PZ02, PZ07, PZ10) during the study of their metabolic stability. EICs of PZ02, PZ07, and PZ10 are shown in Figures 4, 6, and 8, respectively, and EPI spectra of representative detected metabolites are shown in Figures 5, 7, and 9, respectively. Nine metabolites of PZ02, including two de-hydrogenation (M1 and M2), four monohydroxylation (M3, M4, M5, and M6), two dioxidation metabolites (M7 and M8), and one metabolite with a combination of defluorination and dioxidation or a combination of dehydrogenenation and monohydroxylation (M9) were identified (Table 2 and Fig. 4).
Fig. 4.
Representative EICs obtained from a sample of PZ02 incubated with HLMs for 120 min using the MRM-IDA-EPI method for: (A) parent (349 m/z); (B) dehydrogenated metabolites (347 m/z); (C) monohydroxylated metabolites (365 m/z); (D) dihydroxylated metabolites (m/z 381); (E) defluorinated+dihydroxylated metabolites (363 m/z)
Fig. 6.
Representative EICs obtained from a sample of PZ07 incubated with HLMs for 120 min using the MRM-IDA-EPI method for: (A) parent (314 m/z); (B) dehydrogenated metabolites (312 m/z); (C) monohydroxylated metabolites (330 m/z); (D) dihydroxylated metabolites (346 m/z); (E) didehydrogenated metabolites (310 m/z); (F) hydrogenated+monohydroxylated metabolites or metabolites resulting from a gain of H2O (332 m/z)
Fig. 8.
Representative EICs obtained from a sample of PZ10 incubated with HLMs for 120 min using the MRM-IDA-EPI method for: (A) parent (350 m/z); (B) dehydrogenated metabolites (348 m/z); (C) monohydroxylated metabolites (366 m/z)
Fig. 5.
Representative EPI spectra of PZ02 and its three major metabolites: (A) parent; (B) M1; (C) M5; (D) M7
Fig. 7.
Representative EPI spectra of PZ07 and its five major metabolites: (A) parent; (B) M1; (C) M2; (D) M5; (E) M6; (F) M8
Fig. 9.
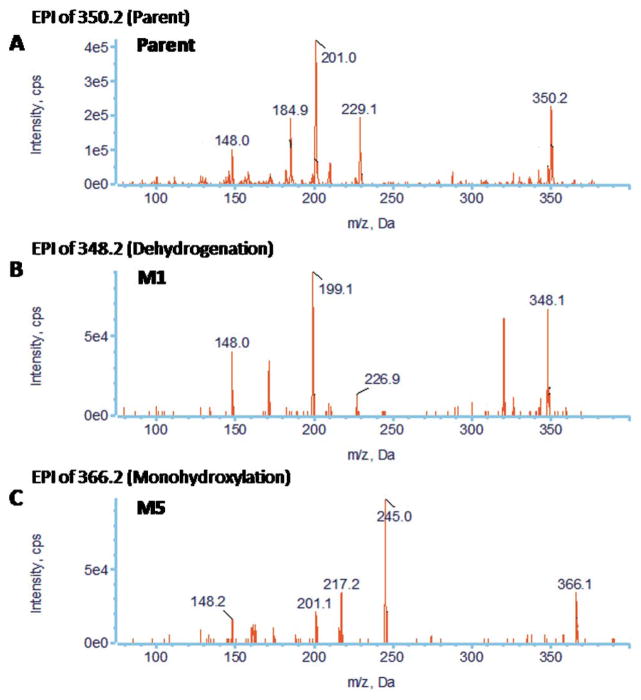
Representative EPI spectra of PZ10 and its two major metabolites: (A) parent; (B) M1; (C) M5
Based on the fragmentation pattern of the metabolites (Fig. 5), the positions of all nine metabolic modifications of PZ02 were proposed to be located in the 1,2,3,6,7,11b-hexahydro-4H-pyrazino(2,1-α)isoquinoline -4-one moiety (part A) (Fig. 4). Because PZ02 is a derivative of praziquantel in which the cyclohexyl moiety (part B) is fluorinated, the fluorine substitution is expected to prevent metabolism of part B of the molecule.
Similarly, ten metabolites of PZ07 were detected. As shown in Figure 6 and Table 2, four dehydrogenation (M1, M2, M3, and M4), three monohydroxylation (M5, M6, and M7), one dioxidation metabolite (M8), one didehydrogenation product (M9), and one metabolite (M10) resulting from a gain of H2O by either a combination of hydrogenation and monohydroxylation, or a combination of ring opening by dealkylation followed by a mono-hydroxylation. EPI spectra of PZ07 and its metabolites (M1, M2, M5, M6, and M8) are shown in Figure 7. Based on their fragmentation pattern, M1, M3, and M4 were proposed to be the product of dehydrogenation of the 1,2,3,6,7,11b-hexahydro-4H-pyrazino(2,1-α)isoquinoline-4-one moiety (part A), whereas M2 was proposed to be the product of dehydrogenated of the piperidinyl moiety (part B) (Fig. 6). For oxidative metabolites, M6 and M7 were proposed to be produced by monohydroxylation of part A, whereas M5 was proposed to be produced by monohydroxylation of part B of PZ07. Similarly, the metabolic modifications of M8 and M9 were proposed to occur in part B (Fig. 6).
Eight metabolites were detected for PZ10, including four dehydrogenation (M1, M2, M3, and M4) and four monohydroxylation metabolites (M5, M6, M7, and M8) (Fig. 8). Similar to PZ02, PZ10 is a derivative of PZ07, in which the cyclohexyl group is fluorinated. Therefore, the cyclohexyl group was expected to be metabolically protected and, indeed, all metabolic modifications were located in the 1,2,3,6,7,11b-hexahydro-4H-pyrazino(2,1-α)isoquinoline-4-one moiety (Part A) (Figs. 8 and 9).
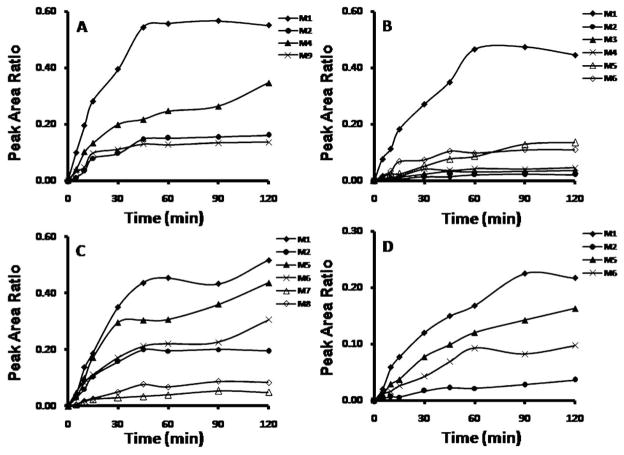
In addition to identification of the metabolites formed, semi-quantitative analyses were simultaneously performed to monitor the kinetics of the formation of major metabolites. Peak area ratios of major metabolites to that of the IS were plotted against the incubation time for praziquantel, PZ02, PZ07, and PZ10 (Fig. 10).
Fig. 10.
Peak area ratio (analyte/IS)-time profiles for the most abundant metabolites of: (A) praziquantel; (B) PZ02; (C) PZ07; (D) PZ10
Metabolic stability of praziquantel and its analogs
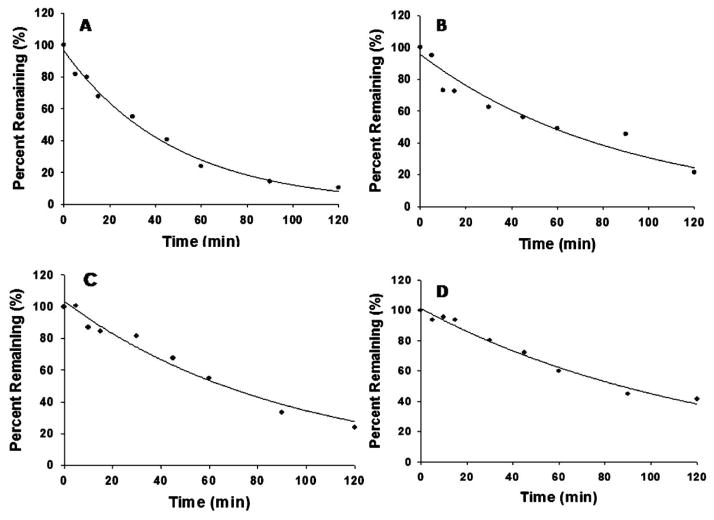
Metabolic stability of praziquantel and its analogs were studied by monitoring the disappearance of the parent compounds over 120 min after incubation with HLM. Concentrations of the parent compounds were calculated according to the peak area ratios of parent vs. IS using calibration curves prepared in HLM matrix for each compound. The disappearance of parent compounds was monitored by calculating the percent remaining of each compound compared to the concentration at 0 min, and that value was plotted against the incubation time (Fig. 11). The in vitro t1/2, microsomal CLint, hepatic CLint, extraction ratio (ER), and hepatic CL were calculated (Table 4). The microsomal and hepatic CLint, ER, and hepatic CL were in the order of praziquantel >PZ02>PZ07>PZ10. As expected, the two geminal difluoro-substituted analogs, PZ02 and PZ10, are more metabolically stable than their methylene counterparts (praziquantel and PZ07). Similarly, the metabolic stability increased markedly when exocyclic amide in praziquantel was replaced with urea in PZ07. In addition, combining both structural modifications in one compound (PZ10) further increased the metabolic stability.
Fig. 11.
Metabolic stability profiles (% turnover or amount remaining) for: (A) praziquantel; (B) PZ02; (C) PZ07; (D) PZ10
Table 4.
Metabolic stability parameters of praziquantel and its analogs as determined from incubation with HLM
| t1/2 (min) | CLint (μl/min/mg microsomal protein) | Hepatic CLint (ml/min) | ER | Hepatic CL (ml/min) | |
|---|---|---|---|---|---|
| Praziquantel | 33.5 | 41.4 | 2022.0 | 0.59 | 827.2 |
| PZ02 | 60.8 | 22.8 | 1113.6 | 0.44 | 620.2 |
| PZ07 | 63.0 | 22.0 | 1074.5 | 0.43 | 607.9 |
| PZ10 | 85.6 | 16.2 | 791.2 | 0.36 | 505.5 |
Simultaneous qualitative analysis did not affect quantification of the parent compounds during metabolic profiling studies
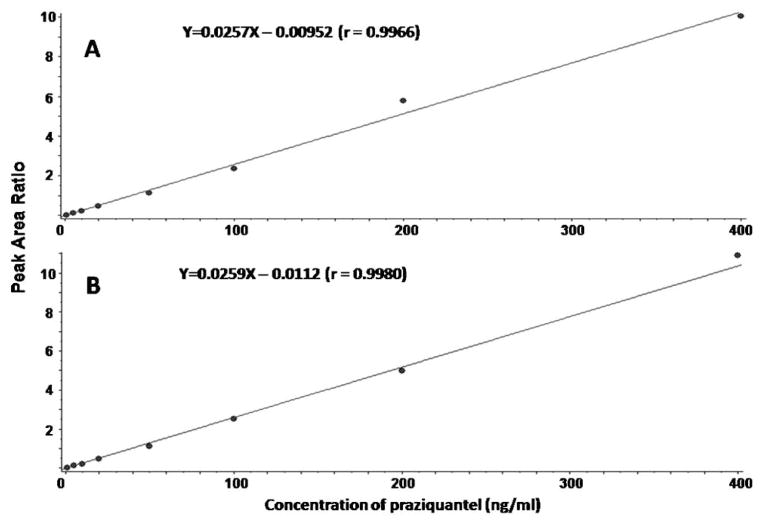
In addition to triggering EPI scans, the same MRM survey scans can be used for the absolute and semi-quantification of the parent compound and metabolites formed, respectively. In the present study, quantification of the parent compounds was not affected by the simultaneous acquisition of qualitative analysis for metabolite identification. Standard curves using the MRM-only and MRM-IDA-EPI approaches were compared to monitor the disappearance of praziquantel in our metabolic stability system. As shown in Figure 12, both methods provided linear calibration curves with similar intercept, slope, and R2 values. Therefore, robust quantification was achieved using the same MRM scans as those used as survey scans in the MRM-IDA-EPI qualitative method.
Fig. 12.
Calibration curves of praziquantel in the concentration range 0.5–400 ng/mL using: (A) MRM-only method; (B) MRM-IDA-EPI method
In conclusion, IDA LC-MS/MS analysis using a hybrid QqQLIT mass spectrometer can support simultaneous metabolic stability, metabolite profiling, and enzyme kinetic studies within the same chromatographic run. In the present study, MRM-IDA-EPI scans were used for simultaneous quantitative and qualitative analysis. MRM scans are more selective and sensitive than EMS, NL, MIM, and PI scans and therefore are more likely to detect low-abundance metabolites. Quantification of the parent compound disappearance to support metabolic stability studies was not compromised during this combined quantitative-qualitative approach. Calibration curves of praziquantel and its analogs obtained using MRM-IDA-EPI were similar and of the same quality as those obtained using MRM-only scans. This MRM-IDA-EPI approach was used to simultaneously identify the metabolites formed while quantifying the turnover of praziquantel and its analogs during in vitro metabolic stability studies. EPI spectra from the parent and potential metabolites were obtained during the same sample injection and these spectra were used to confirm the structures proposed for metabolites. In addition, the formation of major metabolites was also monitored, and this data could be used to study the kinetics of metabolite formation. Thus, this methodology integrates the quantitative analysis of parent compound disappearance, the semi-quantitative analysis of metabolite formation, and the identification of metabolites formed to simultaneously support metabolic stability, enzyme kinetics, and metabolic profiling studies.
Acknowledgments
The authors gratefully acknowledge Drs. Jonathan Vennerstrom, Qingjie Zhao, and Yuxiang Dong for useful comments and discussion throughout the course of the work described here.
References
- 1.Balani SK, Miwa GT, Gan LS, Wu JT, Lee FW. Strategy of utilizing in vitro and in vivo ADME tools for lead optimization and drug candidate selection. Curr Top Med Chem. 2005;5:1033–1038. doi: 10.2174/156802605774297038. [DOI] [PubMed] [Google Scholar]
- 2.Halladay JS, Wong S, Jaffer SM, Sinhababu AK, Khojasteh-Bakht SC. Metabolic stability screen for drug discovery using cassette analysis and column switching. Drug Metab Lett. 2007;1:67–72. doi: 10.2174/187231207779814364. [DOI] [PubMed] [Google Scholar]
- 3.Baranczewski P, Stanczak A, Sundberg K, Svensson R, Wallin A, Jansson J, Garberg P, Postlind H. Introduction to in vitro estimation of metabolic stability and drug interactions of new chemical entities in drug discovery and development. Pharmacol Rep. 2006;58:453–472. [PubMed] [Google Scholar]
- 4.Testa B. Drug metabolism for the perplexed medicinal chemist. Chem Biodivers. 2009;6:2055–2070. doi: 10.1002/cbdv.200900052. [DOI] [PubMed] [Google Scholar]
- 5.Testa B, Kramer SD. The biochemistry of drug metabolism—an introduction: part 5. Metabolism and bioactivity. Chem Biodivers. 2009;6:591–684. doi: 10.1002/cbdv.200900022. [DOI] [PubMed] [Google Scholar]
- 6.Masimirembwa CM, Bredberg U, Andersson TB. Metabolic stability for drug discovery and development: pharmacokinetic and biochemical challenges. Clin Pharmacokinet. 2003;42:515–528. doi: 10.2165/00003088-200342060-00002. [DOI] [PubMed] [Google Scholar]
- 7.Iwatsubo T, Hirota N, Ooie T, Suzuki H, Shimada N, Chiba K, Ishizaki T, Green CE, Tyson CA, Sugiyama Y. Prediction of in vivo drug metabolism in the human liver from in vitro metabolism data. Pharmacol Ther. 1997;73:147–171. doi: 10.1016/s0163-7258(96)00184-2. [DOI] [PubMed] [Google Scholar]
- 8.Brown HS, Griffin M, Houston JB. Evaluation of cryopreserved human hepatocytes as an alternative in vitro system to microsomes for the prediction of metabolic clearance. Drug Metab Dispos. 2007;35:293–301. doi: 10.1124/dmd.106.011569. [DOI] [PubMed] [Google Scholar]
- 9.Schmider J, von Moltke LL, Shader RI, Harmatz JS, Greenblatt DJ. Extrapolating in vitro data on drug metabolism to in vivo pharmacokinetics: evaluation of the pharmacokinetic interaction between amitriptyline and fluoxetine. Drug Metab Rev. 1999;31:545–560. doi: 10.1081/dmr-100101935. [DOI] [PubMed] [Google Scholar]
- 10.Kostiainen R, Kotiaho T, Kuuranne T, Auriola S. Liquid chromatography/atmospheric pressure ionization-mass spectrometry in drug metabolism studies. J Mass Spectrom. 2003;38:357–372. doi: 10.1002/jms.481. [DOI] [PubMed] [Google Scholar]
- 11.Venkatakrishnan K, von Moltke LL, Greenblatt DJ. Application of the relative activity factor approach in scaling from heterologously expressed cytochromes p450 to human liver microsomes: studies on amitriptyline as a model substrate. J Pharmacol Exp Ther. 2001;297:326–337. [PubMed] [Google Scholar]
- 12.Shibata Y, Takahashi H, Ishii Y. A convenient in vitro screening method for predicting in vivo drug metabolic clearance using isolated hepatocytes suspended in serum. Drug Metab Dispos. 2000;28:1518–1523. [PubMed] [Google Scholar]
- 13.Jouin D, Blanchard N, Alexandre E, Delobel F, David-Pierson P, Lave T, Jaeck D, Richert L, Coassolo P. Cryopreserved human hepatocytes in suspension are a convenient high throughput tool for the prediction of metabolic clearance. Eur J Pharm Biopharm. 2006;63:347–355. doi: 10.1016/j.ejpb.2006.01.014. [DOI] [PubMed] [Google Scholar]
- 14.Vergote V, Van Dorpe S, Peremans K, Burvenich C, De Spiegeleer B. In vitro metabolic stability of obestatin: kinetics and identification of cleavage products. Peptides. 2008;29:1740–1748. doi: 10.1016/j.peptides.2008.05.018. [DOI] [PubMed] [Google Scholar]
- 15.Godawska-Matysik A, Kiec-Kononowicz K. Biotransformation of praziquantel by human cytochrome p450 3A4 (CYP 3A4) Acta Pol Pharm. 2006;63:381–385. [PubMed] [Google Scholar]
- 16.Wiegand H, Wirz B, Schweitzer A, Camenisch GP, Rodriguez Perez MI, Gross G, Woessner R, Voges R, Arvidsson PI, Frackenpohl J, Seebach D. The outstanding metabolic stability of a 14C-labeled beta-nonapeptide in rats—in vitro and in vivo pharmacokinetic studies. Biopharm Drug Dispos. 2002;23:251–262. doi: 10.1002/bdd.334. [DOI] [PubMed] [Google Scholar]
- 17.Hintikka L, Kuuranne T, Leinonen A, Thevis M, Schanzer W, Halket J, Cowan D, Grosse J, Hemmersbach P, Nielen MW, Kostiainen R. Liquid chromatographic-mass spectrometric analysis of glucuronide-conjugated anabolic steroid metabolites: method validation and interlaboratory comparison. J Mass Spectrom. 2008;43:965–973. doi: 10.1002/jms.1434. [DOI] [PubMed] [Google Scholar]
- 18.Xia YQ, Miller JD, Bakhtiar R, Franklin RB, Liu DQ. Use of a quadrupole linear ion trap mass spectrometer in metabolite identification and bioanalysis. Rapid Commun Mass Spectrom. 2003;17:1137–1145. doi: 10.1002/rcm.1037. [DOI] [PubMed] [Google Scholar]
- 19.Li AC, Alton D, Bryant MS, Shou WZ. Simultaneously quantifying parent drugs and screening for metabolites in plasma pharmacokinetic samples using selected reaction monitoring information-dependent acquisition on a QTrap instrument. Rapid Commun Mass Spectrom. 2005;19:1943–1950. doi: 10.1002/rcm.2008. [DOI] [PubMed] [Google Scholar]
- 20.Dong Y, Chollet J, Vargas M, Mansour N, Bickle Q, Alnouti Y, Huang J, Kerser J, Vennerstrom JL. Praziquantel analogs with activity against juvenile Schistosoma mansoni. Bioorg Med Chem Lett. 2010;20:2481–2484. doi: 10.1016/j.bmcl.2010.03.001. [DOI] [PubMed] [Google Scholar]
- 21.Andrews P. Praziquantel: mechanisms of anti-schistosomal activity. Pharmacol Ther. 1985;29:129–156. doi: 10.1016/0163-7258(85)90020-8. [DOI] [PubMed] [Google Scholar]
- 22.Buhring KU, Diekmann HW, Muller H, Garbe A, Nowak H. Metabolism of praziquantel in man. Eur J Drug Metab Pharmacokinet. 1978;3:179–190. [Google Scholar]
- 23.Houston JB. Utility of in vitro drug metabolism data in predicting in vivo metabolic clearance. Biochem Pharmacol. 1994;47:1469–1479. doi: 10.1016/0006-2952(94)90520-7. [DOI] [PubMed] [Google Scholar]
- 24.Obach RS, Baxter JG, Liston TE, Silber BM, Jones BC, MacIntyre F, Rance DJ, Wastall P. The prediction of human pharmacokinetic parameters from preclinical and in vitro metabolism data. J Pharmacol Exp Ther. 1997;283:46–58. [PubMed] [Google Scholar]
- 25.Heinemann A, Wischhusen F, Puschel K, Rogiers X. Standard liver volume in the Caucasian population. Liver Transpl Surg. 1999;5:366–368. doi: 10.1002/lt.500050516. [DOI] [PubMed] [Google Scholar]
- 26.Wilkinson GR, Shand DG. Commentary: a physiological approach to hepatic drug clearance. Clin Pharmacol Ther. 1975;18:377–390. doi: 10.1002/cpt1975184377. [DOI] [PubMed] [Google Scholar]
- 27.Shou WZ, Magis L, Li AC, Naidong W, Bryant MS. A novel approach to perform metabolite screening during the quantitative LC-MS/MS analyses of in vitro metabolic stability samples using a hybrid triple-quadrupole linear ion trap mass spectrometer. J Mass Spectrom. 2005;40:1347–1356. doi: 10.1002/jms.917. [DOI] [PubMed] [Google Scholar]
- 28.Anari MR, Sanchez RI, Bakhtiar R, Franklin RB, Baillie TA. Integration of knowledge-based metabolic predictions with liquid chromatography data-dependent tandem mass spectrometry for drug metabolism studies: application to studies on the biotransformation of indinavir. Anal Chem. 2004;76:823–832. doi: 10.1021/ac034980s. [DOI] [PubMed] [Google Scholar]
- 29.Gao H, Materne OL, Howe DL, Brummel CL. Method for rapid metabolite profiling of drug candidates in fresh hepatocytes using liquid chromatography coupled with a hybrid quadrupole linear ion trap. Rapid Commun Mass Spectrom. 2007;21:3683–3693. doi: 10.1002/rcm.3257. [DOI] [PubMed] [Google Scholar]
- 30.Yao M, Ma L, Humphreys WG, Zhu M. Rapid screening and characterization of drug metabolites using a multiple ion monitoring-dependent MS/MS acquisition method on a hybrid triple quadrupole-linear ion trap mass spectrometer. J Mass Spectrom. 2008;43:1364–1375. doi: 10.1002/jms.1412. [DOI] [PubMed] [Google Scholar]


