

Abstract
Background
Computed tomography (CT) scanning has emerged as an effective means of early detection for lung cancer. Despite marked improvement over earlier methodologies, the low level of specificity demonstrated by CT scanning has limited its clinical implementation as a screening tool. A minimally-invasive biomarker-based test that could further characterize CT-positive patients based on risk of malignancy would greatly enhance its clinical efficacy.
Methods
We performed an analysis of 81 serum proteins in 92 patients diagnosed with lung cancer and 172 CT-screened control individuals. We utilize a series of bioinformatics algorithms including Metropolis-Monte Carlo, artificial neural networks, Naïve Bayes, and additive logistic regression to identify multimarker panels capable of discriminating cases from controls with high levels of sensitivity and specificity in distinct training and independent validation sets.
Results
A three-biomarker panel comprised of MIF, prolactin, and thrombospondin identified using the Metropolis-Monte Carlo algorithm provided the best classification with a %Sensitivity/Specificity/Accuracy of 74/90/86 in the training set and 70/93/82 in the validation set. This panel was effective in the classification of control individuals demonstrating suspicious pulmonary nodules and stage I lung cancer patients.
Conclusions
The selected serum biomarker panel demonstrated a high diagnostic utility in the current study and performance characteristics which compare favorably with previous reports. Further advancements may lead to the development of a diagnostic tool useful as an adjunct to CT-scanning.
Keywords: Lung cancer, NSCLC, diagnosis, serum biomarkers, CT-scanning
1. Introduction
The early detection of lung cancer, a devastating disease which accounts for more deaths in the US annually than prostate, breast and colorectal cancer combined [1], presents an opportunity to dramatically reduce disease mortality and greatly benefit overall public health. Non-small cell lung carcinomas (NSCLC) represent the vast majority of lung cancers and while the overall five-year survival for patients with this diagnosis is a disappointing 15%, five-year survival for those patients diagnosed with stage IA NSCLC typically exceeds 60% [2]. For these patients, effective treatment includes surgical resection accompanied by lymph node dissection [3]. A number of techniques, including thoracic radiography, sputum cytology, and computed tomography (CT), are currently being evaluated as diagnostic tools for lung cancer. The efficacy of these tools has been examined in clinical trials and while thoracic radiography and sputum cytology have failed to perform with adequate levels of sensitivity (SN) for early-stage disease [4,5], CT imaging has emerged as an effective technique in several studies [6,7]. The limitations of CT scanning are also well documented, the most prominent of which is the high identification rate of benign pulmonary nodules [8,9]. Such findings greatly reduce the specificity (SP) of CT, exacerbating the already high cost of the technology and leading to unnecessary patient anxiety and surveillance. Thus remains the need to identify additional effective methodologies.
Based on the demonstrated diagnostic utility of CT-scanning, this method is currently being evaluated as a population-based screening tool for lung cancer. Investigators participating in the National Lung Screening Trial [10], a randomized multicenter trial involving more than 53,000 current and former smokers, recently released findings indicating a 20% reduction in lung cancer death in individuals screened by low-dose helical CT versus standard chest x-ray [11]. These encouraging findings illustrate the promise offered by CT-based screening if certain limitations inherent to the technique can be successfully overcome. Although specific guidelines regarding the minimum levels of SN/SP required of any lung cancer diagnostic test have yet to be established, improvement upon currently demonstrated levels of SN/SP is certain to be a prerequisite for advancement. The FDA does cite specific criteria for effective screening in reference to the use of CT in pulmonary cancer [12]. Among these criteria, proposed by investigators at the Cleveland Clinic [13], is the requirement that any screening test directed at a disease with a prevalence of 5% or less must detect pre-clinical disease with a SN exceeding 95% when the SP is less than or equal to 95%, and vice versa. Current estimates place the prevalence of lung cancer in high-risk groups at 1–3% [9,14], well below the 5% threshold, while the overall SN/SP of CT screening in this setting was recently reported at 90/92.6 [15]. Thus, a second-line test of sufficient accuracy might augment the performance of CT and provide a basis for an effective and efficient screening strategy.
The use of biomarker measurements as tools for early detection is a promising research innovation currently being applied to a number of human cancers. In lung cancer, biomarker evaluations have been conducted in serum, tissue, and sputum, with serum being the least invasive and hence, most desirable testing matrix. Several serum biomarkers, including CEA, Cyfra 21-1, TPA, squamous cell carcinoma antigen (SCC), stem cell factor (SCF), GM-CSF, and VEGF have demonstrated associations with NSCLC, however each of these has failed to demonstrated the requisite SN and SP to warrant clinical development as diagnostic tools [16–20]. Recently, a number of additional factors present in serum have been evaluated for their potential efficacy as lung cancer biomarkers. Such factors include E-cadherin, ICAM-1, E-Selectin [21], SAA [22], uPAR [23], HMGB1 [24], and angiopoietin-1 [25]. The disappointing performance of individual biomarkers and the emergence of additional biomarker candidates have led several investigators to develop multianalyte panels in hopes of achieving superior levels of SN and SP. A number of such panels comprised of both circulating proteins [26,27] and tumor-associated autoantibodies[28,29] have been evaluated in lung cancer with encouraging results. Here we report our evaluation of a diverse set of circulating proteins in the sera of patients diagnosed with NSCLC and several sets of age-, gender-, and smoking history-matched controls.
2. Materials and methods
2.1. Study population
Our initial training set included 62 patients diagnosed with primary lung cancer (93% NSCLC) evaluated at the UPCI Hillman Cancer Center. The enrollment of these patients was administered by the University of Pittsburgh lung cancer SPORE. Each of these patients was diagnosed with biopsy-proven untreated primary lung cancer and was consented to the UPCI Lung Research Registry, a University of Pittsburgh Institutional Review Board (IRB) approved clinical research protocol. Clinical specimens were annotated with clinical and demographic information including tumor histology, stage, pulmonary functional findings, gender, age at diagnosis, and smoking history. All blood samples were obtained prior to treatment or surgery. The NSCLC training set was compared to 142 control individuals enrolled in the Pittsburgh Lung Screening Study (PLuSS) [9]. Each NSCLC case was matched to a PLuSS control on the basis of age, gender, and smoking history and additional PLuSS controls within the range of these parameters were randomly selected to improve study power. The validation set consisted of 30 randomly and independently selected primary lung cancer cases and 30 unmatched PLuSS controls, enrolled in the same manner as the training set (Table 1). All blood samples were collected, processed, aliquoted, and stored according to a rigorous protocol. A 50 ml non-fasting peripheral blood sample was collected from each subject in the absence of anticoagulant using standard phlebotomy procedures for the preparation of serum. Serum aliquots were prepared and cryopreserved at −80°C and all aliquots used in this study were not thawed prior to the time of testing. All individual biomarker analyses and development of multianalyte panels were restricted to the training set while samples designated for the validation set were blinded until study completion.
Table 1.
Clinical characteristics of study population
| Age range (median) | Gender | Smoking status | Histology | Path stage | |
|---|---|---|---|---|---|
| Training Set | |||||
| NSCLC n = 62 | 46–88 (68) | M = 31 F = 31 |
Current = 20 Former = 41 Unknown = 1 |
Adeno = 33 SCC = 29 |
IA/IB = 28 IIA/IIB = 8 IIIA/IIIB = 10 Unknown = 16 |
| PLuSS Controls n = 142 | 50–79 (64.5) | M = 78 F = 64 |
Current = 44 Former = 93 Unknown = 5 |
NMPN 0–3 mm = 85 NMPN 4–7 mm = 45 NMPN 8–20 mm = 11 Unknown nodule status = 1 |
|
| Validation Set | |||||
| Lung Cancer n = 30 | 38–88 (70) | M = 14 F = 16 |
Current = 12 Former = 17 Unknown = 1 |
NSCLC = 25 Adeno = 10 SCC = 7 NOS = 8 Small cell/pleomorphic = 5 |
IA/IB = 17 IIA/IIB = 3 IIIA/IIIB = 9 IV = 1 |
| PLuSS Controls n = 30 | 50–79 (55) | M = 12 F = 18 |
Current = 17 Former = 13 |
NMPN 4–7 mm = 15 NMPN 8–20 mm = 15 |
|
Adeno: adenocarcinoma; SCC: squamous cell carcinoma; NOS: not otherwise specified (undifferentiated); NMPN: nonmalignant pulmonary nodule.
2.2. Biomarker analysis
Sera were evaluated for levels of 81 cancer-related protein biomarkers (Table 2) using multiplexed bead-based immunoassays as previously described [30].
Table 2.
Complete list of evaluated biomarkers
| Biomarker class | Biomarkers |
|---|---|
| Tumor markers | AFP, CA 15-3, CA 19-9, CA 72-4, CEA, HE4, Mesothelin, SCC |
| Inflammatory mediators | Adiponectin, CD40L (TRAP), Eotaxin-1, GROα, IL-1Rα, IL-2R, IL-6, IL-6R, IL-8, IP-10, Leptin, LIF, MCP-1, MCP-3, MIF, MPO, RANTES, SAA, sE-Selectin, TNF-α, TNF-RI, TNF-RII |
| Growth/Angiogenenesis factors and receptors | Angiostatin, bFGF, EGF, EGFR, ErbB2, G-CSF, HGF, IGFBP-1, M-CSF, NGF, PDGF-BB, SCF, SCGF-B, SDF-1a, Thrombospondin, VEGF |
| Adhesion molecules and proteases | Kallikrein 10, MMP-1, MMP-7, MMP-8, MMP-9, MMP-12, sI-CAM, sV-CAM, tPAI, TIMP-1, TIMP-2, TIMP-3, TIMP-4 |
| Apoptosis mediators | Cyfra 21-1, DR5, sFas, sFasL, TRAIL |
| Hormones | ACTH, FSH, GH, Insulin, LH, Prolactin, PTH, TSH |
| Bone Factors | Osteocalcin (OC), Osteopontin (OPN), Osteoprotegerin (OPG) |
| Other proteins | HSP 70, MICA, Resistin, TTR, ULBP-1, ULBP-2 |
The biomarker list was compiled based on a literature review of current proteins of interest within all fields related to lung cancer research. Biomarkers were selected from this list on the basis of suitable bead-based immunoassay availability. Each sample was tested in duplicate in order to assess the intra-assay reproducibility of biomarker measurements. Observed differences in the circulating concentrations of each biomarker were evaluated by the Mann-Whitney non-parametric U test. The minimum level of significance was p < 0.01 and the false discovery rate (FDR) was controlled at 5% according to the method of Benjamini and Hochberg [31]. To examine the interdependence of observed biomarker levels, the results were partitioned according to subject group (PLuSS, NSCLC) and the Spearman’s rank correlation coefficient was computed between all pairs of markers [32]. A significance threshold of p < 0.00005 was used to identify significant correlations, as this threshold yields zero significant correlations when the data are randomly permuted. This conservative estimate is intended to reduce the chances of identifying spurious correlations.
2.3. Multivariate bionformatics analysis
We applied four separate classification algorithms, termed Metropolis-Monte Carlo (MMC) [30], Naïve Bayes (NB) [33], Artificial Neural Network (ANN) [34], and Additive Logistic Regression (ALR) [35] to the development of multianalyte panels capable of discriminating NSCLC cases from PLuSS or Benign controls. For the development of panels in the Training set, the level of specificity was controlled at 90% to facilitate the identification of panels offering the highest levels of SN. Each algorithm minimizes the number of biomarkers selected to avoid overfitting bias. Panels consisting of 2–6 biomarkers were developed, and the optimal panel for the discrimination of NSCLC from PLuSS controls in the training set was subsequently applied to the validation set.
3. Results
Of the 81 serum proteins evaluated in our study, 25 were found to differ significantly between the NSCLC and control group (Table 3). The biomarker measurements displayed a high level of intra-assay reproducibility with CVs below 10% in each case, with the exception of ULBP-1 (Supplementary Table S1). Eight biomarkers were significantly higher in the NSCLC group, while 17 were significantly lower. The five most significant biomarkers in this analysis (p < 0.0001) included macrophage migration inhibitory factor (MIF), transthyretin (TTR), thrombospondin (THSP), soluble vascular cell adhesion molecule 1 (sVCAM-1), and tissue plasminogen activator inhibitor 1 (tPAI-1).
Table 3.
Serum biomarker levels in patients diagnosed with NSCLC and PLuSS controls
| Marker | NSCLC (n = 62)
|
PLuSS (n = 142)
|
NSCLC vs PLuSS | ||
|---|---|---|---|---|---|
| Median | Range | Median | Range | p-value† | |
| MIF | 313.2 | 59–2062 | 105.4 | 12–1595 | 5.05E-13 (I) |
| TTR‡ | 4251 | 2056–7341 | 5204 | 2929–8628 | 1.45E-07 (D) |
| Thrombospondin‡ | 4216 | 826–13409 | 5698 | 511–46092 | 1.57E-06 (D) |
| sV-CAM‡ | 953.8 | 264–2276 | 1120 | 627–2617 | 0.00003 (D) |
| tPAI-1 | 42724 | 16560–99864 | 54907 | 16499–136408 | 0.00007 (D) |
| RANTES | 21546 | 5472–47377 | 26388 | 8705–89749 | 0.00010 (D) |
| Cyfra 21–21 | 335.7 | 209–1743 | 312.6 | 230–5615 | 0.00014 (I) |
| Prolactin | 12634 | 3579–240272 | 8927 | 3238–57404 | 0.00023 (I) |
| SDF-1a | 2957 | 253–5060 | 3540 | 606–6260 | 0.00024 (D) |
| TRAIL | 27.85 | 2–2359 | 65.10 | 3–232 | 0.00028 (D) |
| sE-Selectin | 46588 | 18012–98627 | 60429 | 1027–316547 | 0.00032 (D) |
| SAA‡ | 1499 | 235–54083 | 855.9 | 139–64319 | 0.00046 (I) |
| PDGF-BB | 6544 | 1142–11258 | 7394 | 1216–13676 | 0.00099 (D) |
| sFasL | 39.10 | 13–315 | 52.30 | 10–1349 | 0.00107 (D) |
| EGFR | 16734 | 1160–26550 | 18898 | 1770–383822 | 0.00188 (D) |
| IGFBP-1 | 15353 | 2498–131095 | 9973 | 1299–118800 | 0.00204 (I) |
| MCP-1 | 900 | 399–6493 | 1159 | 368–4142 | 0.00224 (D) |
| ErbB2 | 2056 | 92–4786 | 2275 | 245–12266 | 0.00319 (D) |
| IL-1Ra | 93.85 | 1–3206 | 35.90 | 1–4474 | 0.00543 (I) |
| TIMP-2 | 98991 | 38157–154882 | 105915 | 40311–198826 | 0.00661 (D) |
| Eotaxin | 194.7 | 13–1117 | 235.6 | 43–620 | 0.00674 (D) |
| HE4 | 4154 | 1001–914714 | 3183 | 525–681053 | 0.00687 (I) |
| IL-2R | 407.7 | 57–8751 | 317.6 | 53–5824 | 0.00716 (I) |
| ACTH | 8.90 | 2–161 | 13.90 | 2–1097 | 0.00816 (D) |
| Angiostatin‡ | 681.1 | 418–1160 | 737.3 | 380–1330 | 0.00869 (D) |
p-value determined by Mann-Whitney U test with the False Discovery Rate (FDR) controlled at 5%.
Median values expressed in ng/ml, all other expressed in pg/ml
I: increased in NSCLC group; D: decreased in NSCLC group.
The Spearman’s rank correlation coefficient analysis of the biomarker data revealed several correlations among the evaluated biomarkers in each subject group (Fig. 1). In the PLuSS group, a network of biomarker interdependence was identified in which multiple factors were correlated either directly or indirectly through intermediaries. THSP and RANTES were found to be correlated in both the PLuSS and the NSCLC group, however all other correlations were group dependent.
Fig. 1.
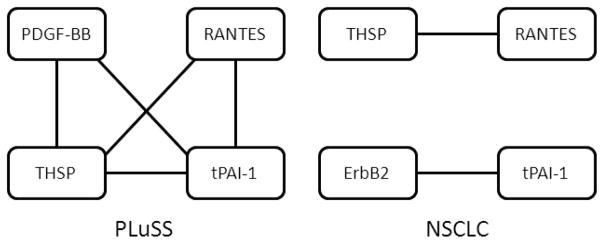
Biomarker correlations. Individual biomarker levels were partitioned according to subject group (PLuSS, benign, NSCLC) and Spearman’s rank correlation coefficient was computed between to identify networks of markers within each group. The topology of each network is presented wherein correlated biomarkers are connected by a solid line. Biomarkers connected by multiple lines share a dependence on a third analyte. A significance threshold of p < 0.00005 was used to identify significant correlations. Levels of all tested biomarkers were included in this analysis and the absence of any particular biomarker implies a lack of significant correlation with any other biomarker.
When the four classifier algorithms were applied to the training set results, several multimarker panels capable of discriminating the NSCLC group from the PLuSS controls were selected (Table 4). The MMC algorithm identified a 3-biomarker panel consisting of MIF, PRL, and THSP which demonstrated a SN of 74% at 90% SP. The NB and ANN algorithms each identified a six-biomarker panel with SN values of 75% and 76%, respectively at a SP of 90%. Each of these panels consisted of MIF, PRL, SAA, TTR, and RANTES, while the NB and ANN panels also included THSP and Cyfra 21-1, respectively. A four biomarker panel consisting of MIF, PRL, THSP, and ErbB2 was identified by the ARL algorithm which displayed a SN of 70% at a SP of 90%. Overall accuracy for each of the panels in the training set was similar (85–87%). As the MMC, NB, and ANN derived panels all performed similarly in the training set, the MMC-derived panel of MIF, PRL, and THSP was selected for further analysis on the basis of parsimony.
Table 4.
Multianalyte panels which discriminate NSCLC from PLuSS controls
| Algorithm | Panel | Training set
|
Validation set
|
||||
|---|---|---|---|---|---|---|---|
| SN | SP | ACC | SN | SP | ACC | ||
| MMC | MIF, PRL, THSP | 74 | 90 | 86 | 70 | 93 | 82 |
| NB | MIF, PRL, THSP, SAA, TTR, RANTES | 75 | 90 | 87 | NA | ||
| ANN | MIF, PRL, Cyfra 21-1, SAA, TTR, RANTES | 76 | 90 | 85 | NA | ||
| ALR | MIF, PRL, THSP, ErbB2 | 70 | 90 | 86 | NA | ||
Algorithm: NB: naïve Bayes; ANN: artificial neural network; MMC: Metropolis-Monte Carlo; ALR: additive logistic regression; Biomarkers: MIF: macrophage migration inhibitory factor; PRL: prolactin; THSP: thrombospondin; tPAI-1: tissue plasminogen activator inhibitor 1; CK19: cytokeratin 19; SAA: serum amyloid A; TTR: transthryretin; Values: SN: sensitivity; SP: specificity; ACC: accuracy, all values expressed as percentage.
The MIF, PRL, THSB panel and algorithm was next applied to the validation set. Here, each validation serum was assigned a diagnosis based on algorithm parameters and this diagnosis was compared to the actual diagnosis after unblinding. Performance in the validation set was similar to that observed in the training set yielding SN/SP/ACC values of 70/93/82 (Table 4). The performance of the selected panel in the training and validation sets was evaluated by ROC analysis (Fig. 2). The MIF, PRL, THSB panel provided an AUC = 0.850 (95CI: 0.823–0.934) in the training set and an AUC = 0.894 (95CI: 0.810–0.979) in the validation set. The ROC analysis was used to evaluate SP at the elevated levels of SN required of a second-line diagnostic test. At a SN of 90%, 95%, and 98%, the panel provided SPs of 56%, 40%, and 30%, respectively.
Fig. 2.

ROC analysis of selected multimarker panel. A multimarker panel consisting of MIF, PRL, and THSP was identified by MMC analysis of data collected for 81 circulating proteins in 62 NSCLC patients and 142 matched, CT-screened controls. A distinct set of 20 additional NSCLC patients and 30 matched, CT-screened controls was utilized for validation of the selected panel. ROC analysis was performed using GraphPad PRISM (La Jolla, CA), area under the curve (AUC) values with 95% confidence intervals are provided for each set. Performance in the training set is represented by the solid line, while performance in the training set is represented by the dashed line.
The performance of the MIF, PRL, THSP panel was further evaluated within several subsets of our cohort (Table 5). The model was extremely effective in the correct classification of control individuals that demonstrated pulmonary nodules of low, moderate, and high suspicion, and correctly classified 64–65% of Stage I NSCLC in each set. With the exception of the SCC patients, represented by only 7 individuals in the validation set, performance within the control and NSCLC subgroups was similar in both the training and validation sets.
Table 5.
Performance of MIF, PRL, THSP panel in selected patient/control groups
| Training set | Validation set | |
|---|---|---|
| Lung Cancer Patients | ||
| NSCLC, Adeno | 25/33 (75.8%) | 7/10 (70%) |
| NSCLC, SCC | 21/29 (72.4%) | 4/7 (57.1%) |
| NSCLC, NOS | NA | 6/8 (75%) |
| Small cell/pleomorphic | NA | 4/5 (80%) |
| Stage I | 18/28 (64.3%) | 11/17 (64.7%) |
| Controls | ||
| No nodule/benign nodule (1–3 mm) | 74/85 (87%) | NA |
| Low suspicion nodule (4–7 mm) | 43/45 (95.6%) | 15/15 (100%) |
| Moderate/high suspicion nodule (8–20 mm) | 11/11 (100%) | 13/15 (86.7%) |
Values represent the proportions of each subset that were correctly classified as lung cancer patients or controls (% correct in parentheses); Test specificity was 90% in the training set and 93% in the validation set.
Adeno: adenocarcinoma; SCC: squamous cell carcinoma; NOS: not otherwise specified (undifferentiated).
4. Discussion
The biomarker alterations identified in our analysis include known tumor markers, growth and angiogenic factors, several classes of inflammatory mediators, adipokines, apoptosis-related factors, adhesion molecules, and hormones. The diversity of our findings are reflective of the variety of molecular alterations observed in lung cancers including those involving components of receptor tyrosine kinase signaling, angiogenesis pathways, apoptosis regulation, and cell cycle control. In addition to the identification of factors originating from the tumor itself, our approach is also uniquely designed to measure systemic protein alterations derived from the tumor microenvironment and host response. Protein alterations originating from these distinct biological compartments do not necessarily correlate with each other and are thus more likely to provide complementary information resulting in improved diagnostic utility. To the best of our knowledge, 6 of the 25 biomarker alterations we observed have not been previously reported with regard to association with NSCLC. These include alterations in sV-CAM, SDF-1α, TRAIL, PDGF-BB, HE4, and angiostatin. We identified a number of biomarkers demonstrating significant correlations within our subject cohort. These observations were based solely on the biomarker measurements performed in this analysis and additional study will be required to confirm, validate, and characterize the presence of such correlations. However, the absence of significant correlations among the vast majority of biomarkers included within our multianalyte panels is suggestive of their complementary performance and combined diagnostic utility. It should be noted that the conservative approach taken herein does not rule out the existence of additional, less significant biomarker correlations.
The top performing multianalyte panels selected by our bioinformatic algorithms represent various combinations of eight protein biomarkers. This list of eight biomarkers recapitulates the advantageous nature of combining factors likely to originate from the tumor (PRL, ErbB2, Cyfra 21-1), the stromal microenvironment (MIF, THSP), and the host response (SAA, TTR, RANTES, PRL). While each of these proteins has been previously evaluated in sera of lung cancer patients, the current investigation represents the first reported study of THSP, PRL, and RANTES as diagnostic biomarkers. Although PRL is classically viewed as a pituitary hormone with functional roles in lactation and reproduction, expanded pathological roles are the subject of intense investigation. Such investigations include large epidemiological studies which conclusively characterize PRL as a risk factor in breast cancer (reviewed in [36]). Experimental evidence also strongly suggests the expression of PRL in non-pituitary tissues and normal peripheral blood lymphocytes (reviewed in [37]). This expression, likely driven by a distinct extrapituitary gene promoter, has been associated with breast, prostate, and gynecological tumor development [38–40]. THSP is an endogenous inhibitor of angiogenesis and its production and delivery by platelets represents a critical host response mechanism during tumorigenesis [41]. This mechanism is supported by the observation that while tissue expression of THSP occurs at low levels in NSCLC [42], circulating levels of this protein hold considerable prognostic information [43]. The chemokine RANTES (CCL5) has been previously implicated as mediator of tumor cell migration and invasion in lung cancer [44,45].
Several of the biomarkers included in our multimarker panels have been characterized previously for diagnostic potential. Overexpression of the multifunctional cytokine MIF has been associated with an increased risk of recurrence and decreased overall survival in lung cancer [46,47]. MIF has also been shown to stimulate angiogenic and pro-inflammatory effects in an autocrine manner in NSCLC [48,49], and is currently the focus of targeted therapeutic development [50]. The combined use of serum levels of MIF and SAA was recently utilized in the classification of NSCLC from controls with limited efficacy [51]. SAA was also identified using SELDI-TOF MS as part of a 17-protein signature capable of discriminating lung cancer cases from controls with a high level of SN and SP [52]. Elsewhere, serum levels of SAA were associated with advanced disease and poor prognosis [53,54]. In several other recent studies, serum levels of TTR could discriminate lung cancer from controls with a SN/SP of 78.5/77.5 [55], while Cyfra 21-1 along with 5 other serum biomarkers accurately classified 85% of NSCLC patients and high-risk individuals [56]. Cyfra 21-1 has been previously characterized as a marker of squamous cell carcinoma of the lung with potential utility in predicting treatment response [57]. Although a number of studies have concluded that erbB2 provides only limited diagnostic information for lung cancer when used alone, its use as a negative prognostic indicator has been well documented [58–60].
In the current study, the combined evaluation of a broad array of cancer-associated serum proteins along with several distinct bioinformatic approaches has led to the identification of a multimarker panel which demonstrates proof-of-principle for the development of biomarker based diagnostic tools for NSCLC. The diagnostic capability of the approach described herein meets or exceeds several recent reports regarding the use of biomarker panels in lung cancer diagnosis in terms of SN, SP, and accuracy, and the relatively small size of the optimal panel of MIF, PRL and THSP coupled with the overall flexibility of our classification algorithm make the current strategy an attractive alternative for clinical development [27,61,62]. The MMC algorithm has also been successfully applied in two recent studies regarding the diagnosis of ovarian cancer [30,63]. The performance demonstrated by our selected panel in the current study does not reach the level recommended by the FDA for a successful diagnostic test for lung cancer. Thus, this panel would not serve as an effective standalone test. However, a second-line test utilizing these biomarkers, utilized as an adjunct to CT-scanning, may prove effective. In this setting, a diagnostic biomarker panel must perform at a maximal level of SN to ensure that all cases are promptly referred for pathologic examination while maintaining a suitable level of SP in order to reduce the number of false positive test results generated by CT. The MIF, PRL, THSP panel indentified here provided levels of SP ranging from 30–56% at SNs greater than 90%, illustrating its potential. Further evaluation of this panel should be designed to examine its ability to classify highly suspicious CT-identified nodules as cancer or benign. Although the consistent selection of PRL and THSP by each of our evaluated algorithms represents a significant step forward in the development of diagnostic protein signatures, the identification of additional useful biomarkers will be required to achieve a performance worthy of clinical development. Upon further validation and optimization, serum biomarker panels could provide an effective means of further assessing the malignant potential of patients designated as having a high risk for lung cancer on the basis of CT findings.
Supplementary Material
Acknowledgments
Grant support
This work was supported in part by a program project grant from the Ovarian Cancer Research Fund (http://www.ocrf.org) to A.L., project Co-Leader.
List of Abbreviations
- ACC
accuracy
- ALR
additive logistic regression
- ANN
artificial neural network
- AUC
area under receiver operator characteristic curve
- CEA
carcinoembryonic antigen
- CT
computed tomography
- CV
coefficient of variation
- FDR
false discovery rate
- GM-CSF
granulocyte macrophage colony stimulating factor
- HE4
human epididymus protein 4HMGB-1 – high mobility group protein B1
- ICAM-1
inter-cellular adhesion molecule 1
- MIF
macrophage migration inhibitory factor
- MMC
Metropolis-Monte Carlo algorithm
- NB
naïve Bayes algorithm
- NSCLC
non-small cell lung cancer
- PDGF-BB
platelet derived growth factor – BB
- PLuSS
Pittsburgh lung screening study
- PRL
prolactin
- ROC
receiver operator characteristic curve
- SAA
serum amyloid A
- SCC
squamous cell carcinoma antigen
- SCF
stem cell factor
- SDF-1a
stromal cell derived factor 1 alpha
- SN
sensitivity
- SP
specificity
- sVCAM-1
soluble vascular cell adhesion molecule 1
- THSP
thrombospondin
- TPA
tissue polypeptide antigen
- tPAI-1
tissue plasminogen activator inhibitor 1
- TTR
transthyretin
- ULBP-1
UL16 binding protein-1
- uPAR
urokinase plasminogen activator receptor
- VEGF
vascular endothelial growth factor
References
- 1.Greenlee RT, Murray T, Bolden S, Wingo PA. Cancer statistics. CA Cancer J Clin. 2000;50:7–33. doi: 10.3322/canjclin.50.1.7. [DOI] [PubMed] [Google Scholar]
- 2.Mulshine JL, Sullivan DC. Clinical practice. Lung cancer screening. N Engl J Med. 2005;352:2714–2720. doi: 10.1056/NEJMcp042630. [DOI] [PubMed] [Google Scholar]
- 3.Lu C, Soria JC, Tang X, et al. Prognostic factors in resected stage I non-small-cell lung cancer: a multivariate analysis of six molecular markers. J Clin Oncol. 2004;22:4575–4583. doi: 10.1200/JCO.2004.01.091. [DOI] [PubMed] [Google Scholar]
- 4.Chanin TD, Merrick DT, Franklin WA, Hirsch FR. Recent developments in biomarkers for the early detection of lung cancer: perspectives based on publications 2003 to present. Curr Opin Pulm Med. 2004;10:242–247. doi: 10.1097/01.mcp.0000130321.11513.13. [DOI] [PubMed] [Google Scholar]
- 5.Hirsch FR, Brambilla E, Gray N, et al. Prevention and early detection of lung cancer-clinical aspects. Lung Cancer. 1997;17:163–174. doi: 10.1016/s0169-5002(97)00033-0. [DOI] [PubMed] [Google Scholar]
- 6.Henschke CI, McCauley DI, Yankelevitz DF, et al. Early Lung Cancer Action Project: overall design and findings from baseline screening. Lancet. 1999;354:99–105. doi: 10.1016/S0140-6736(99)06093-6. [DOI] [PubMed] [Google Scholar]
- 7.Sone S, Takashima S, Li F, et al. Mass screening for lung cancer with mobile spiral computed tomography scanner. Lancet. 1998;351:1242–1245. doi: 10.1016/S0140-6736(97)08229-9. [DOI] [PubMed] [Google Scholar]
- 8.Welch HG, Woloshin S, Schwartz LM, et al. Overstating the evidence for lung cancer screening: the International Early Lung Cancer Action Program (I-ELCAP) study. Arch Intern Med. 2007;167:2289–2295. doi: 10.1001/archinte.167.21.2289. [DOI] [PubMed] [Google Scholar]
- 9.Wilson DO, Weissfeld JL, Fuhrman CR, et al. The Pittsburgh Lung Screening Study (PLuSS): outcomes within 3 years of a first computed tomography scan. Am J Respir Crit Care Med. 2008;178:956–961. doi: 10.1164/rccm.200802-336OC. [DOI] [PMC free article] [PubMed] [Google Scholar]
- 10.Aberle DR, Berg CD, Black WC, et al. The National Lung Screening Trial: overview and study design. Radiology. 2011;258:243–253. doi: 10.1148/radiol.10091808. [DOI] [PMC free article] [PubMed] [Google Scholar]
- 11.National Cancer Institute. [Accessed April 2011];2010 at http://www.cancer.gov/newscenter/pressreleases/2010/NLSTresultsRelease.
- 12.U.S. Food and Drug Administration. [Accessed August, 2010]; at www.fda.gov.
- 13.Obuchowski NA, Graham RJ, Baker ME, Powell KA. Ten criteria for effective screening: their application to multi-slice CT screening for pulmonary and colorectal cancers. AJR Am J Roentgenol. 2001;176:1357–1362. doi: 10.2214/ajr.176.6.1761357. [DOI] [PubMed] [Google Scholar]
- 14.Diederich S, Wormanns D, Semik M, et al. Screening for early lung cancer with low-dose spiral CT: prevalence in 817 asymptomatic smokers. Radiology. 2002;222:773–781. doi: 10.1148/radiol.2223010490. [DOI] [PubMed] [Google Scholar]
- 15.Toyoda Y, Nakayama T, Kusunoki Y, Iso H, Suzuki T. Sensitivity and specificity of lung cancer screening using chest low-dose computed tomography. Br J Cancer. 2008;98:1602–1607. doi: 10.1038/sj.bjc.6604351. [DOI] [PMC free article] [PubMed] [Google Scholar]
- 16.Buccheri G, Torchio P, Ferrigno D. Clinical equivalence of two cytokeratin markers in mon-small cell lung cancer: a study of tissue polypeptide antigen and cytokeratin 19 fragments. Chest. 2003;124:622–632. doi: 10.1378/chest.124.2.622. [DOI] [PubMed] [Google Scholar]
- 17.Greenberg AK, Lee MS. Biomarkers for lung cancer: clinical uses. Curr Opin Pulm Med. 2007;13:249–255. doi: 10.1097/MCP.0b013e32819f8f06. [DOI] [PubMed] [Google Scholar]
- 18.Pastor A, Menendez R, Cremades MJ, Pastor V, Llopis R, Aznar J. Diagnostic value of SCC, CEA and CYFRA 21.1 in lung cancer: a Bayesian analysis. Eur Respir J. 1997;10:603–609. [PubMed] [Google Scholar]
- 19.Rapellino M, Niklinski J, Pecchio F, et al. CYFRA 21-1 as a tumour marker for bronchogenic carcinoma. Eur Respir J. 1995;8:407–410. doi: 10.1183/09031936.95.08030407. [DOI] [PubMed] [Google Scholar]
- 20.Schneider J. Tumor markers in detection of lung cancer. Adv Clin Chem. 2006;42:1–41. doi: 10.1016/s0065-2423(06)42001-1. [DOI] [PubMed] [Google Scholar]
- 21.Gogali A, Charalabopoulos K, Zampira I, et al. Soluble adhesion molecules E-cadherin, ICAM-1 and E-selectin as lung cancer biomarkers. Chest. 2010 doi: 10.1378/chest.10-0157. [DOI] [PubMed] [Google Scholar]
- 22.Cremona M, Calabro E, Randi G, et al. Elevated levels of the acute-phase serum amyloid are associated with heightened lung cancer risk. Cancer. 2010;116:1326–1335. doi: 10.1002/cncr.24868. [DOI] [PubMed] [Google Scholar]
- 23.Almasi CE, Hoyer-Hansen G, Christensen IJ, Pappot H. Prognostic significance of urokinase plasminogen activator receptor and its cleaved forms in blood from patients with non-small cell lung cancer. APMIS. 2009;117:755–761. doi: 10.1111/j.1600-0463.2009.02533.x. [DOI] [PubMed] [Google Scholar]
- 24.Shang GH, Jia CQ, Tian H, et al. Serum high mobility group box protein 1 as a clinical marker for non-small cell lung cancer. Respir Med. 2009;103:1949–1953. doi: 10.1016/j.rmed.2009.05.019. [DOI] [PubMed] [Google Scholar]
- 25.Park JH, Choi H, Kim YB, et al. Serum angiopoietin-1 as a prognostic marker in resected early stage lung cancer. Lung Cancer. 2009;66:359–364. doi: 10.1016/j.lungcan.2009.03.002. [DOI] [PubMed] [Google Scholar]
- 26.Molina R, Filella X, Auge JM, et al. Tumor markers (CEA, CA 125, CYFRA 21-1, SCC and NSE) in patients with non-small cell lung cancer as an aid in histological diagnosis and prognosis. Comparison with the main clinical and pathological prognostic factors. Tumour Biol. 2003;24:209–218. doi: 10.1159/000074432. [DOI] [PubMed] [Google Scholar]
- 27.Patz EF, Jr, Campa MJ, Gottlin EB, Kusmartseva I, Guan XR, Herndon JE., 2nd Panel of serum biomarkers for the diagnosis of lung cancer. J Clin Oncol. 2007;25:5578–5583. doi: 10.1200/JCO.2007.13.5392. [DOI] [PubMed] [Google Scholar]
- 28.Farlow EC, Patel K, Basu S, et al. Development of a Multiplexed Tumor-Associated Autoantibody-Based Blood Test for the Detection of Non-Small Cell Lung Cancer. Clin Cancer Res. 2010 doi: 10.1158/1078-0432.CCR-09-3192. [DOI] [PubMed] [Google Scholar]
- 29.Wu LL, Chang WJ, Zhao J, et al. Development of Autoantibody Signatures as Novel Diagnostic Biomarkers of Non-Small Cell Lung Cancer. Clin Cancer Res. 2010 doi: 10.1158/1078-0432.CCR-10-0193. [DOI] [PubMed] [Google Scholar]
- 30.Yurkovetsky Z, Skates S, Lomakin A, et al. Development of a multimarker assay for early detection of ovarian cancer. J Clin Oncol. 2010;28:2159–2166. doi: 10.1200/JCO.2008.19.2484. [DOI] [PMC free article] [PubMed] [Google Scholar]
- 31.Benjamini Y, Hochberg Y. Controlling the false discovery rate: a practical and powerful approach to multiple testing. Journal of the Royal Statistical Society, Series B (Methodological) 1995;57:289–300. [Google Scholar]
- 32.Maritz JS. Distribution-Free Statistical Methods. Chapman and Hall; 1981. [Google Scholar]
- 33.Mitchell T. Machine Learning. McGraw Hill; 1997. [Google Scholar]
- 34.Moody J, Darken C. Fast learning in networks of locally-tuned processing units. Neural Computation. 1989;1:281–294. [Google Scholar]
- 35.Friedman J, Hastie T, Tibshirani R. Additive logistic regression: a statistical view of boosting. Annals of Statistics. 2000;28:337–407. [Google Scholar]
- 36.Bernichtein S, Touraine P, Goffin V. New concepts in prolactin biology. J Endocrinol. 2010;206:1–11. doi: 10.1677/JOE-10-0069. [DOI] [PubMed] [Google Scholar]
- 37.Ben-Jonathan N, Liby K, McFarland M, Zinger M. Prolactin as an autocrine/paracrine growth factor in human cancer. Trends in Endocrinology and Metabolism: TEM. 2002;13:245–250. doi: 10.1016/s1043-2760(02)00603-3. [DOI] [PubMed] [Google Scholar]
- 38.Li H, Ahonen TJ, Alanen K, et al. Activation of signal transducer and activator of transcription 5 in human prostate cancer is associated with high histological grade. Cancer Res. 2004;64:4774–4782. doi: 10.1158/0008-5472.CAN-03-3499. [DOI] [PubMed] [Google Scholar]
- 39.McHale K, Tomaszewski JE, Puthiyaveettil R, Livolsi VA, Clevenger CV. Altered expression of prolactin receptor-associated signaling proteins in human breast carcinoma. Mod Pathol. 2008;21:565–571. doi: 10.1038/modpathol.2008.7. [DOI] [PubMed] [Google Scholar]
- 40.Levina VV, Nolen B, Su Y, et al. Biological significance of prolactin in gynecologic cancers. Cancer Res. 2009;69:5226–5233. doi: 10.1158/0008-5472.CAN-08-4652. [DOI] [PMC free article] [PubMed] [Google Scholar]
- 41.Zaslavsky A, Baek KH, Lynch RC, et al. Platelet-derived thrombospondin-1 is a critical negative regulator and potential biomarker of angiogenesis. Blood. 2010;115:4605–4613. doi: 10.1182/blood-2009-09-242065. [DOI] [PMC free article] [PubMed] [Google Scholar]
- 42.Mascaux C, Martin B, Paesmans M, et al. Expression of thrombospondin in non-small cell lung cancer. Anticancer Res. 2002;22:1273–1277. [PubMed] [Google Scholar]
- 43.Yamaguchi M, Sugio K, Ondo K, Yano T, Sugimachi K. Reduced expression of thrombospondin-1 correlates with a poor prognosis in patients with non-small cell lung cancer. Lung Cancer. 2002;36:143–150. doi: 10.1016/s0169-5002(01)00470-6. [DOI] [PubMed] [Google Scholar]
- 44.Borczuk AC, Papanikolaou N, Toonkel RL, et al. Lung adenocarcinoma invasion in TGFbetaRII-deficient cells is mediated by CCL5/RANTES. Oncogene. 2008;27:557–564. doi: 10.1038/sj.onc.1210662. [DOI] [PMC free article] [PubMed] [Google Scholar]
- 45.Huang CY, Fong YC, Lee CY, et al. CCL5 increases lung cancer migration via PI3K, Akt and NF-kappaB pathways. Biochem Pharmacol. 2009;77:794–803. doi: 10.1016/j.bcp.2008.11.014. [DOI] [PubMed] [Google Scholar]
- 46.White ES, Flaherty KR, Carskadon S, et al. Macrophage migration inhibitory factor and CXC chemokine expression in non-small cell lung cancer: role in angiogenesis and prognosis. Clin Cancer Res. 2003;9:853–860. [PubMed] [Google Scholar]
- 47.Liu Q, Yang H, Zhang SF. Expression and significance of MIF and CD147 in non-small cell lung cancer. Sichuan Da Xue Xue Bao Yi Xue Ban. 2010;41:85–90. [PubMed] [Google Scholar]
- 48.McClelland M, Zhao L, Carskadon S, Arenberg D. Expression of CD74, the receptor for macrophage migration inhibitory factor, in non-small cell lung cancer. Am J Pathol. 2009;174:638–646. doi: 10.2353/ajpath.2009.080463. [DOI] [PMC free article] [PubMed] [Google Scholar]
- 49.Hamatake M, Yoshino I, Tomiyasu M, et al. Intratumoral expression of macrophage migration inhibitory factor is correlated with serum C-reactive protein and interleukin-6 in patients with non-small cell lung cancer. Surg Today. 2008;38:921–925. doi: 10.1007/s00595-008-3765-z. [DOI] [PubMed] [Google Scholar]
- 50.Winner M, Meier J, Zierow S, et al. A novel, macrophage migration inhibitory factor suicide substrate inhibits motility and growth of lung cancer cells. Cancer Res. 2008;68:7253–7257. doi: 10.1158/0008-5472.CAN-07-6227. [DOI] [PMC free article] [PubMed] [Google Scholar]
- 51.Khan N, Cromer CJ, Campa M, Patz EF., Jr Clinical utility of serum amyloid A and macrophage migration inhibitory factor as serum biomarkers for the detection of nons-mall cell lung carcinoma. Cancer. 2004;101:379–384. doi: 10.1002/cncr.20377. [DOI] [PubMed] [Google Scholar]
- 52.Sreseli RT, Binder H, Kuhn M, et al. Identification of a 17-protein signature in the serum of lung cancer patients. Oncol Rep. 2010;24:263–270. doi: 10.3892/or_00000855. [DOI] [PubMed] [Google Scholar]
- 53.Cho WC, Yip TT, Cheng WW, Au JS. Serum amyloid A is elevated in the serum of lung cancer patients with poor prognosis. Br J Cancer. 2010;102:1731–1735. doi: 10.1038/sj.bjc.6605700. [DOI] [PMC free article] [PubMed] [Google Scholar]
- 54.Liu DH, Wang XM, Zhang LJ, et al. Serum amyloid A protein: a potential biomarker correlated with clinical stage of lung cancer. Biomed Environ Sci. 2007;20:33–40. [PubMed] [Google Scholar]
- 55.Liu L, Liu J, Dai S, et al. Reduced transthyretin expression in sera of lung cancer. Cancer Sci. 2007;98:1617–1624. doi: 10.1111/j.1349-7006.2007.00576.x. [DOI] [PMC free article] [PubMed] [Google Scholar]
- 56.Farlow EC, Vercillo MS, Coon JS, et al. A multi-analyte serum test for the detection of non-small cell lung cancer. Br J Cancer. 2010 doi: 10.1038/sj.bjc.6605865. [DOI] [PMC free article] [PubMed] [Google Scholar]
- 57.Wieskopf B, Demangeat C, Purohit A, et al. Cyfra 21-1 as a biologic marker of non-small cell lung cancer. Evaluation of sensitivity, specificity, and prognostic role. Chest. 1995;108:163–169. doi: 10.1378/chest.108.1.163. [DOI] [PubMed] [Google Scholar]
- 58.Abdel Salam I, Gaballa HE, Abdel Wahab N. Serum levels of epidermal growth factor and HER-2 neu in non small-cell lung cancer: prognostic correlation. Med Oncol. 2009;26:161–166. doi: 10.1007/s12032-008-9102-y. [DOI] [PubMed] [Google Scholar]
- 59.Ardizzoni A, Cafferata MA, Paganuzzi M, et al. Study of pretreatment serum levels of HER-2/neu oncoprotein as a prognostic and predictive factor in patients with advanced nonsmall cell lung carcinoma. Cancer. 2001;92:1896–1904. [PubMed] [Google Scholar]
- 60.Filiberti R, Marroni P, Paganuzzi M, et al. c-erbB-2 protein in serum of primary lung cancer patients. Cancer Detect Prev. 2002;26:64–68. doi: 10.1016/s0361-090x(02)00014-4. [DOI] [PubMed] [Google Scholar]
- 61.Ostroff RM, Bigbee WL, Franklin W, et al. Unlocking biomarker discovery: large scale application of aptamer proteomic technology for early detection of lung cancer. PLoS One. 2010;5:e15003. doi: 10.1371/journal.pone.0015003. [DOI] [PMC free article] [PubMed] [Google Scholar]
- 62.Xiao T, Ying W, Li L, et al. An approach to studying lung cancer-related proteins in human blood. Mol Cell Proteomics. 2005;4:1480–1486. doi: 10.1074/mcp.M500055-MCP200. [DOI] [PubMed] [Google Scholar]
- 63.Nolen B, Velikokhatnaya L, Marrangoni A, et al. Serum biomarker panels for the discrimination of benign from malignant cases in patients with an adnexal mass. Gynecol Oncol. 2010;117:440–445. doi: 10.1016/j.ygyno.2010.02.005. [DOI] [PMC free article] [PubMed] [Google Scholar]
Associated Data
This section collects any data citations, data availability statements, or supplementary materials included in this article.