Abstract
Hepatocellular carcinoma develops in either chronically injured or seemingly intact livers. To explore the tumorigenic mechanisms underlying these different conditions, we compared the mRNA expression profiles of mouse hepatocellular tumors induced by the repeated injection of CCl4 or a single diethylnitrosamine (DEN) injection using a cDNA microarray. We identified tumor-associated genes that were expressed differentially in the cirrhotic CCl4 model (H19, Igf2, Cbr3, and Krt20) and the non-cirrhotic DEN model (Tff3, Akr1c18, Gpc3, Afp, and Abcd2) as well as genes that were expressed comparably in both models (Ly6d, Slpi, Spink3, Scd2, and Cpe). The levels and patterns of mRNA expression of these genes were validated by quantitative RT-PCR analyses. Most of these genes were highly expressed in mouse livers during the fetal/neonatal periods. We also examined the mRNA expression of these genes in mouse tumors induced by thioacetamide, another cirrhotic inducer, and those that developed spontaneously in non-cirrhotic livers and found that they shared a similar expression profile as that observed in CCl4-induced and DEN-induced tumors, respectively. There was a close relationship between the expression levels of Igf2 and H19 mRNA, which were activated in the cirrhotic models. Our results show that mouse liver tumors reactivate fetal/neonatal genes, some of which are specific to cirrhotic or non-cirrhotic modes of pathogenesis.
Keywords: Hepatocellular carcinoma, insulin-like growth factor 2, liver cirrhosis, mRNA expression, trefoil factor 3
Various risk factors for hepatocellular carcinoma (HCC) exist, including infection with hepatitis B virus (HBV) and hepatitis C virus, alcoholic and non-alcoholic fatty liver disease, and several hereditary metabolic diseases.1 However, chronic liver injury, typically cirrhosis, is the most important and common setting for the development of HCC. Although recent studies have revealed critical roles of the interleukin-6/JAK/STAT pathway and the nuclear factor-κB pathway, and the possible involvement of the inflammasome, the exact mechanisms underlying the development of HCC in chronic liver disease remain obscure.2 Furthermore, a small fraction of HCC has been known to occur in patients with a seemingly intact liver. Such non-cirrhotic HCC may share several characteristics with hepatocellular adenoma,3 which has been shown to undergo malignant transformation with an overall frequency of 4.2%.4 There might be different tumorigenic mechanisms between tumors associated with chronic injury or cirrhosis and those that develop in seemingly intact livers.
A variety of mouse models of hepatocarcinogenesis have been used to elucidate the mechanisms underlying the development of HCC. The most widely used is the diethylnitrosamine (DEN)-induced model,5 in which hepatocellular adenoma and HCC develop in an intact, non-cirrhotic liver. Several liver tumor-prone transgenic mouse lines have also been generated by the introduction of HBsAg and HBx,6 SV40 large T antigen, a secretable form of epidermal growth factor (EGF),7 or oncogenes such as E2F-1, c-Myc, and transforming growth factor-α.8 In these models, liver tumors also developed in non-cirrhotic livers; thus, the results that were obtained need to be interpreted cautiously when they are extrapolated for understanding the pathogenesis of human HCC that develops in fibrotic or cirrhotic backgrounds. Conversely, long-standing centrilobular injury inflicted by the chronic administration of CCl4 or thioacetamide (TAA) in adult mice can induce liver tumors in a fully established cirrhotic background.9,10
In the present study, to gain insights into the tumorigenic mechanisms in cirrhotic and non-cirrhotic conditions, we compared the mRNA expression profiles of mouse liver tumors induced by the repeated injection of CCl4 (cirrhotic protocol) or a single DEN injection when the mice were 2 weeks old (non-cirrhotic protocol) using a cDNA microarray and quantitative RT-PCR (RT-qPCR). We identified several genes whose mRNA expression was increased predominantly in either CCl4-induced or DEN-induced liver tumors as well as genes that were increased comparably in both. We further examined the mRNA expression of the identified genes, most of which were also highly expressed in the fetal/neonatal liver, in other mouse liver tumors induced under cirrhotic and non-cirrhotic conditions.
Materials and Methods
Animals
C3H/HeNCr1Cr1j (C3H) and C57BL/6J (C57) mice were purchased from Charles River Laboratories Japan (Yokohama, Japan). C3H × C57 F1 offspring were generated by breeding male C3H and female C57 mice. The mice were killed under deep anesthesia, and the livers were removed for further examination. The protocols used for animal experimentation were approved by the Animal Research Committee, Asahikawa Medical University (Asahikawa, Japan), and all animal experiments adhered to the criteria outlined in the Guide for the Care and Use of Laboratory Animals prepared by the National Academy of Sciences (8th edn, 2011).
Mouse liver tumor models
Male C3H × C57 F1 or C57 mice (8–10-weeks old) were treated with CCl4 (Kanto Chemical, Tokyo, Japan) three times per week (1 mL/kg, s.c.; 1:5 dilution in olive oil) for 24 weeks to induce liver cirrhosis and subsequent tumor formation. Male C3H × C57 F1 mice were also treated with TAA (Sigma-Aldrich, St. Louis, MO, USA) (0.03% in drinking water) for 30 weeks to generate another cirrhotic model of liver tumors.
To induce liver tumors in a non-cirrhotic background, C3H × C57 F1 mice were treated with a necrotizing dose of DEN (5 mg/kg, i.p.) at 2 weeks after birth and killed after 44 weeks. As another non-cirrhotic model, liver tumors that had spontaneously developed in C3H mice aged 13–15 months were analyzed.11
cDNA microarray analysis
Total RNA was prepared from snap-frozen liver tissues using the RNeasy Mini Kit (Qiagen, Chatsworth, CA). Samples of CCl4-induced liver tumors (a mixture of five independent large tumors), DEN-induced liver tumors (a mixture of five independent large tumors), CCl4-induced cirrhotic liver tissues (non-tumorous tissues of livers harboring tumors, a mixture of five tissues from five mice), and control liver tissue (olive oil-treated; a mixture of two tissues from two mice) were analyzed and compared by one-color microarrays (3D-Gene Microarray; Toray, Tokyo, Japan). After background subtraction, the raw microarray data were normalized using a standard global normalization technique, and the signal intensities were calculated as the fold changes of expression values. The data of differentially expressed genes that were significantly changed (>4-fold, compared with control) were subjected to Z-score transformation and loaded in a centroid-linkage hierarchical clustering assay using a Pearson correlation (uncentered) similarity metric with Cluster 3.0. Then, the Java TreeView software (http://jtreeview.sourceforge.net/) was applied to reveal the hierarchical gene groups among the four samples. The Z-score was cropped to −1.5 to +1.5 when generating a two-color heat map.
Quantitative RT-PCR
Total RNA were extracted from frozen liver tissues and subjected to RT-qPCR analyses. Quantitative RT-PCR was carried out using the ΔΔCt method with FastStart Universal SYBR Green Master Mix (Roche Diagnostics, Mannheim, Germany). Each reaction was carried out in duplicate, and the mRNA levels were normalized to Gapdh. The sequences of the specific primers are listed in Table S1. Two-dimensional hierarchal clustering of tumor-associated genes was carried out using Z-score-normalized data. The Z-score was cropped to −2.0 to +2.0 when generating a two-color heat map.
Microscopic examination, immunohistochemistry, and in situ hybridization
The livers were fixed in phosphate-buffered 10% formalin for 24 h, and paraffin sections were then prepared. Immunohistochemical staining was carried out with the EnVision/HRP system (Dako, Carpinteria, CA, USA) on deparaffinized sections treated with Target Retrieval Solution (Dako). The antibodies used were as follows: anti-insulin-like growth factor 2 (IGF2) (ab9574; Abcam, Cambridge, UK), anti-α-fetoprotein (AFP) (14550-1-AP, for mouse tissues; Proteintech Group, Chicago, IL, USA), anti-AFP (A0008, for human tissues; Dako), and anti-trefoil factor 3 (TFF3) (Abbiotec, San Diego, CA, USA). 3,3′-Diaminobenzidine tetrahydrochloride (Vector Laboratories, Burlingame, CA, USA) was used for signal detection. For the detection of the TFF3 peptide, we applied signal amplification using the TSA Plus DIG Kit (PerkinElmer, Waltham, MA, USA). In situ hybridization for non-coding H19 mRNA was carried out on deparaffinized sections using the mouse H19 QuantiGene ViewRNA Probe Set (VB6-16706; Affymetrix, Santa Clara, CA, USA) and the QuantiGene ViewRNA ISH Tissue Assay Kit (Affymetrix).
Human liver samples
The retrospective analysis of surgical specimens was approved by the internal review board of Asahikawa Medical University. A total of 33 HCC samples from patients who had curative hepatectomy and five intact liver tissues surrounding the resected cavernous hemangiomas were collected. Among the HCC samples, nine cases were devoid of any detectable fibrosis or inflammation in the non-tumorous liver parenchyma, whereas the rest showed various degrees of liver fibrosis (fibrous expansion of the portal tract, bridging fibrosis, and cirrhosis).
Statistical analysis
Unpaired two-tailed t-tests or one-way anova were used to compare differences in gene expression. The correlation between Ki-67 staining and the mRNA levels of genes was assessed by Spearman’s correlation coefficients. Fisher’s exact test was used to evaluate the differences in expression of various proteins in HCC samples between the groups with and without liver fibrosis.
Results
cDNA microarray analyses of differentially expressed genes in CCl4-induced and DEN-induced mouse liver tumors
Following repeated injections of CCl4, numerous relatively small tumors appeared in the markedly fibrotic and cirrhotic liver parenchyma, whereas in the DEN model, multiple large tumors developed in the non-cirrhotic background (Fig.1a). Histologically, both CCl4- and DEN-induced tumors were hepatocyte tumors, with features of hepatocellular adenoma and well-differentiated HCC (Fig.1b). The surrounding non-tumorous liver tissues were cirrhotic in the CCl4 model but were almost normal and non-cirrhotic in the DEN model, as revealed by Sirius Red staining (Fig.1b). The cDNA microarray analysis identified 1028 differentially expressed genes in the intact liver tissues (control), CCl4-induced cirrhotic tissues (non-tumor, NT) (CCl4-NT), CCl4-induced tumors (CCl4-T), and DEN-induced tumors (DEN-T) across genetic clusters A–D (Fig.1c). Several genes, such as S100g, Cyp4a14, and Mmp7, were selectively activated in cirrhotic tissues (CCl4-NT), while the expression of others, such as Fabp6 and Plat, was increased in both CCl4-NT and CCl4-T (Table S2). We focused on the tumor-associated genes that were highly expressed in either CCl4- or DEN-induced tumors (Tables2).
Figure 1.
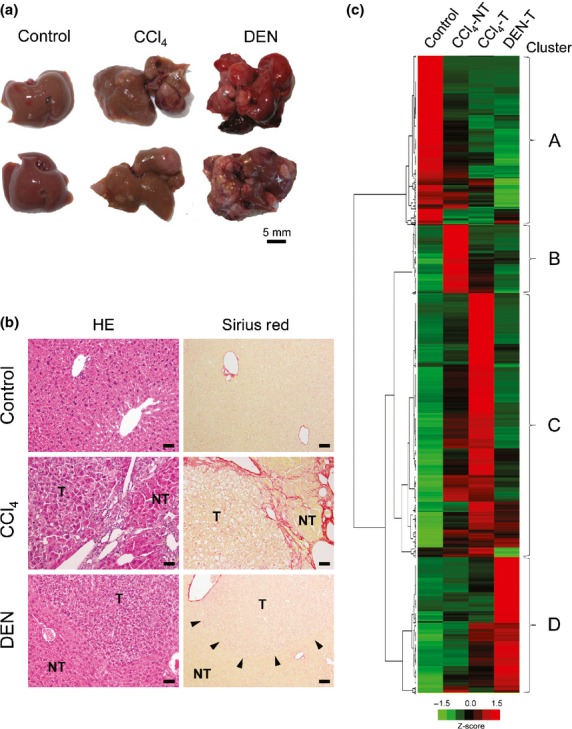
Identification of differentially expressed genes in mouse liver tumors induced in cirrhotic and non-cirrhotic models. (a) Gross appearance of livers from control (olive oil-treated, 32-week-old), CCl4-treated (32-week-old), and diethylnitrosamine (DEN)-treated (46-week-old) mice. (b) Histology of the liver tissues from control, CCl4-treated, and DEN-treated mice; HE and Sirius Red staining. NT, non-tumor; T, tumor. Arrowheads indicate the boundary of a DEN-induced tumor. Scale bar = 50 μm. (c) cDNA microarray analysis showing genetic clusters (A–D) of differentially expressed genes in control liver tissues (olive oil-treated), CCl4-induced cirrhotic tissues (CCl4-NT), CCl4-induced tumors (CCl4-T), and DEN-induced tumors (DEN-T).
Table 2.
Top 10 highly expressed genes in diethylnitrosamine (DEN)-induced tumors in genetic cluster D
| Gene | Fold change vs control (log2) | ||
|---|---|---|---|
| Cirrhosis (CCl4-NT) | CCl4 tumor (CCl4-T) | DEN tumor (DEN-T) | |
| Glypican 3 (Gpc3) | 2.63 | 6.06 | 8.62 |
| Aldo-keto reductase family 1, member C18 (Akr1c18) | 3.26 | 6.44 | 8.57 |
| Flavin containing monooxygenase 3 (Fmo3) | 0.60 | 1.90 | 7.33 |
| ATP-binding cassette, sub-family D, member 2 (Abcd2) | 3.89 | 4.90 | 7.32 |
| Tetraspanin 8 (Tspan8) | 3.92 | 6.29 | 7.23 |
| Alpha fetoprotein (Afp) | 4.19 | 4.47 | 7.11 |
| Trefoil factor 3, intestinal (Tff3) | 0.91 | 6.30 | 6.98 |
| Serine peptidase inhibitor, Kazal type 3 (Spink3) | 6.68 | 6.22 | 6.92 |
| Patatin-like phospholipase domain containing 5 (Pnpla5) | 1.94 | 3.88 | 6.53 |
| Cyclin-dependent kinase inhibitor 2B (Cdkn2b) | 1.84 | 4.73 | 5.96 |
DEN-T, DEN-induced tumor; CCl4-NT, CCl4-induced cirrhotic tissue (non-tumor); CCl4-T, CCl4-induced tumor.
Table 1.
Top 10 highly expressed genes in CCl4-induced tumors in genetic cluster C
| Gene | Fold change vs control (log2) | ||
|---|---|---|---|
| Cirrhosis (CCl4-NT) | CCl4 tumor (CCl4-T) | DEN tumor (DEN-T) | |
| Insulin-like growth factor 2 (Igf2) | 6.97 | 9.70 | 3.06 |
| Lymphocyte antigen 6 complex, locus D (Ly6d) | 6.46 | 8.33 | 6.55 |
| Carboxypeptidase E (Cpe) | 3.77 | 8.21 | 7.68 |
| H19 fetal liver mRNA (H19) | 5.48 | 8.13 | 6.47 |
| Secretory leukocyte peptidase inhibitor (Slpi) | 3.52 | 6.92 | 6.35 |
| Keratin 20 (Krt20) | 4.70 | 6.83 | 4.41 |
| Stearoyl-Coenzyme A desaturase 2 (Scd2) | 4.86 | 6.51 | 5.65 |
| Topoisomerase (DNA) II alpha (Top2a) | 5.03 | 6.18 | 3.89 |
| Calcium and integrin binding family member 3 (Cib3) | 3.76 | 6.15 | 3.58 |
| Carbonyl reductase 3 (Cbr3) | 2.55 | 6.04 | 2.35 |
DEN-T, diethylnitrosamine-induced tumor; CCl4-NT, CCl4-induced cirrhotic tissue (non-tumor); CCl4-T, CCl4-induced tumor.
Validation of mRNA expression profiles by RT-qPCR and in situ detection of IGF2, H19 mRNA, TFF3, and AFP in tumors
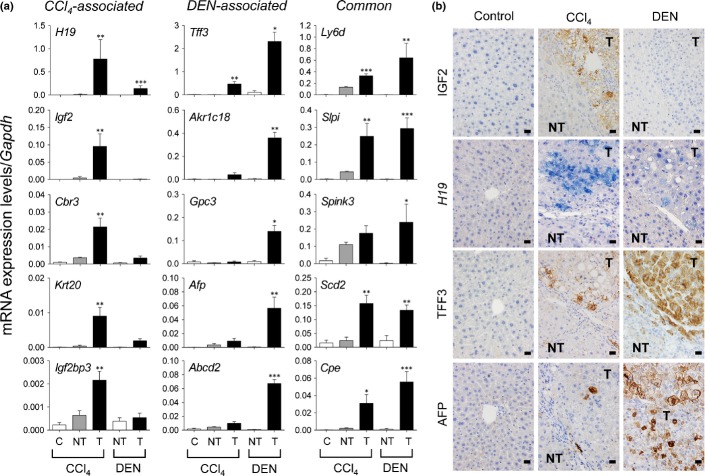
The levels and patterns of mRNA expression of the identified genes were validated by RT-qPCR analyses. The mRNA expression of H19, Igf2, Cbr3, and Krt20 was predominantly increased in CCl4-induced tumors (more than 4-fold that observed in DEN-induced tumors; referred to as CCl4-associated); that of Tff3, Akr1c18, Gpc3, Afp, and Abcd2 was predominantly increased in DEN-induced tumors (more than 4-fold over that in CCl4-induced tumors; referred to as DEN-associated), and that of Ly6d, Slpi, Spink 3, Scd2, and Cpe was increased at comparable levels in CCl4- and DEN-induced tumors (referred to as Common) (Fig.2a). The changes in mRNA expression observed in the remaining genes (Cib3, Top2a, Cdkn2b, Pnpla5, and Tspan8) in the tumors were not statistically significant (Fig. S1).
Figure 2.
Differential expression of mRNA and their products in CCl4-induced and diethylnitrosamine (DEN)-induced liver tumors. (a) Quantitative RT-PCR analyses of mRNA expression of 15 tumor-associated genes. The genes preferentially expressed in CCl4-induced tumors and DEN-induced tumors are designated “CCl4-associated” and “DEN-associated,” respectively, and those comparatively expressed in CCl4-induced and DEN-induced tumors are designated “Common.” Each value is expressed as the mean ± SEM. The ages of the mice at analyses were 32–34 weeks and 46 weeks in the CCl4-induced and DEN-induced models, respectively. The number of samples in each group was 5, 12, 15, 6, and 13 for CCl4 control (olive oil, C), CCl4-induced cirrhosis (NT), CCl4-induced tumors (T), DEN control (NT), and DEN-induced tumors (T), respectively. *P < 0.05, **P < 0.01, ***P < 0.001 versus control; one-way factorial anova. (b) In situ detection of insulin-like growth factor 2 (IGF2), H19 mRNA, trefoil factor 3 (TFF3), and α-fetoprotein (AFP) in CCl4-induced and DEN-induced tumors. Immunohistochemistry for IGF2, TFF3, and AFP and in situ hybridization for H19 mRNA. NT, non-tumor; T, tumor. Scale bar = 20 μm.
Among the changes in mRNA expression associated with CCl4-induced tumors, an increase in Igf2 and H19 mRNA was the most specific and was found in approximately half of the tumors. In addition, the magnitude of the induction of Tff3 mRNA, especially in DEN-tumors, was very impressive. To confirm the protein expression of IGF2 and TFF3 and the mRNA expression of H19 in liver tumors, we carried out immunohistochemistry for IGF2 and TFF3 and in situ hybridization for H19. The expression of AFP, a prototype oncofetal marker for HCC, was also examined. Although all of these were negative in adult liver tissues, IGF2 was positive in approximately half of CCl4-induced tumors but completely negative in DEN-induced tumors (Fig.2b). H19 mRNA was strongly expressed in some CCl4-induced tumors (Fig.2b). Diethylnitrosamine-induced tumors also expressed H19 mRNA, but its levels were generally low (Fig.2b). Although TFF3 was detected in both types of tumors, DEN-induced tumors tended to show stronger staining (Fig.2b). α-Fetoprotein was strongly positive in DEN-induced tumors, whereas CCl4-induced tumors were negative or contained scattered positive cells (Fig.2b).
Relationship between proliferative activity of tumor cells and mRNA expression levels of tumor-associated genes
We next examined whether the mRNA expression of the tumor-associated genes correlated with tumor cell proliferation, as estimated by Ki-67 immunohistochemistry. In the CCl4 model, the expression levels of Cbr3 and Tff3 were correlated with the proliferative activity of the tumor cells (Fig.3). Although Igf2 encodes IGF2, which has been shown to play important roles in cell growth, Igf2 mRNA expression was not significantly correlated with tumor cell proliferation, similar to other genes (Figs3,S2). In the DEN model, the expression of none of the genes analyzed was related to the proliferative activity of the tumor cells (Figs3,S2).
Figure 3.
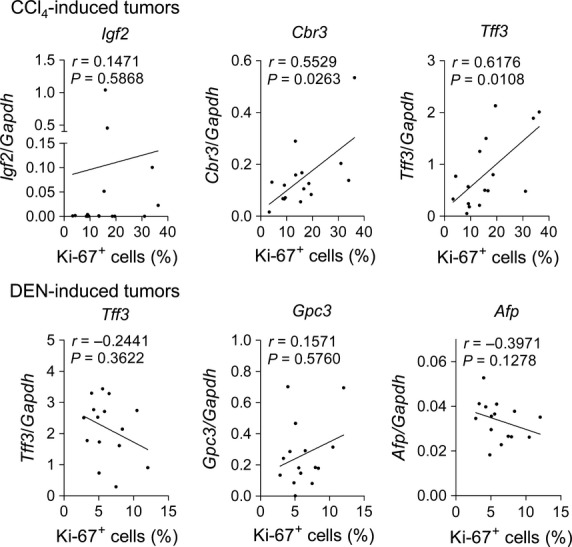
Relationship between mRNA expression of tumor-associated genes and tumor cell proliferation. Scatter plots of mRNA expression levels of selected tumor-associated genes and Ki-67 labeling index (%) in CCl4-induced tumors (n = 16) and diethylnitrosamine (DEN)-induced tumors (n = 15). Spearman correlation coefficients were used to test the association of mRNA expression and tumor cell proliferation.
Fetal or neonatal expression of tumor-associated genes
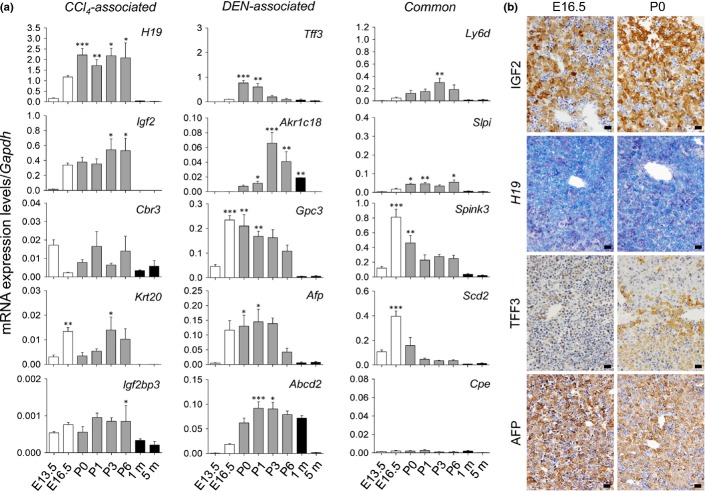
Because the identified tumor-associated genes included well-known oncofetal genes, such as Igf2, H19, Gpc3, and Afp, we examined their mRNA expression during fetal and neonatal periods. Our results clearly showed that all of these genes, with the exceptions of Cbr3 and Cpe, were highly expressed in either the fetal or neonatal periods (Fig.4a), indicating that the differential activation of fetal/neonatal gene expression occurs in CCl4- and DEN-induced liver tumors. As expected, the protein expression of IGF2 and TFF3 and the mRNA expression of H19 were detected in hepatoblasts/hepatocytes during the fetal or neonatal period (Fig.4b).
Figure 4.
Fetal/neonatal activation of tumor-associated genes and their products. (a) Quantitative RT-PCR analyses of mRNA expression of tumor-associated genes during fetal/neonatal periods. Each value is expressed as the mean ± SEM. The number of samples in each group was 3, 5, 7, 10, 4, 4, 4, and 7 for E13.5, E16.5, P0 (immediately after birth), P1 (1 day after birth), P3 (3 days after birth), P6 (6 days after birth), 1 m (1 month old), and 5 m (5 months old), respectively. *P < 0.05, **P < 0.01, ***P < 0.001 versus control (5 m); one-way factorial anova. (b) In situ detection of insulin-like growth factor 2 (IGF2), H19 mRNA, trefoil factor 3 (TFF3), and α-fetoprotein (AFP) in developing livers. Immunohistochemistry for IGF2, TFF3, and AFP and in situ hybridization for H19 mRNA in fetal (E16.5) and neonatal (P0) livers. Scale bar = 20 μm.
Comparison with other cirrhotic and non-cirrhotic liver tumor models
Next, we examined whether similar differential activation could also be observed in other liver tumor models. Thioacetamide-induced selective centrilobular injuries and chronic TAA administration resulted in multiple liver tumors (hepatocellular adenoma or well differentiated HCC), which were associated with marked cirrhosis in the surrounding liver (Fig.5a). In TAA-induced tumors, there were increases in the expression of Igf2 mRNA and Krt20 mRNA, with a tendency for increased mRNA expression of H19 and Igf2bp3 (Fig.5b). In contrast, the mRNA expression of Akr1c18, Gpc3, and Afp, which was highly characteristic of DEN-induced tumors, was not observed in TAA-induced tumors, although there was an increase in Abcd2 mRNA (Fig.5b). In spontaneously formed liver tumors (well to moderately differentiated HCC) in the intact livers of aged C3H mice, there was no increase in the mRNA expression of the genes that were selectively increased in CCl4-induced tumors, but the mRNA expression of Tff3, Akr1c18, Afp, and Abcd2 was significantly increased (Fig.5b). The mRNA expression of all the “common” genes was increased in TAA-induced tumors, whereas that of Spink3, Scd2, and Cpe was lacking in the spontaneously formed tumors (Fig.5b).
Figure 5.
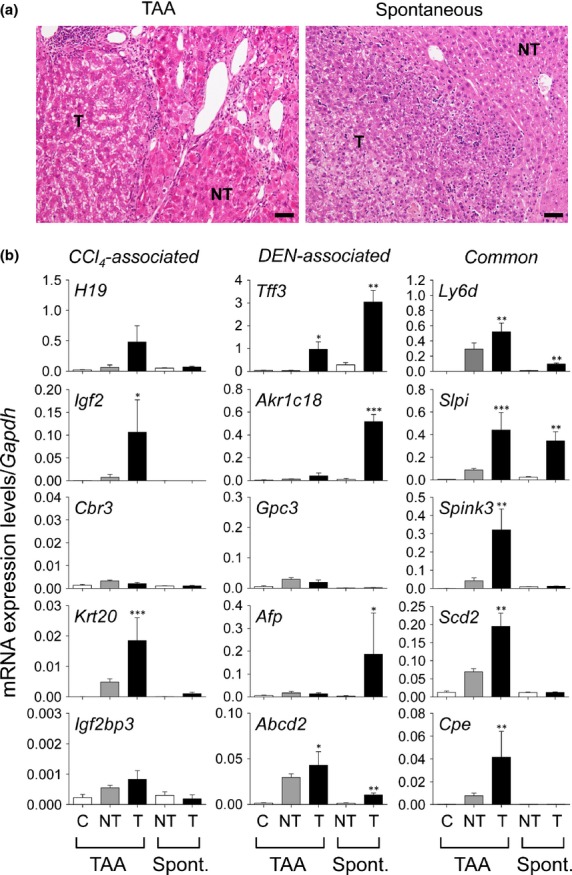
Differential gene expression in thioacetamide (TAA)-induced liver tumors and spontaneously developed liver tumors in mice. (a) Histology of liver tissues from TAA-induced and spontaneous tumors. The ages of mice at analyses were 38–40 weeks and 13–15 months in the TAA-induced model and spontaneous model, respectively. HE staining. NT, non-tumor; T, tumor. Scale bar = 50 μm. (b) Quantitative RT-PCR analyses of mRNA expression of 15 tumor-associated genes in TAA-induced and spontaneous (Spont.) tumors. Each value is expressed as the mean ± SEM. The number of samples in each group was 7, 6, 9, 4, and 3 for the TAA control (C), TAA-induced cirrhosis (NT), TAA-induced tumors (T), control C3H mouse liver (NT), and spontaneous tumors (T) in C3H mice, respectively. *P < 0.05, **P < 0.01, ***P < 0.001 versus control; one-way factorial anova.
Two-dimensional hierarchical cluster analysis of tumor-associated genes in cirrhotic and non-cirrhotic models
The mRNA expression data of the 15 tumor-associated genes in the four different liver tumor models (CCl4-induced, DEN-induced, TAA-induced, spontaneous) were subjected to unsupervised 2-D hierarchical cluster analysis (Fig.6). Interestingly, the mRNA expression profiles of the 15 genes almost clearly segregated control liver tissues, cirrhotic tissues, and tumors that had developed in the cirrhotic and non-cirrhotic backgrounds. Furthermore, there were several clusters of between two and four transcripts, which characterized tumors that had developed in the cirrhotic background (H19, Igf2, and Igf2bp3), in the non-cirrhotic background (Tff3, Akr1c18, Abcd2, and Gpc3), and in either background (Scd2 and Slpi; Cpe and Ly6d).
Figure 6.
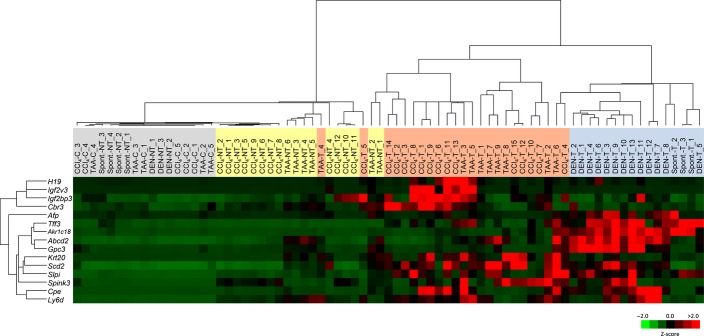
Heatmap of 2-D hierarchical clustering of mRNA expression of 15 tumor-associated genes in four different liver tumor models: CCl4-induced, diethylnitrosamine (DEN)-induced, thioacetamide (TAA)-induced, and spontaneous.
Selective activation of IGF2 and its related genes in CCl4- or TAA-induced tumors
There was a significant positive correlation between the mRNA expression levels of Igf2 and H19 (Fig.7a), which are known to be adjacently located in the genome and are regulated through reciprocal imprinting and a common enhancer.12,13 The mRNA expression of Igf2bp3, whose product is functionally correlated with Igf2 mRNA and H19 mRNA,14 was also increased in CCl4-induced tumors (Fig.2). The expression of Igf2bp3 mRNA was significantly higher in tumors with substantial levels of Igf2 mRNA expression (Igf2/Gapdh ≥0.01) compared with those that showed very low or no Igf2 mRNA expression (Igf2/Gapdh <0.01) (Fig.7b). Similar findings were obtained with TAA-induced tumors (Fig.7).
Figure 7.
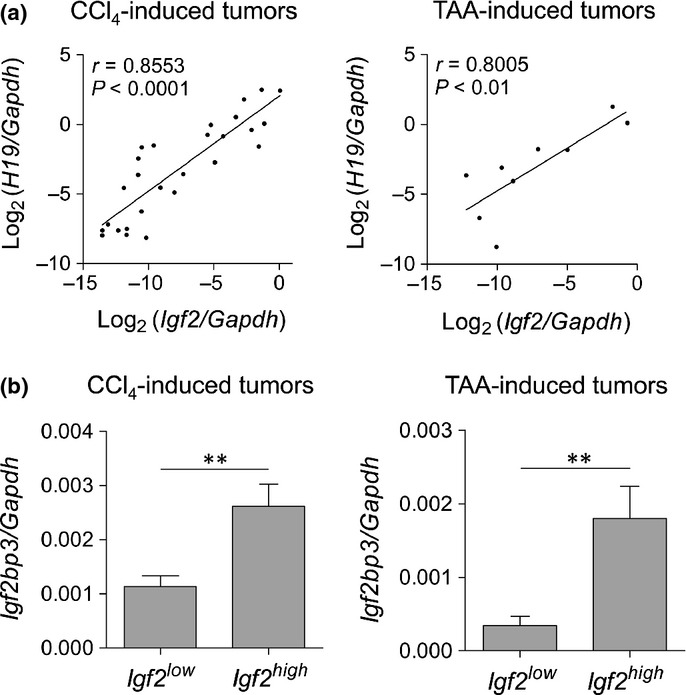
Association between mRNA expression of Igf2 and its related genes in CCl4- and thioacetamide (TAA)-induced tumors. (a) Scatter plot showing a positive correlation between the mRNA expression of Igf2 and H19 in CCl4-induced tumors (n = 27) and TAA-induced tumors (n = 9). Spearman’s correlation coefficient was used to test the correlation between the expression of the transcripts. (b) Igf2bp3 mRNA expression in tumors with substantial Igf2 mRNA expression (Igf2high, Igf2/Gapdh ≥0.01; CCl4-induced tumors, n = 12; TAA-induced tumors, n = 3) and very low or no Igf2 mRNA expression (Igf2low, Igf2/Gapdh <0.01; CCl4-induced tumors, n = 19; TAA-induced tumors, n = 6). **P < 0.01; unpaired two-tailed t-test.
Expression of IGF2, TFF3, and AFP in human HCC with or without liver fibrosis
The above experiments indicated that IGF2 expression showed significant discrimination ability for mouse liver tumors developed in cirrhotic and non-cirrhotic backgrounds. We examined IGF2 expression in human HCC developed with seemingly intact (non-fibrotic) livers or fibrotic livers. Immunohistochemically, tumor cells stained positive for either IGF2, TFF3, or AFP were found in several HCC cases, whereas these were negative in the surrounding liver parenchyma (Fig.8a). Clusters of IGF2-positive tumor cells were present in 11.1% and 54.2% of HCC developed with non-fibrotic livers (n = 9) and those developed with fibrotic livers (n = 24), respectively (Fig.8b). This difference was statistically significant (P = 0.0466, Fisher’s exact test). In contrast, there were no significant differences in the expression of TFF3 or AFP in HCC developed under these different conditions (Fig.8b).
Figure 8.
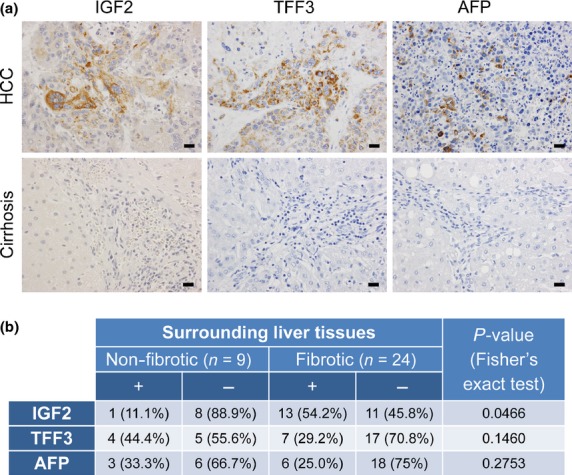
Expression of insulin-like growth factor 2 (IGF2), trefoil factor 3 (TFF3), and α-fetoprotein (AFP) in human hepatocellular carcinoma (HCC) with or without liver fibrosis. (a) Immunohistochemistry for IGF2, TFF3, and AFP in human HCC and the surrounding cirrhotic tissues. Scale bar = 20 μm. (b) Expression of IGF2, TFF3, and AFP in HCC developed in non-cirrhotic and cirrhotic livers. Tumors containing clusters of cells with unequivocal cytoplasmic staining were regarded as positive (+).
Discussion
We identified genes whose mRNA expression was increased in mouse liver tumors induced in cirrhotic and non-cirrhotic conditions. Based on gene expression clustering of these genes, we could distinguish tumors arising in the two different backgrounds, indicating the presence of genes that are differentially expressed during the tumorigenic course. Interestingly, most of the tumor-associated genes were also activated in the fetal/neonatal periods. The activation of these genes, including well established oncofetal genes (e.g., Afp, Igf2, H19, and Gpc3),15–17 occurred in the late fetal period (E16.5) and persisted during the postnatal period. This finding indicates that the mRNA expression of these genes in the liver tumors might not reflect the simple dedifferentiation of transformed hepatocytes into immature hepatoblasts. Although the significance of the reactivation of fetal/neonatal genes in mouse liver tumors is unclear, our study shows that transformed hepatocytes might use the cellular system that is active during the fetal/neonatal periods, when the most robust physiological proliferation of hepatocytes occur.18
Tff3 mRNA and its product, an intestinal polypeptide, TFF3, were highly expressed in mouse liver tumors, particularly in those induced by DEN in C3H × C57 F1 and those that developed spontaneously in C3H mice. The TFF3 polypeptide was also detected in human HCC arising in either fibrotic or non-fibrotic liver. It has been reported that Tff3 mRNA expression is increased in spontaneous liver tumors in tumor-prone PWK mice and those that develop in SV40 T antigen transgenic mice, as well as in human HCC.19 Marked increases in Tff3 mRNA have also been found in liver tumors that developed in HBx transgenic mice20 and those that developed in secretable EGF-expressing transgenic mice.7 The expression of Tff3 mRNA is governed by several transcription factors, including hepatocyte nuclear factor 3 and nuclear factor-κB, and by DNA methylation of its promoter region. Specifically, promoter hypomethylation has been found in mouse liver tumors and human HCC.19 Although TFF3 is highly expressed in goblet cells in the intestinal mucosa and has been suggested to be important in the processes of mucosal repair,21 its role in hepatocarcinogenesis is currently obscure. However, Tff3 mRNA or TFF3 polypeptide may serve as useful biomarkers due to their high specificity to liver tumors.
Our study revealed that Igf2 and its related genes, H19 and Igf2bp3, were selectively activated in approximately half of the mouse liver tumors induced under cirrhotic, but not non-cirrhotic, conditions. The expression of Igf2bp3 mRNA was significantly higher in the Igf2-expressing tumors induced by CCl4, suggesting their functional correlation. Igf2 and H19, which is located immediately downstream of Igf2, are reciprocally imprinted through the hypomethylation and methylation of the differentially methylated region on the maternal allele and paternal allele, respectively, and their expression is dependent on the two endoderm-specific enhancers that lie 3′ of H19.12 Although we do not know whether the loss of imprinting or altered methylation states of this gene cluster might contribute to their activation, a highly significant correlation between the Igf2 mRNA and H19 mRNA levels in the tumors suggests that their transcriptional activation is mediated by common enhancers.13 Increased mRNA expression of IGF2 and H19, as well as a significant correlation of their mRNA expression levels, have been shown in human HCC.22–25 However, following a partial hepatectomy in rodents, whereas H19 mRNA is markedly induced, Igf2 mRNA expression is not activated,26 indicating a striking contrast between non-transformed and transformed hepatocytes.
Our analysis of human liver samples showed the lower frequency of IGF2 positivity in tumor cells in cases of HCC arising in almost intact liver, compared with those with various degrees of fibrosis. Interestingly, in an attempt of transcriptional classification of human HCC into six subgroups, an identified subgroup (G1) was characterized by the reactivation of IGF2 gene expression, as well as the association with HBV infection.25 Although further confirmation is needed in view of the small number of cases analyzed, our data suggest the possible involvement of the IGF2 signaling in human hepatocarcinogenesis that is associated with chronic liver injury and fibrosis.
Although the exact mechanisms of HCC development in chronically injured and fibrotic liver are not clear, it is probable that the continued stimuli for hepatocyte regeneration following liver injury may play important roles in this process.27 Repeated hepatocyte injury promotes hepatic tumorigenesis in hepatitis C virus transgenic mice,28 possibly through excessive EGF receptor and/or c-Met signaling activities.27 While our study elucidated the close association between the activation of Igf2 gene expression and the cirrhotic hepatocarcinogenesis, reactivation of Igf2 gene expression in liver tumors has been shown in the absence of liver injury in various experimental models with enhanced hepatocyte proliferation in whole livers, such as HBx and SV40 T Ag transgenic mice.20,29,30 In SV40 T Ag transgenic mice, as well as in HBV presurface gene (preS1 and preS2) transgenic mice, in which benign and malignant hepatocytic nodules appear following perpetual hepatocyte apoptosis and regeneration, IGF2 reactivation has been found to be associated with late progression steps toward HCC.30 Furthermore, in secretable EGF-expressing transgenic mice, there is a switch from the initial EGF-dependent state to an EGF-independent, IGF2-dependent state during tumorigenesis.31 Thus, the reactivation of Igf2 gene expression in liver tumors might reflect the presence of continuous hepatocyte proliferation in the liver parenchyma, in which preneoplastic or neoplastic hepatocytes are eventually generated. In contrast, in the non-cirrhotic (DEN-induced and spontaneous) models, liver tumor formation may be mainly dependent on induced or spontaneous stochastic somatic mutations, which render some of the altered hepatocytes more proliferative than the surrounding intact hepatocytes. Because epigenetic alterations, including losses and gains of DNA methylation, have been increasingly recognized to occur during carcinogenesis,32,33 we speculate that epigenetically regulated genes might serve as signatures of distinctive modes of liver tumor formation.
In conclusion, by studying transcriptome characteristics, we have shown that the mouse liver tumors induced in cirrhotic and non-cirrhotic conditions differentially reactivate various fetal/neonatal genes. In particular, our data raise the possibility that the IGF2 axis could be selectively activated in liver tumors induced by excessive proliferative stimuli following chronic liver injury.
Acknowledgments
We would like to thank Mr. Yoshiyasu Satake for animal care and Ms. Ema Yamatomi and Ms. Hiroko Chiba for secretarial assistance. We are also grateful to the staff of the Department of Pathology, Asahikawa Medical University Hospital for their generous help. This work was supported by grants from the Ministry of Education, Culture, Sports, Science, and Technology of Japan (#18590362, #21590426, and #24390092) to Yuji Nishikawa.
Disclosure Statement
The authors have no conflict of interest.
Supporting Information
Fig. S1. RT-qPCR analyses of mRNA expression of Cib3, Top2a, Cdkn2b, Pnpla5, and Tspan8 in CCl4-induced and DEN-induced liver tumors. Each value is expressed as the mean ± SEM. The numbers of samples in each group was 5, 12, 15, 6, and 13 for the CCl4 control (olive oil), CCl4-induced cirrhosis, CCl4-induced tumors, DEN control, and DEN-induced tumors, respectively.
Fig. S2. The relationship between the mRNA expression of tumor-associated genes and tumor cell proliferation. Scatter plots of mRNA expression levels of the tumor-associated genes by RT-qPCR and Ki-67 labeling index (%) in CCl4-induced tumors (n = 16) and DEN-induced tumors (n = 15). The data of the genes that were not included in Figure 4 are shown here. Spearman correlation coefficients were used to test the association between mRNA expression and tumor cell proliferation.
Table S1. Primer sequences.
Table S2. Top 10 highly-expressed genes in CCl4-induced cirrhosis in Cluster B.
References
- El-Serag HB. Hepatocellular carcinoma. N Engl J Med. 2011;365:1118–27. doi: 10.1056/NEJMra1001683. [DOI] [PubMed] [Google Scholar]
- Ramakrishna G, Rastogi A, Trehanpati N, Sen B, Khosla R, Sarin SK. From cirrhosis to hepatocellular carcinoma: new molecular insights on inflammation and cellular senescence. Liver Cancer. 2013;2:367–83. doi: 10.1159/000343852. [DOI] [PMC free article] [PubMed] [Google Scholar]
- Liu TC, Vachharajani N, Chapman WC, Brunt EM. Noncirrhotic hepatocellular carcinoma: derivation from hepatocellular adenoma? Clinicopathologic analysis. Mod Pathol. 2014;27:420–32. doi: 10.1038/modpathol.2013.148. [DOI] [PMC free article] [PubMed] [Google Scholar]
- Stoot JH, Coelen RJ, De Jong MC, Dejong CH. Malignant transformation of hepatocellular adenomas into hepatocellular carcinomas: a systematic review including more than 1600 adenoma cases. HPB (Oxford) 2010;12:509–22. doi: 10.1111/j.1477-2574.2010.00222.x. [DOI] [PMC free article] [PubMed] [Google Scholar]
- Vesselinovitch SD. Infant mouse as a sensitive bioassay system for carcinogenicity of N-nitroso compounds. IARC Sci Publ. 1980;31:645–55. [PubMed] [Google Scholar]
- Wang Y, Cui F, Lv Y, et al. HBsAg and HBx knocked into the p21 locus causes hepatocellular carcinoma in mice. Hepatology. 2004;39:318–24. doi: 10.1002/hep.20076. [DOI] [PubMed] [Google Scholar]
- Borlak J, Meier T, Halter R, Spanel R, Spanel-Borowski K. Epidermal growth factor-induced hepatocellular carcinoma: gene expression profiles in precursor lesions, early stage and solitary tumours. Oncogene. 2005;24:1809–19. doi: 10.1038/sj.onc.1208196. [DOI] [PubMed] [Google Scholar]
- Calvisi DF, Factor VM, Ladu S, Conner EA, Thorgeirsson SS. Disruption of beta-catenin pathway or genomic instability define two distinct categories of liver cancer in transgenic mice. Gastroenterology. 2004;126:1374–86. doi: 10.1053/j.gastro.2004.02.014. [DOI] [PubMed] [Google Scholar]
- Edwards JE. Hepatomas in mice induced with carbon tetrachloride. J Natl Cancer Inst. 1941;2:197–9. [Google Scholar]
- Gothoskar SV, Talwalkar GV, Bhide SV. Tumorigenic effect of thioacetamide in Swiss strain mice. Br J Cancer. 1970;24:498–503. doi: 10.1038/bjc.1970.60. [DOI] [PMC free article] [PubMed] [Google Scholar]
- Andervont HB. Studies on the occurrence of spontaneous hepatomas in mice of strains C3H and CBA. J Natl Cancer Inst. 1950;11:581–92. [PubMed] [Google Scholar]
- Leighton PA, Saam JR, Ingram RS, Stewart CL, Tilghman SM. An enhancer deletion affects both H19 and Igf2 expression. Genes Dev. 1995;9:2079–89. doi: 10.1101/gad.9.17.2079. [DOI] [PubMed] [Google Scholar]
- Vernucci M, Cerrato F, Besnard N, et al. The H19 endodermal enhancer is required for Igf2 activation and tumor formation in experimental liver carcinogenesis. Oncogene. 2000;19:6376–85. doi: 10.1038/sj.onc.1204024. [DOI] [PubMed] [Google Scholar]
- Lederer M, Bley N, Schleifer C, Huttelmaier S. The role of the oncofetal IGF2 mRNA-binding protein 3 (IGF2BP3) in cancer. Semin Cancer Biol. 2014;29C:3–12. doi: 10.1016/j.semcancer.2014.07.006. [DOI] [PubMed] [Google Scholar]
- Sell S, Becker FF, Leffert HL, Watabe L. Expression of an oncodevelopmental gene product (alpha-fetoprotein) during fetal development and adult oncogenesis. Cancer Res. 1976;36:4239–49. [PubMed] [Google Scholar]
- Nordin M, Bergman D, Halje M, Engstrom W, Ward A. Epigenetic regulation of the Igf2/H19 gene cluster. Cell Prolif. 2014;47:189–99. doi: 10.1111/cpr.12106. [DOI] [PMC free article] [PubMed] [Google Scholar]
- Grozdanov PN, Yovchev MI, Dabeva MD. The oncofetal protein glypican-3 is a novel marker of hepatic progenitor/oval cells. Lab Invest. 2006;86:1272–84. doi: 10.1038/labinvest.3700479. [DOI] [PubMed] [Google Scholar]
- Finkielstain GP, Forcinito P, Lui JC, et al. An extensive genetic program occurring during postnatal growth in multiple tissues. Endocrinology. 2009;150:1791–800. doi: 10.1210/en.2008-0868. [DOI] [PMC free article] [PubMed] [Google Scholar]
- Okada H, Kimura MT, Tan D, et al. Frequent trefoil factor 3 (TFF3) overexpression and promoter hypomethylation in mouse and human hepatocellular carcinomas. Int J Oncol. 2005;26:369–77. [PMC free article] [PubMed] [Google Scholar]
- Sun Q, Zhang Y, Liu F, Zhao X, Yang X. Identification of candidate biomarkers for hepatocellular carcinoma through pre-cancerous expression analysis in an HBx transgenic mouse. Cancer Biol Ther. 2007;6:1532–8. doi: 10.4161/cbt.6.10.4683. [DOI] [PubMed] [Google Scholar]
- Hoffmann W. Trefoil factors TFF (trefoil factor family) peptide-triggered signals promoting mucosal restitution. Cell Mol Life Sci. 2005;62:2932–8. doi: 10.1007/s00018-005-5481-9. [DOI] [PMC free article] [PubMed] [Google Scholar]
- Sohda T, Yun K, Iwata K, Soejima H, Okumura M. Increased expression of insulin-like growth factor 2 in hepatocellular carcinoma is primarily regulated at the transcriptional level. Lab Invest. 1996;75:307–11. [PubMed] [Google Scholar]
- Sohda T, Iwata K, Soejima H, Kamimura S, Shijo H, Yun K. In situ detection of insulin-like growth factor II (IGF2) and H19 gene expression in hepatocellular carcinoma. J Hum Genet. 1998;43:49–53. doi: 10.1007/s100380050036. [DOI] [PubMed] [Google Scholar]
- Ariel I, Miao HQ, Ji XR, et al. Imprinted H19 oncofetal RNA is a candidate tumour marker for hepatocellular carcinoma. Mol Pathol. 1998;51:21–5. doi: 10.1136/mp.51.1.21. [DOI] [PMC free article] [PubMed] [Google Scholar]
- Boyault S, Rickman DS, de Reynies A, et al. Transcriptome classification of HCC is related to gene alterations and to new therapeutic targets. Hepatology. 2007;45:42–52. doi: 10.1002/hep.21467. [DOI] [PubMed] [Google Scholar]
- Yamamoto Y, Nishikawa Y, Tokairin T, Omori Y, Enomoto K. Increased expression of H19 non-coding mRNA follows hepatocyte proliferation in the rat and mouse. J Hepatol. 2004;40:808–14. doi: 10.1016/j.jhep.2004.01.022. [DOI] [PubMed] [Google Scholar]
- Whittaker S, Marais R, Zhu AX. The role of signaling pathways in the development and treatment of hepatocellular carcinoma. Oncogene. 2010;29:4989–5005. doi: 10.1038/onc.2010.236. [DOI] [PubMed] [Google Scholar]
- Kato T, Miyamoto M, Date T, et al. Repeated hepatocyte injury promotes hepatic tumorigenesis in hepatitis C virus transgenic mice. Cancer Sci. 2003;94:679–85. doi: 10.1111/j.1349-7006.2003.tb01502.x. [DOI] [PMC free article] [PubMed] [Google Scholar]
- Saenz Robles MT, Pipas JM. T antigen transgenic mouse models. Semin Cancer Biol. 2009;19:229–35. doi: 10.1016/j.semcancer.2009.02.002. [DOI] [PMC free article] [PubMed] [Google Scholar]
- Schirmacher P, Held WA, Yang D, Chisari FV, Rustum Y, Rogler CE. Reactivation of insulin-like growth factor II during hepatocarcinogenesis in transgenic mice suggests a role in malignant growth. Cancer Res. 1992;52:2549–56. [PubMed] [Google Scholar]
- Stegmaier P, Voss N, Meier T, Kel A, Wingender E, Borlak J. Advanced computational biology methods identify molecular switches for malignancy in an EGF mouse model of liver cancer. PLoS One. 2011;6:e17738. doi: 10.1371/journal.pone.0017738. [DOI] [PMC free article] [PubMed] [Google Scholar]
- Niwa T, Ushijima T. Induction of epigenetic alterations by chronic inflammation and its significance on carcinogenesis. Adv Genet. 2010;71:41–56. doi: 10.1016/B978-0-12-380864-6.00002-X. [DOI] [PubMed] [Google Scholar]
- Easwaran H, Tsai HC, Baylin SB. Cancer epigenetics: tumor heterogeneity, plasticity of stem-like states, and drug resistance. Mol Cell. 2014;54:716–27. doi: 10.1016/j.molcel.2014.05.015. [DOI] [PMC free article] [PubMed] [Google Scholar]
Associated Data
This section collects any data citations, data availability statements, or supplementary materials included in this article.
Supplementary Materials
Fig. S1. RT-qPCR analyses of mRNA expression of Cib3, Top2a, Cdkn2b, Pnpla5, and Tspan8 in CCl4-induced and DEN-induced liver tumors. Each value is expressed as the mean ± SEM. The numbers of samples in each group was 5, 12, 15, 6, and 13 for the CCl4 control (olive oil), CCl4-induced cirrhosis, CCl4-induced tumors, DEN control, and DEN-induced tumors, respectively.
Fig. S2. The relationship between the mRNA expression of tumor-associated genes and tumor cell proliferation. Scatter plots of mRNA expression levels of the tumor-associated genes by RT-qPCR and Ki-67 labeling index (%) in CCl4-induced tumors (n = 16) and DEN-induced tumors (n = 15). The data of the genes that were not included in Figure 4 are shown here. Spearman correlation coefficients were used to test the association between mRNA expression and tumor cell proliferation.
Table S1. Primer sequences.
Table S2. Top 10 highly-expressed genes in CCl4-induced cirrhosis in Cluster B.


