

Abstract
This review is based on the JR Vane Medal Lecture presented at the BPS Winter Meeting in December 2014 by T. Kenakin. A recording of the lecture is included as supporting information and can also be viewed online here: https://www.youtube.com/watch?v=xrP81AQ8l-8. Pharmacological models used to describe drug agonism and antagonism have evolved over the past 20 years from a parsimonious model describing single active and inactive receptor states to models of multiconformational receptor systems modified by ligand conformational selection. These latter models describe the observed, presently underexploited, pharmacological mechanism of ligand-directed biased signalling. Biased signals can be quantified with transduction coefficients (ΔΔLog(τ/KA) values), a scale grounded in the Black/Leff operational model; this enables the optimization of biased profiles through medicinal chemistry. The past decades have also brought the availability of new technologies to measure multiple functional effects mediated by seven transmembrane receptors. These have confirmed that drugs can have many efficacies, which may be collaterally linked, that is there is no linear sequence of activities required. In addition, new functional screening assays have introduced increasing numbers of allosteric ligands into drug discovery. These molecules are permissive (they do not necessarily preclude endogenous signalling in vivo); therefore, they may allow better fine tuning of pathological physiology. The permissive quality of allosteric ligands can also change the quality of endogenous signalling efficacy (‘induced bias’) as well as the quantity of signal; in this regard, indices related to ΔΔLog(τ/KA) values (namely ΔLog(αβ) values) can be used to quantify these effects for optimization in the drug discovery process. All of these added scales of drug activity will, hopefully, allow better targeting of candidate molecules towards therapies.
Tables of Links
| TARGETS | |
|---|---|
| GPCRsa | Enzymesb |
| β2-adrenoceptor | Adenylate cyclase |
| μ receptor | ERK |
| CRF2 receptor | |
| CT receptor | |
| D2 receptor | |
| GLP-1 receptor | |
| mGlu5 receptor | |
| NK2 receptor | |
| PACAP receptor |
| LIGANDS | ||
|---|---|---|
| 7-OH-DPAT | Cinacalcet | Oxotremorine |
| AC-265347 | Dopamine | Oxymetazoline |
| Aripiprazole | GLP-1 (7-36)NH2 | Pergolide |
| Bromocriptine | M-5MPEP | Phenoxybenzamine (POB) |
| Calcitonin | Neurokinin A | Quinpirole |
| Calindol | NPS-2143 | SKF38393 |
| Carbachol | NPS-R568 | TRV120027 |
| CGRP |
These Tables list key protein targets and ligands in this article which are hyperlinked to corresponding entries in http://www.guidetopharmacology.org, the common portal for data from the IUPHAR/BPS Guide to PHARMACOLOGY (Pawson et al., 2014) and are permanently archived in the Concise Guide to PHARMACOLOGY 2013/14
Alexander et al., 2013a,b,).
Introduction
Pharmacology is the chemical control of physiology and drug therapy involves some rather simple chemical interactions controlling a vast and complicated network of cells and biochemical processes. A critical component of a pharmacological system is a pharmacodynamic model to visualize and quantify the molecular events that begin with the drug binding to the target and culminate in a modification of cellular function. Over the past 20 years, new knowledge and new functional assays through advances in technology have brought on a Renaissance in the pharmacological models used in drug discovery. Central to these models is the definition of the receptor active state, thus it is useful to begin by describing receptor-activation models.
The evolution of models of agonism
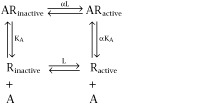
Historically, the byword in the development of pharmacological models to describe drug–receptor interactions has been parsimony; why construct unduly complex models until you have to? A key example of a parsimonious model developed to describe a complex process involves the description of agonist efficacy. This is one of the most, if not the most, unique concepts in pharmacology. Efficacy is the property of a molecule that causes the biological target to change its behaviour towards its host (cell) when the drug binds to it. The most simple model to describe efficacy is to assume that the biological target (the model for this discussion will be seven transmembrane receptors – 7TM receptors) acts as an on and off switch having an active state and an inactive state and that agonists produce cellular activation by turning on the switch. In thermodynamic terms, this would be a system where the agonist enriches the prevalence of the single receptor active state through conformational selection (Burgen, 1981):
 |
1 |
The ligand A can control the enrichment or reduction of Ractive, which is normally controlled by an allosteric constant L, selectively binding to one of the receptor states. Thus, if α > 1, then the ligand A has a preferential affinity for the active state and stabilizes it. This, in turn will enrich the active state (and in this case cause agonism). If α < 1, then the reverse occurs and the ligand is an inverse agonist reversing constitutively activated systems (i.e. those with a substantial ambient level of active state receptor). This is shown by the equation describing the change in Ractive produced by the binding of a saturating concentration of ligand A:
| 2 |
It can be seen from equation 2013b that if α = 1, that is, if the ligand has an equal affinity for both states of the receptor, then ligand binding will not change the relative amounts of the active and inactive species. However, if α ≠ 1, then ligand binding will inevitably change the makeup of the system in terms of the relative amounts of Ractive and Rinactive. This scheme treats the receptor as a rheostat that is scalable only in terms of the strength of the signal, not the type of signal, it can impart.
This model of efficacy yielded one of the most important tools in the pharmacology of drug discovery, namely the agonist potency ratio. The fact that all agonists were thought to enrich a single receptor active state allowed the assumption that cells dealt with all agonist stimuli in a uniform way, that is, there was a single stimulus-response function to handle the receptor stimulus and convert it to a cellular response. This assumption that the stimulus response function is monotonic (only one value of y for every x) means that ratios of observed agonist effect also reflect ratios of stimulus. This, in turn, allows agonist potency ratios found in test systems to be predictive of the same in all, including therapeutic, systems, that is the cell is simply a transducer of the receptor-mediated stimulus.
When functional pharmacological studies were confined to a limited array of systems (e.g. animal isolated tissues), there was insufficient data to challenge the parsimonious single receptor active state model. As exceptions to a single receptor state were noted, more complex receptor models were constructed, for example the three-state receptor model (Scaramellini and Leff, 2002). The acceptance of a single receptor model began to wane when recombinant systems became available. In these, a much larger array of receptor-effector combinations with varying stoichiometries could be studied. As recombinant functional pharmacology became commonplace, it became evident that 7TM receptors are pleiotropic with respect to the number of cellular interactants they can engage. An early theoretical treatment of the possible ramifications of this shows that unless the receptor species mediating the initial stimulus to these pleiotropic interactants are identical for each agonist, differences in the resulting overall cellular response are predicted (Kenakin and Morgan, 1989). Interestingly, prior to this theoretical treatment, isolated papers describing experimental data that did not conform to the single receptor active state hypothesis had already been published. For instance, as stated by Roth and Chuang (1987): ‘… the possibility is raised that selective agonists and antagonists might be developed which have specific effects on a particular receptor-linked system’.
In retrospect, it should not have been surprising that pleiotropic interactants with receptor species would lead to heterogeneity in signalling as 7TM receptors are allosteric proteins. Therefore, it would be predicted from the allosteric theory that the conformation of the receptor interacting with ligands will be dependent on the nature and concentration of the co-binding species. In the light of the reciprocal energy changes involved in protein binding, it would also be predicted that different receptor conformations stabilized by ligands will confer differing affinities and efficacies for the functional activation of the co-reactants, for example cellular coupling proteins mediating signalling. In other words, different receptor conformations would lead to different signalling characteristics.
With increasing reports from recombinant systems, it became evident that a uniform receptor active state conformation was insufficient to describe agonist pharmacology. A particularly clear cut example of where experimental data specifically refuted the concept that a monotonic relationship exists between receptor activation and cellular response was reported for the PACAP receptors. The unique aspect of this study was the fact that two response pathways linked to the PACAP receptor (namely cAMP and IP3 production) could be monitored separately (Spengler et al., 1993). In this system, two agonists (PACAP1–27 and PACAP1–38) had opposite relative potencies for the two pathways as they interacted with a single receptor; such reversals are not possible to explain with a single receptor state model (Kenakin, 1995). These data clearly showed how different agonists possess different qualities of efficacy as well as different quantities of efficacy.
The stabilization of different receptor active states is a workable model for reversals in agonist potency such as that shown with the PACAP receptor (Kenakin, 1995). In fact, 17 years after this idea was proposed on theoretical grounds, direct evidence for ligand-specific receptor conformations has been described in studies using [19F]-NMR (Liu et al., 2012). Molecular mechanisms describing how such effects can occur are found in molecular dynamic descriptions of protein function. Pioneering work by Onaran and Costa (Onaran and Costa, 1997; Onaran et al., 2002) introduced molecular dynamics into pharmacology with descriptions of how ligands can interact with a multitude of conformations and differentially stabilize them through selective binding. This model of agonism does not rely on the pre-identification of receptor states, but rather describes the control of undefined collections of conformations (referred to as protein ensembles) (Fraunfelder et al., 1988; 1991,; Freire, 1998) by ligands through probability functions. A visual description of the dynamics of receptor function in this scheme is given as an energy landscape. Thus, the receptor protein is seen to roll on an energy landscape which describes many energy wells into which the receptor may enter and remain for a length of time commensurate with the molecular forces governing the tertiary structure of the receptor. At any one instant, if this system were to be frozen in time it would be seen that a collection of protein conformations (the ensemble) would be what ligands encounter. The process of conformational selection (Burgen, 1981) (preferred binding to conformations for which the ligand has a high affinity) converts the ensemble into a ligand-bound collection of states that are unique to the ligand and receptor through the application of Le Chatelier’s principle (‘… if a dynamic equilibrium is disturbed by changing the conditions, the position of the equilibrium moves to counteract the change’).
An advantage of this dynamic molecular approach is the lack of a required definition of receptor states. The observation of bias signalling clearly negates a single active state receptor model raising the question, how many active states are there? This question is compounded by the context in which it can be asked, namely, what receptor activities will be mediated by these active states? With the advent of specific assays to measure distinct receptor behaviours has come a multiple array of possible efficacies for drugs, a condition described by Galandrin and Bouvier (2006) as ‘pluridimensional efficacy’. Therefore, not only is there a possibility of multiple receptor active states, there also is a possibility of multiple ligand-driven receptor efficacies. Models that require a predefinition of all these possibilities become exceedingly cumbersome with a need for too many unverifiable parameters to be useful. This paved the way for probabilistic models whereby ligands contributed energy to the stabilization of certain conformations, at the expense of others, with no predefinition of what function those receptor states controlled (Onaran and Costa, 1997; Kenakin, 2002; Onaran et al., 2002). This also removed the constraint of linearity to the existing models of efficacy. Specifically, a single receptor active state necessitates a condition whereby only the strength of the signal controls what constellation of signalling pathways are recruited by any given ligand. With a probabilistic model of multiple states, a different condition to ligand efficacy applies whereby ligands can instil collateral efficacy to systems, that is, ligands can have unique arrays of efficacies depending on their chemical structure. Within the context of this model, the particular array of efficacies any given ligand can have depends upon the relative affinities the ligand has for the various receptor conformations mediating those efficacies. As shown in Figure 1, various ensembles of conformations are associated with receptor functions and, as ligands bind to the receptor ensemble and stabilize various conformations, ligand functions emerge as a result of which conformations are selectively stabilized. Figure 1 shows a hypothetical ligand in panel A that produces Gs and β-arrestin activation but no receptor internalization. A hypothetical ligand B (panel B) activates Gs, Gi and β-arrestin and also internalizes the receptors. The heights of the various histograms produced by ligand stabilization represent the relative strength of signal for each efficacy. It can be seen that different ligands can have quite different and unrelated sets of efficacies within this model depending on the relative affinity the ligands have for the different conformations within the ensemble (Onaran and Costa, 1997; Kenakin, 2002; Onaran et al., 2002). One of the most striking dissociations of efficacy from the conventional linear model are ligands that produce no visible receptor activation (i.e. are receptor antagonists) but also actively internalize receptors (Roettger et al., 1997; Gray and Roth, 2001).
Figure 1.
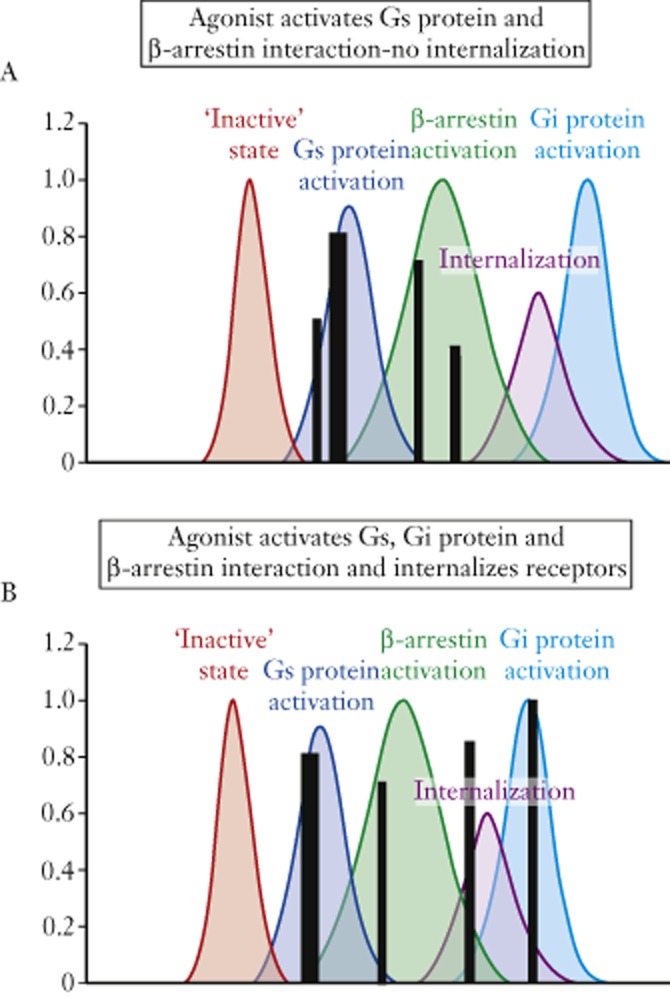
Receptor conformational ensembles displayed as Boltzman distributions. Shown are selected ensembles with pharmacological functions (except for ‘inactive’ state which has no cellular outcome). Superimposed on these distributions are the stabilized conformations, through conformational selection, made by two hypothetical agonists A and B. The coincidence of the ligand-stabilized conformations with the functional ensembles confers the observed functional efficacy to the ligand. Ligand A produces activation of Gs protein and β-arrestin; ligand B activates Gs and Gi protein, β-arrestin and also causes receptor internalization.
One important prediction of an ensemble model of receptor conformation involves the interaction of such ensembles with ligands. Assuming that a given ligand will not have identical affinities for all the conformations in an ensemble, it would be predicted that ligand interaction with an ensemble will inevitably change the makeup of the ensemble, that is, the relative proportions of the various conformations will change. The corollary to this idea would be that ligand binding is an active, not a passive, process and the modification of ensembles most likely to occur would lead to an observed ‘efficacy’ for that ligand if the stabilized conformations are related to cellular function. This would modify the historical dogma that all drugs have affinity but only agonists have efficacy to a more general idea that potentially all drugs have affinity and efficacy. The key to discovering such new efficacies is to have the pharmacological assay to detect effect. The observation of multiple drug efficacies (Galandrin and Bouvier, 2006) also leads to the notion that the constellation of efficacies possessed by any one ligand constitutes an important fingerprint of activity that may control a therapeutic phenotype of value. Expressions of such efficacies on multiple ordinate axes can yield unique representations for the overall quality of drug effect; this has been referred to as a ‘web of efficacy’ when expressed in two-dimensional space (Evans et al., 2011; Zhou et al., 2013). A striking phenomenon seen with these representations is the fact that all drugs tested in the studies demonstrate a unique web reflecting special collections of efficacies, probably stemming from the stabilization of unique collections of receptor active conformations within the ensemble.
The concept of collateral efficacy allows for different combinations of efficacy for therapeutic advantage, that is the identity of the active state receptor conformations stabilized by any one ligand defines its pharmacological properties. By implication, judicious application of pharmacological assays and medicinal chemistry could control which conformations are chosen from an ensemble and thus what pharmacological properties a ligand would have (Kenakin, 2002). Therapeutically, this alters the drug discovery screening landscape from one of ‘take what you get’ to a preferable one utilizing distinct, specific pharmacological assays of ‘get what you choose’. The specific targets of this approach are ‘biased ligands’ which could be tailored to have specific arrays of efficacy. The positive side of this idea is the potential to improve drugs by emphazing beneficial efficacies and/or de-emphasizing deleterious ones. It will be seen that a negative side of this approach is the elimination of monotonic stimulus-response coupling and subsequent cell-dependence of efficacy; this weakens the predicting power of tools such as the agonist potency ratio (vide infra).
Biased agonists
A biased agonist stabilizes a particular array of active receptor conformations to preferentially activate some cell signalling pathways over others (Kenakin, 1995). A common area of such selection is ligands that produce heterogeneous activation of G protein versus β-arrestin signalling pathways in cells. For example, selective activation of β-arrestin (over G protein) by ligands has been postulated to be beneficial for congestive heart failure (Violin and Lefkowitz, 2007; Violin et al., 2010; Boerrigter et al., 2011), osteoporosis (Ferrari et al., 2005; Gesty-Palmer et al., 2006; 2009,) and GPR109-mediated reduction of triglycerides and elevation of high-density lipoprotein (Walters et al., 2009). Similarly, an opposite bias of de-emphasis of β-arrestin signalling over G protein signalling has been proposed to be beneficial for opioid-induced analgesia without respiratory depression (Varga et al., 2004; Raehal et al., 2005; Groer et al., 2007; DeWire et al., 2013). It should not be blithely assumed that limiting ligand-based signalling will unanimously improve drug profiles. All physiological system signalling is naturally biased (for reasons of physiological advantage); therefore, the introduction of a synthetic bias will perturb a natural condition and this may have adverse outcomes as well. However, assuming a given bias has been identified as being therapeutically advantageous; theoretically, this drug property can be enhanced through medicinal chemistry. An important tool in this regard is a quantitative scale for the determination of signalling bias in ligands; a viable candidate for such a scale is the ‘transduction coefficient’, defined in terms of the Black/Leff operational model as the parameter ΔΔLog(τ/KA) where τ is the efficacy and KA is a measure of affinity of the ligand for production of defined signalling responses (Kenakin et al., 2012). This number quantifies the relative power of activation of two signalling pathways through activation of the same receptor by a ligand. All that is required for the quantification of bias with this tool are concentration-response curves to the ligand and a reference agonist for both signalling systems. Transduction coefficients can be obtained by directly fitting the Black/Leff operational model to the curves or, if the Hill coefficients of the curves are not significantly different from unity, utilization of ‘Relative Activity’ values (Ehlert, 2005; Figueroa et al., 2009; Tran et al., 2009) in the form of ΔΔLog(RA).
It is relatively simple to calculate transduction coefficients but it is important to interpret these numbers within their limits. Figure 2 shows a range of dopamine agonists that show biased activation of pERK signalling over adenylate cyclase activation. Thus, as shown in Figure 2, FAUC321 is 10ΔΔLog(τ/KA) = 10−1.2 = 0.06 times less likely to activate adenylate cyclase versus pERK when compared with the reference agonist quinpirole (Tschammer et al., 2011). It is essential to include a reference agonist as this allows any assay sensitivity effects to be eliminated; it is not important which agonist is used as the reference as the magnitude of relative biased values will not change with differences in reference agonist. An important requirement for such an analysis is to assess any difference statistically. The bars on the ordinate values in Figure 2 depicting ΔΔLog(τ/KA) values are 95% confidence limits; therefore, any value that does not include zero for this index shows a P < 0.05 statistically significant bias. In this example, the statistical limits of this measurement indicate that the value for FAUC321 lies well outside of the 95% confidence limits of the values for quinpirole thereby indicating that FAUC321 produces 15.84 times more pERK signal for a given cAMP signal than does quinpirole.
Figure 2.
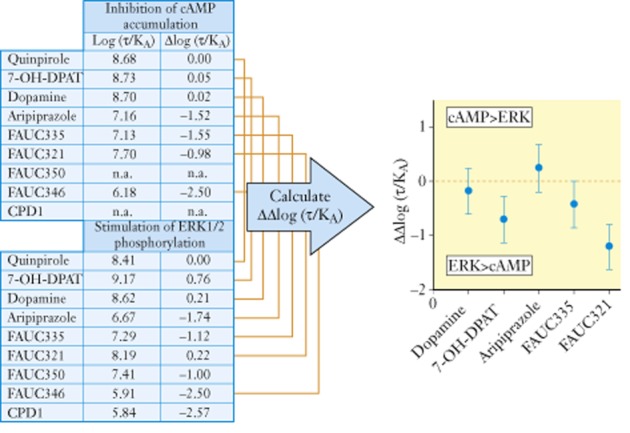
Calculated in vitro bias of dopamine agonists on dopamine D2L receptors. ΔLog(τ/KA) values for each agonists in each pathway are calculated with quinpirole as the reference agonist. Bias is then calculated as ΔΔLog(τ/KA) values. Graph on the right shows ΔΔLog(τ/KA) with 95% confidence limits. Where those limits cross zero, there is no bias. Values outside of zero indicate statistically significant bias (P < 0.05). Thus, the bias for FAUC321 is 10ΔΔLog(τ/KA) = 15.84. Redrawn from Tschammer et al. (2011).
It is worth considering applications of the ΔΔLog(τ/KA) scale beyond signalling bias. Specifically, Log(τ/KA) values are basically a means of quantifying agonism with a single number; this has important implications in other quantitative areas of pharmacology. For instance, selective receptor agonism is presently quantified through measurement of full agonist potency ratios. This scale ceases to be useful in tissues of low sensitivity when one or both of the agonists being compared show partial agonism. Agonist potency ratios fail to be uniform once partial agonism is observed, as seen from the expression for the agonist potency ratios for agonists denoted 1 and 2 defined by the Black/Leff operational model (Black et al., 1985):
| 3 |
From equation 2011, if τ > > 1, then potency ratio = (KA1/τ1)/(KA2/τ2); this ratio will not change with changes in receptor density. However, as τ approaches values lower than unity (partial agonism), the ratio will deviate from the linear relationship and be dependent upon receptor density [RT] (since τ = [RT]/KE where KE is the apparent Michaelis-Menten constant of the cell as a virtual enzyme). This is not the case for Log(τ/KA) values (and/or Log(RA) values for systems where n = 1) (Kenakin et al., 2012).
Another area of pharmacology where ΔΔLog(τ/KA) values can be applied is in the assessment of receptor mutation. With the discovery of constitutive 7TM receptor activity (Costa and Herz, 1989; Samama et al., 1993) has come the realization that receptors have efficacy. This is shown by the fact that constitutively active receptor states activate signalling proteins in the absence of agonists. While wild-type receptors will have a natural bias coupling towards signalling proteins, mutation of the receptor will most likely create a different receptor conformation and this, in turn, may change the bias of the mutated receptor towards signalling effectors. In these instances, a natural agonist can be compared with itself in the wild type versus mutant receptor utilizing a synthetic agonist as a reference (to account differences in receptor expression, transduction, etc., see Tschammer et al., 2011; Belmer et al., 2014). Table 2013a shows data on the effects of mutating the dopamine D2L receptor. Specifically, when agonism by dopamine is compared with the reference quinpirole, it can be seen that the D2LH3936.55 A mutation produces nearly insignificant effects on the ability of dopamine to activate adenylate cyclase (10ΔΔLog(τ/KA) = 1.1), whereas it induces a selective and significant reduction in the ability of dopamine to activate the pERK pathway (10ΔΔLog(τ/KA) = 0.076, a 13.18-fold diminution) (Tschammer et al., 2011).
Table 1.
Effect of point mutation of dopamine D2L receptors on responses to dopamine
| Wild type | ΔΔLog(τ/KA) | D2L H3936.55 A mutant | ||||
|---|---|---|---|---|---|---|
| Log(τ/KA) | Δlog(τ/KA) | Δlog(τ/KA) | Log(t/KA) | |||
| cAMP | ||||||
| Quinpirole | 8.680 | 0.040 | 6.690 | Quinpirole | ||
| Dopamine | 8.700 | −0.020 | −0.060 | 6.750 | Dopamine | |
| pERK | ||||||
| Quinpirole | 8.410 | −1.120 | 7.360 | Quinpirole | ||
| Dopamine | 8.620 | −0.210 | 0.910 | 6.450 | Dopamine | |
Data from Tschammer et al. (2011).
Finally, transduction coefficients can be used to identify unique host cell effects – these will be discussed further on in this paper after consideration of the allosteric nature of 7TM receptors (vide infra). In general, the interpretation of bias through this index is based on the allosteric nature of 7TM receptors; thus, it is useful to discuss the allostery in 7TM receptors as a preface to further discussion of signalling bias.
The allosteric nature of 7TM receptors
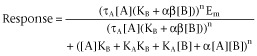
7TM receptors are nature’s prototypical allosteric protein, that is they exist to change shape in accordance with the binding of two co-binding bodies, usually extracellular ligands (i.e. hormones, neurotransmitters) and cytosolic signalling proteins (i.e. G protein, β-arrestin) (Kenakin and Miller, 2010; Kenakin, 2012). The affinity and efficacy (defined as the change in behaviour of the receptor protein towards its cellular host) of these bodies is inevitably dependent on the nature and concentration of the co-binding body. For example, as shown by X-ray crystallographic analysis, the conformation of the β2-adrenoceptor varies with the nature of the co-binding body used to form the crystal (Rasmussen et al., 2011a,b,). The effects of various co-binding bodies on the binding of (and subsequent effect of) a given ligand can be quantified through parameters defining changes in the affinity (through a cooperativity term α) and efficacy (through a scaling term β) and these effects will be host cell-independent. This is the case because they rely only on the nature of the species comprising the ternary complex of modulator/conduit/guest (i.e. ligand, receptors, signalling protein). The quantitative model used to calculate these parameters is an amalgam of the Stockton-Ehlert allosteric receptor binding model (Stockton et al., 1983; Ehlert, 1988) and the Black/Leff operational model for receptor function (Black and Leff, 1983; see Figure 3). Thus, agonist [A] response is given by (Ehlert, 2005; Kenakin, 2005; Price et al., 2005):
 |
4 |
where [B] is the modulator, KA and KB refer to the equilibrium dissociation constants of the agonist and modulator complexes, respectively, α is the effect of the modulator on the affinity of A, β is the effect of the modulator on the efficacy of A, Em is the maximal response capability of the system and n is the Hill coefficient of the concentration-response curve. Through changes in α and β, the responses to endogenous agonists can be blocked (α < 1 and/or β < 1) or potentiated (α > 1 and/or β > 1) to yield basic phenotypic changes in agonism (Ehlert, 2005; Kenakin, 2005; Price et al., 2005). Modulators that increase the agonist response are called positive allosteric modulators (PAMs) and those that inhibit the response are negative positive modulators (NAMs).
Figure 3.
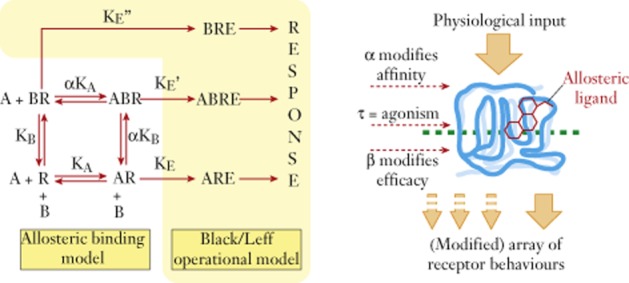
The model of functional allosterism for receptors (Ehlert, 2005; Kenakin, 2005; Price et al., 2005). The receptor R binds a probe A (agonist) and allosteric modulator B according to the Stockton-Ehlert allosteric binding model (Stockton et al., 1983; Ehlert, 1988). The ligand-bound species produce response according to the Black/Leff operational model (Black and Leff, 1983). The parameters quantifying the effect of the modulator are τ for possible direct agonism by the modulator, α for the effect of modulator on the affinity of the receptor for A and β for the effect of the modulator on the efficacy of A.
It is interesting to note that 7TM receptor agonism can be thought of as a positive allosteric modulation of a receptor-signalling protein interaction, that is, agonists are PAMs for receptor–signalling protein interactions. This can be modelled with the extended ternary complex model of 7TM receptors (Samama et al., 1993). The spontaneous [Ra] active state of the receptor will have an intrinsic affinity (KA) for the signalling protein and an efficacy (τ) for the signalling pathway (see Figure 4A). The agonist functions as a PAM for the receptor–G protein interaction to give the receptor a new affinity αKA and a new efficacy βτ. The modulator curves are shown in Figure 4B where concentration-response curves for the signalling protein (G protein) interacting with the receptor are shown in the absence and presence of a range of concentrations of a PAM. Any given combination of receptor and G protein stoichiometric ratio (as would be defined in a given tissue type) would yield a curve for the PAM that would be manifest as direct agonism (the PAM is seen as a direct agonist; see Figure 4B).
Figure 4.
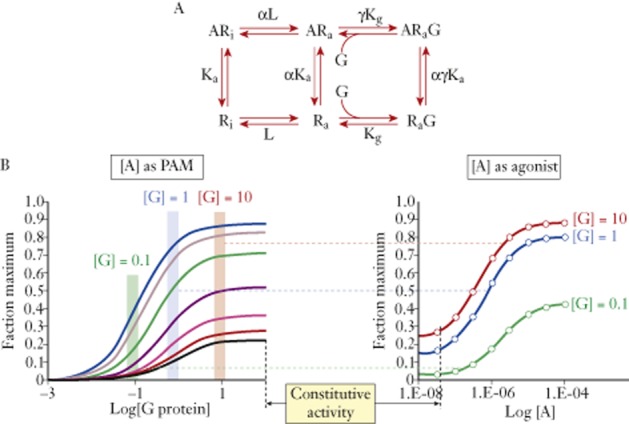
Direct agonism as a positive modulation of the interaction between receptors and G proteins. Top panel shows the extended ternary complex model of receptors in inactive (Ri) and active (Ra) states interacting with G proteins (G) and ligands (A) (Samama et al., 1993). Constitutive receptor activity is mediated by the spontaneous interaction of Ra with G according to Kg. This constitutive activity (black curve) is potentiated by various concentrations of A to increase response through formation of the ARaG species. Observation of response for any specified concentration of G protein illustrates the increased response to A, that is agonism in a system with defined concentrations of R and G.
Thinking of 7TM receptor agonism as allosteric facilitation of signalling protein function links a well-known feature of allosterism to biased signalling, namely the concept of probe-dependence. Specifically, allostery results in a change in the conformation of the receptor and there is no reason to assume that such a change in shape of the receptor will result in identical changes in the interactions of probes of receptor function at different loci on the protein. In fact, the evidence to date suggests that the effects of a given allosteric modulation on one probe may be quite different from the effects on another probe in another region of the receptor; this is what is referred to as probe-dependence. Considering two loci on the cytosolic side of a receptor such as the binding site for a G protein in one region and β-arrestin in another, probe-dependence dictates that a given agonist-mediated change in conformation may not cause identical changes to the interactions of the receptor with the G protein and β-arrestin. Thus, different agonists may be biased (when compared with another reference agonist). Under these circumstances, signalling bias is no more than common receptor allosteric probe- dependence.
Biased effects are also relevant to allosteric modulators even when they do not produce direct stimulation of receptors. This is due to the permissive nature of allosteric modulators. Because these bind to sites on the receptor different from the binding sites of endogenous agonists, they do not automatically preclude the effects of endogenous signalling (as do orthosteric ligands); the endogenous agonist may still bind to the receptor and produce effect. Thus, the endogenous signalling system may still, in some way, function even in the presence of binding of the allosteric ligand. If the endogenous agonist produces pleiotropic signalling (activates more than one signalling system in the cell to produce a mixture of cytosolic effects), then allosteric ligands may impart a change in the quality of the efficacy resulting from endogenous signalling by changing the relative emphasis of the pleiotropic signalling, that is, they may bias natural signalling. There are known cases of where this occurs for both NAMs and PAMs. For example, while the natural NK2 receptor agonist neurokinin A normally activates Gs and Gq, the NAM LP1805 changes this pattern to one of enhanced Gq activation and blockade of Gs activation (Maillet et al., 2007). Similarly, the NAM n-atosyltryptophan causes the CRF2 (CRH2) receptor natural agonist PGD2 to change its profile from dual activation of Gi and β-arrestin to sole activation of Gi protein (with no concomitant β-arrestin interaction) (Mathiesen et al., 2005). PAMs also change the nature of the signal produced by endogenous agonism. The natural agonist of the GLP-1 receptor, GLP-1(7-36)NH2 produces elevated cAMP, calcium and pERK effects. The PAM NOVO2 causes potentiation of the cAMP effects but has little effect on calcium and pERK signalling of the endogenous agonist (Koole et al., 2010). An extensive characterization of the calcimimetic PAM bias has been done for the calcium-sensing receptor (see Table 2013b) indicating bias for pERK1/2 activation, plasma membrane ruffling and IP1 accumulation (Davey et al., 2012; Cook et al., 2015).
Table 2.
Calcium receptor modulator-induced bias
| Allosteric ligand | pERK1/2 Δlog(αβ)a | pERK1/2 bias | PM ruffling Δlog(αβ)a | PM ruffling bias | IP1 accumulated Δlog(αβ)a | IP1 accumulated bias |
|---|---|---|---|---|---|---|
| PAM | ||||||
| Cinacalcet | −0.19 | 0.65 | −0.07 | 0.85 | 0.02 | 1.05 |
| NPS-R568 | −0.16 | 0.69 | −0.24 | 0.58 | 0.05 | 1.12 |
| Calindol | 0.18 | 1.51 | −0.06 | 0.87 | ||
| S,R-calcimimetic B | 0.1 | 1.26 | 0.49 | 3.09 | ||
| R,R-calcimimetic B | 0.2 | 1.58 | 0.23 | 1.70 | ||
| Nor-calcimimetic B | 0.02 | 1.05 | 0.15 | 1.41 | ||
| AC-265347 | 0.34 | 2.19 | −0.03 | 0.93 | ||
| NAM | ||||||
| NPS-2143 | 0.29 | 1.95 | 0.01 | 1.02 | ||
As NAMs and PAMs can change not only the quantity of the endogenous signal but also the quality of that signal, additional parameters are required to characterize the pharmacological activity of these molecules, that is the bias produced by allosteric ligands should be quantified in the same manner as direct signalling bias of agonists. A scale analogous to the ΔΔLog(τ/KA) scale can be derived from the functional allosteric model (see Appendix for derivation) to yield an index to do this, namely ΔLog(αβ). This parameter is the difference between the product of the change in affinity and efficacy of the endogenous agonist for any two signalling pathways. For instance, the calcium receptor sensing PAM, cinacalcet, potentiates calcium-induced intracellular calcium release with an αβ value of 3.0 (Davey et al., 2012). However, the αβ potentiation for calcium-induced pERK1/2 effects is 1.9; this yields a small biased PAM effect towards intracellular calcium release of 10Δlog(αβ) = 100.2 = 1.58 over pERK1/2 responses; a listing of various ΔLog(αβ) values is given in Table 2013b. Similarly, the mGlu5 receptor NAM, M-5MPEP, blocks calcium oscillations with an αβ value of 0.01 and inositol phosphate accumulation with an αβ value of 0.37 (Bradley et al., 2011) to yield a bias of antagonism towards calcium oscillations of 10Δlog(αβ) = 101.57 = 37-fold. Thus, 5MPEP has 37 times the blocking activity for calcium oscillations over inositol accumulation. In general, it may be that with permissive allosteric molecules, quantitative data on induced bias becomes as characteristic and useful as potency data in predicting therapeutic value.
Translation of biased effects in vivo
Using parameters from the operational model [ΔΔLog(τ/KA)] and the functional allosteric model [Log(αβ)], direct and induced biased effects can now be readily quantified. However, the true value of biased ligands lies in how they behave therapeutically in vivo and the assessment of this value requires information beyond these indices. Specifically, bias is a ratio of efficacy and affinity and the dominance of which of these drug properties is important to how a biased ligand behaves in tissues of varying receptor density. The precedent for this effect has been set for agonism. Specifically, the potency of an agonist is given as
| 5 |
Equation 1983 shows that a high agonist potency can be achieved by high affinity (low value of KA, this will be termed affinity-dominant potency) and/or high efficacy (termed efficacy-dominant potency) (Kenakin, 1984). The effects of diminishing receptor density are different for each type of agonist, as shown by an example comparing an affinity-dominant agonist (oxymetazoline) and efficacy-dominant agonist (carbachol) (see Figure 5). Agonism to an efficacy-dominant agonist is much more robust with respect to reductions in receptor density than agonism for an affinity-dominant agonist (Kenakin, 1997). As receptors are removed by chemical alkylation, it can be seen that the response to oxymetazoline is selectively depressed as compared with the response to carbachol (see Figure 5). Thus, in a high-sensitivity/high-receptor density tissue, oxymetazoline is more potent than carbachol, but this condition is reversed in a low-sensitivity/low-receptor density tissue and oxymetazoline becomes an antagonist.
Figure 5.
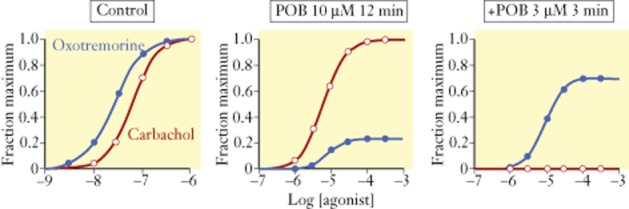
Muscarinic agonist responses in guinea pig ileum to oxotremorine and carbachol. Panel furthest to the left shows the control concentration-response curves; oxotremorine is a threefold more potent full agonist than carbachol. Controlled chemical alkylation of receptors with phenoxybenzamine (POB) produces a disparate depression of responses to the low efficacy agonist oxotremorine and resistance to loss of receptors by carbachol. Redrawn from Kenakin (1997).
This effect of affinity versus efficacy dominance is applicable to biased agonism as well, that is, the bias towards a given signalling pathway for a given agonist will be controlled either by affinity or efficacy and this will, in turn, determine the robustness of the bias in tissues of varying receptor density. Figure 6 shows the effect of two biased agonists with identical values of bias (bias = five times for pathway 2); the bias of one agonist is based on affinity-dominant while the other is efficacy-dominant. It can be seen that the bias of the efficacy-dominant agonist is retained throughout all levels of tissue sensitivity, whereas the bias of the affinity-dominant agonist actually reverses in low-sensitivity tissues. The fact that bias depends on both efficacy and affinity also raises the possibility that bias can be achieved with orthosteric antagonists as well (Kenakin, 2014) to gauge the full spectrum of biased effects for any set of agonists.
Figure 6.
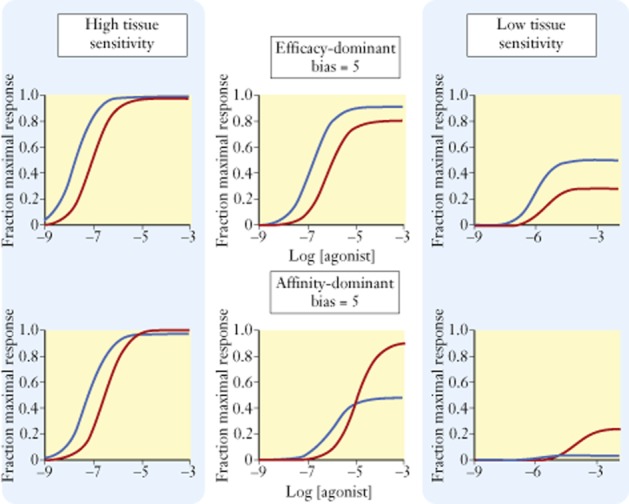
Effects of reduction in receptor density in various systems on two types of biased agonist. In the top row, the bias, fivefold for pathway 1 (blue line) is due primarily to a selective efficacy for pathway 1; pathway 1 τ = 10, KA = 2 μM; pathway 2 τ = 4, KA = 4 μM. Receptor concentrations from left to right panels are [RT] = 10, 1, 0.1; note that the bias towards pathway 1 is maintained throughout all receptor levels. Lower row of panels shows the effect of an agonist with the same bias (fivefold for pathway 1) but resulting from a selective affinity; pathway 1 τ = 3, KA = 2 μM; pathway 2 τ = 30, KA = 100 μM. Receptor concentrations from left to right panels are [RT] = 10, 0.3, 0.01. Note how the bias at the lowest receptor level reverses from pathway 1 > pathway 2 to pathway 2 > pathway 1.
Biased ligands may be useful for one of two reasons: the emphasis of a signalling pathway thought to be beneficial (biased agonism) or the de-emphasis of a signalling pathway that is thought to be detrimental (biased antagonism). It is important to note that while bias describes relative agonism when it is observed in any given system, the magnitude of efficacy is still the determining factor of whether or not agonism will be observed. Given this, biased ligands should be displayed on a graph with Cartesian coordinates of Log(bias) as the abscissae and Log(relative maximal response) as the ordinate (Kenakin, 2014) to display the full spectrum of biased effects for any set of agonists (see Figure 7).
Figure 7.
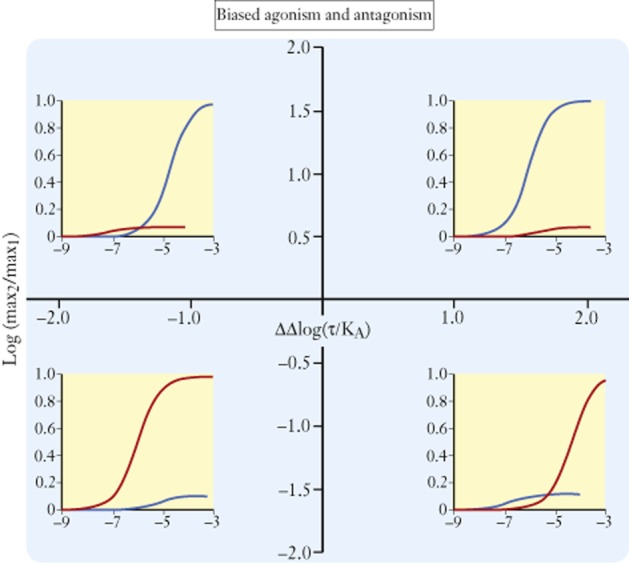
Grid for hypothetical-biased agonists for two pathways drawn as blue and red lines in the concentration-response curves. Ordinates represent logarithms of the relative maximal responses to the agonists for each pathway as a ratio maximum for pathway 2/maximum for pathway 1. Abscissae are logarithms of the bias of the agonists for pathway 2 over pathway 1. Four quadrants are defined. In the upper top quadrant, compounds have a higher efficacy for pathway 2 but are biased towards pathway 1. In the lower right quadrant, compounds have a higher efficacy for pathway 1 and also are biased towards pathway 1. The top left quadrant shows agonists that have a higher efficacy for pathway 2 over pathway 1 and are biased towards pathway 2 as well. The lower left quadrant shows agonists that have a higher efficacy for pathway 1 but are biased towards pathway 2. The abscissal axis (ΔΔLog(τ/KA) indicates the relative concentrations where dose-response curves will appear (when the tissue is sensitive enough to show agonism) when they do appear. The ordinal axis shows the relative ability of the agonists to produce the different pathway responses. Effect on pathway 1, blue curve; effect on pathway 2, red curve.
Another factor that is important in the translation of biased effects in vivo is possible cell-based selectivity. It should be noted that ΔΔLog(τ/KA) values quantify bias only within the allosteric vector, that is, the ternary complex unit of ligand, receptor and signalling protein (Kenakin and Miller, 2010). Within this context, α and β control ultimate signalling effects and these parameters will be independent of the cellular host and under these circumstances, the bias of the ternary complex will be a robust system-independent index. If the signal emerging from the agonist-activated receptor is uniform, then the cell simply provides amplification and cell type will not affect agonist potency ratios (a monotonic stimulus–response relationship). In contrast, if the signal coming from the activated receptor is a biased mixture of stimuli (i.e. activation of more than one G protein and/or β-arrestin), then the type of cell could have an effect on the overall response to the agonist as different pathways may be heterogeneously important in different cell types (see Figure 8; Kenakin and Christopoulos, 2013). Under these circumstances, the stimulus–response relationships for different agonists may be different and this can lead to variations in agonist potency ratios beyond that dictated by the allosteric vector. There are numerous examples of this effect where differences in cells and/or differences in the level at which a response is measured cause variations in agonist potency ratios. For example, the human calcitonin (CT) receptor transfected into CHO cells yields relative potency ratios (expressed as ratios of EC50 values) for porcine calcitonin = 1, human calcitonin = 86.5 and human CGRP = 177; these same agonists produce strikingly different potency ratios when the same receptor is transfected into COS cells (porcine calcitonin = 1, human calcitonin = 2.7, human CGRP = 6) (Christmanson et al., 1994). Similarly, the human calcitonin receptor transfected into HEK cells yields an order of potency for agonists of Eel Cal. > Porc. Cal. (Eel Cal. EC50/Porc. Cal. EC50 = 0.25). Transfection of excess Gs protein into the same cell actually reverses this potency ratio to Porc. Cal > Eel (Eel Cal. EC50/Porc. Cal. EC50 = 8) (Watson et al., 2000). The level of response measurement can also cause these effects. For example, the relative order of potency for dopamine receptor agonists in cells producing an elevation of cAMP (as ratios of EC50 values) is 1:10:100 for pergolide, dopamine and bromocriptine; these values would reflect numbers controlled by the allosteric vector, that is activation of Gs protein by the activated receptor. When label-free CellKey response (electrical impedance) to these same agonists is measured in the same cells (a response beyond the allosteric vector where the cell can modify stimulus), the relative potencies change to 1: 2.6: 6.8 (Peters et al., 2007). This type of cellular modification of measured bias in vitro may take place in vivo as the ligands encounter different cell types containing the target receptors. It is clear that bias measurements based on allosteric vectors, although useful for identifying bias ligands, cannot always be relied upon to predict whole cell response.
Figure 8.
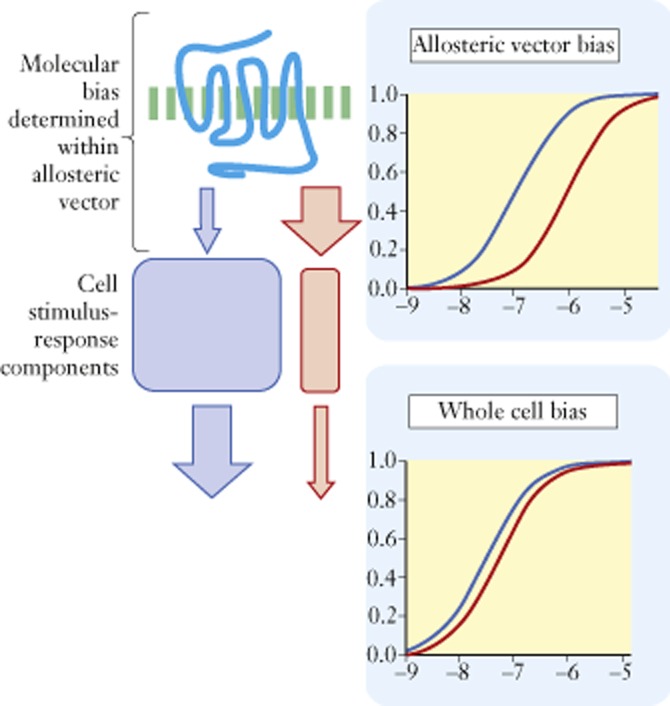
A biased signal from the receptor (top concentration-response curves) is processed further by the cell. The relative importance, in terms of stoichiometric reagents and sensitivity, of the two pathways is determined by the cell type which then modifies the receptor signal to form an altered emphasis of the signalling. This can alter the observed bias of the agonist signal.
A positive aspect of this cell-type variability is the potential to detect biased ligands and also to identify unique therapeutic cell-type selectivity. Variation in agonist potency ratios with varying cell types would be predicted only for biased ligands. This being the case, if ligands are tested in whole cell-based assays (such as label free assays) where the target receptor is expressed in different cell lines, then those ligands that show variation in potency ratios would be predicted to be biased with respect to signalling.
The ΔΔLog(τ/KA) scale can also be useful for identification of cell-specific agonism; one suitable experimental setting for this approach is the comparison of agonist effect in label-free systems. Figure 9 shows endogenous dopamine D1 receptor-mediated electrical impedance responses in U-2 and SK-N-MC cells. The bias plot identifies A77636 as having selective activation properties when the receptors are in U-2 versus SK-N-MC cells (Peters and Scott, 2009); ΔΔLog(τ/KA) values reveal an 11-fold difference. While in this case the direct therapeutic relevance of these data may not be evident, other scenarios for such effects could be, for example, tumour versus normal cell lines. In general, if therapeutically relevant cell types show unique reactivity to some ligands, these could be advanced for disease-related therapies.
Figure 9.
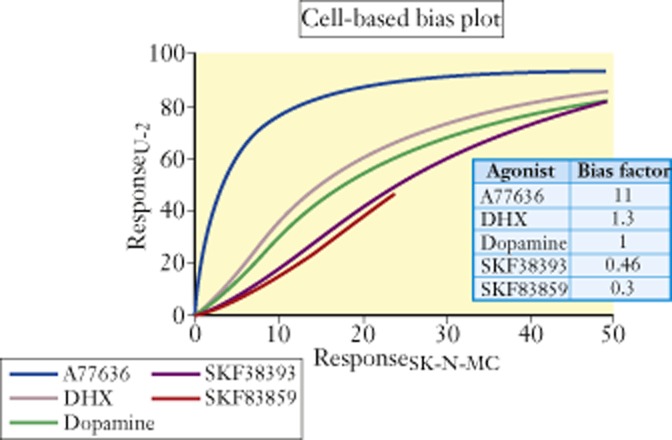
Bias plot (regression of responses in one cell line as a function of responses to the same target in another cell line) for dopamine receptor-mediated agonist responses producing cell electrical impedance for receptors transfected into U-2 cells versus SK-N-MC cells. Numbers in table represent ΔΔLog(τ/KA) values with dopamine as the reference agonist. These data indicate that A77636 produces uniquely selective higher levels of response in U-2 cells over SK-N-MC cells. Data from Peters and Scott (2009).
Another important aspect of biased ligands in vivo is the fact that, as orthosteric molecules, they will interfere with natural signalling due to endogenous agonists. There are cases where it can be argued that this may be the most important therapeutic property of the molecule as seen with TRV120027. This biased angiotensin ligand produces no Gq protein response but does initiate β-arrestin signals, which can be beneficial to the failing myocardium. However, in conditions of congestive heart failure, the occupancy of angiotensin receptors to block angiotensin-induced vasoconstriction may be the main therapeutic benefit of this molecule (Violin and Lefkowitz, 2007). Finally, the unique stabilization of receptor conformations can lead to different patterns of phosphorylation of receptors (‘barcoding’) which can then dictate patterns of internalization and disposition after agonism, as in the case of biased ligands that show different patterns of phosphorylation of μ-opioid receptors (Just et al., 2013).
In general, there are a number of factors that need to be considered in the translation of biased activity profiles measured in vitro and the therapeutic phenotypic activity of the molecule in vivo. Variation of biased activity stems from the relative importance of efficacy versus affinity constituting the bias, the relative intrinsic efficacy of the molecule for the various signalling systems, the impact of the conformational bias on receptor phosphorylation, the interaction of the molecule with organs of varying sensitivity (receptor density) and the importance of varying cell types in the body. While many of these effects cannot easily be predicted, the linking of in vivo phenotypes of activity with measured in vitro biased indices (ΔΔLog(τ/KA) and ΔLog(αβ) values) will, hopefully, provide a way forward to allow medicinal chemistry to optimize desired therapeutic profiles.
The effect of functional allostery in drug discovery
The most important technical advance in the pharmacology of drug discovery in recent years has been the introduction of multiple assays of receptor function, that is, new eyes to see what behavioural changes ligands cause in the receptor towards its cellular host. These new eyes to see have defined collateral efficacies in molecules and greatly expanded what ‘efficacies’ may be available for therapeutic exploitation. Hand in hand with these advances has come the capability to screen for new molecules in functional, rather than only binding, assays. Whereas historically, a binding hit in a screening assay would be quantitatively assessed for affinity and possible agonism and selectivity, the options have increased to testing for efficacy in a broad range of assays (pathway selective agonism, internalization of receptors, β-arrestin activation) and quantification of ligand bias. In addition, the introduction of functional screening assays has increased the likelihood of detecting allosteric ligands (Rees et al., 2002), adding an imperative to test for orthosteric versus allosteric mechanism of action of new ligands. If a ligand is found to act allosterically, then actions on natural signalling must be assessed with quantification of possible induction of bias on endogenous effects. Also, if bias is detected, either in direct agonism or induced allosteric modification, then a further assessment of the source of that bias (either through selective efficacy or affinity) would be beneficial to further determine predicted activity in vivo.
While the required testing for lead optimization of screening hits has expanded with our increased knowledge of receptor function, theoretically so too has our ability to better define what will be therapeutic efficacy. For the period 2008–2010, it was reported that 50% of new drug candidate failures were due to failures in efficacy (Arrowsmith, 2011). In many cases, it might be supposed that discovery programmes carried out their mandate and attained their predefined target molecule only to find that the predicted efficacy was insufficient to alleviate the pathological condition, that is an incorrect efficacy was identified as being relevant to the disease state. The introduction of allosteric molecules may produce a finer modification of pharmacological systems. In addition, the production of bias signals to cells may assist in more accurate determination of candidate molecule profiles for in vivo testing, that is focus efficacy to be a sharper chemical scalpel to modify pathological signalling in disease. Hopefully, this will increase the options for testing various drug efficacies in diseases to identify the correct one or the combination of efficacies needed.
However, such optimism should not be unbridled by some important caveats relating to the drug discovery process. Many of the signalling processes targeted by biased ligands have differential kinetics of actions in cells and ‘snapshot’ assays of biased responses may have limited predictive value if the kinetics of actions are not accounted for. Another possible caveat relates to the probability of detecting new molecules with uniquely biased properties with conventional assays used in the drug industry (which often generate ‘me too’ ligands). However, the evidence that biased ligands will not emerge even from these efforts is still not conclusive. This is because bias is a relatively new phenomenon and there has not yet been history available to determine if it is a rare drug property or not. A similar situation was present in discovery in 1989 when inverse agonism was first reported by Costa and Herz (1989); the paucity of constitutively active receptor assays in pharmacology led to a concomitant paucity of inverse agonism. As constitutively active assay systems became available, the prevalence of inverse agonism as an observed drug property dramatically increased (Kenakin, 2004). This could be the case for biased signalling as well. As molecules are subjected to proper scrutiny, it may be that biased signalling will be identified. From a theoretical point of view, the ensemble view of receptor function predicts this to be the case. Specifically, it would be difficult to imagine that two ligands would produce identical conformational ensembles to cells upon binding, which would be the required condition for two ligands not to be biased with respect to each other. From this point of view, the appearance of a biased agonist phenotype would then depend on the nature of the receptor conformations enriched by the ligand and the ability of the cell to detect these. Therefore, it is not known whether bias is a rare or common drug property and this is still within the realm of speculation until enough pharmacology around this effect is known.
Conflict of interest
The author has no conflict of interest in the preparation of this work.
Appendix
Quantification of positive allosteric modulator effects
In terms of the Black/Leff operational model (Black and Leff, 1983), the response to an agonist [A] for a signalling pathway 1 is given as:
| 1A |
where τA1 is the efficacy of the agonist for signalling pathway 1 and KA1 is the affinity of the agonist for the receptor when activating signalling pathway 1. Under these circumstances, the transduction coefficient (Kenakin et al., 2012) for agonism is given as:
| 2A |
In the presence of a saturating concentration of a positive allosteric modulator [B], the response to the agonist is given as:
| 3A |
Where the efficacy of the agonist [A] is βτA1 and the affinity of agonist [A] for the receptor is αKA1. Therefore, the transduction coefficient of the agonist in the presence of the allosteric modulator is:
| 4A |
Under these circumstances, the ratio of log transduction coefficients for agonism in the absence and presence of the modulator is given from equations 2011 and 1981 as:
| 5A |
The effects of the agonist on a second signalling pathway (designated pathway 2) yield analogous equations to equations 1 to 5,,,,. Therefore, the logarithm of the induced bias is given as the difference of the Log(αβ) values as:
| 6A |
and
| 7A |
Supporting Information
Gaddum Memorial Award Lecture.mp4
References
- Alexander SPH, Benson HE, Faccenda E, Pawson AJ, Sharman JL, Spedding M, et al. The Concise Guide to PHARMACOLOGY 2013/14: G protein-coupled receptors. Br J Pharmacol. 2013a;170:1459–1581. doi: 10.1111/bph.12445. [DOI] [PMC free article] [PubMed] [Google Scholar]
- Alexander SPH, Benson HE, Faccenda E, Pawson AJ, Sharman JL, Spedding M, et al. The Concise Guide to PHARMACOLOGY 2013/14: enzymes. Br J Pharmacol. 2013b;170:1797–1867. doi: 10.1111/bph.12451. [DOI] [PMC free article] [PubMed] [Google Scholar]
- Arrowsmith J. Trial watch: phase II failures: 2008–2010. Nat Rev Drug Discov. 2011;10:328–329. doi: 10.1038/nrd3439. [DOI] [PubMed] [Google Scholar]
- Belmer A, Doly S, Setola V, Banas SM, Moutkine I, Boutourlinsky K, et al. Role of the N-terminal region in G protein–coupled receptor functions: negative modulation revealed by 5-HT2B receptor polymorphisms. Mol Pharmacol. 2014;85:127–138. doi: 10.1124/mol.113.089086. [DOI] [PubMed] [Google Scholar]
- Black JW, Leff P. Operational models of pharmacological agonist. Proc R Soc Lond B Biol Sci. 1983;220:141–162. doi: 10.1098/rspb.1983.0093. [DOI] [PubMed] [Google Scholar]
- Black JW, Leff P, Shankley NP. An operational model of pharmacological agonism: the effect of E/[A] curve shape on agonist dissociation constant estimation. Br J Pharmacol. 1985;84:561–571. doi: 10.1111/j.1476-5381.1985.tb12941.x. [DOI] [PMC free article] [PubMed] [Google Scholar]
- Boerrigter G, Lark MW, Whalen EJ, Soergel DG, Violin JD, Burnett JC. Cardiorenal actions of TRV120027, a novel β-arrestin-biased ligand at the angiotensin II type I receptor, in healthy and heart failure canine: a novel therapeutic strategy for acute heart failure. Circ Heart Fail. 2011;4:770–778. doi: 10.1161/CIRCHEARTFAILURE.111.962571. [DOI] [PubMed] [Google Scholar]
- Bradley SJ, Langmead CJ, Watson JM, John Challiss RA. Quantitative analysis reveals multiple mechanisms of allosteric modulation of the mGlu5 receptor in rat astroglia. Mol Pharmacol. 2011;79:874–885. doi: 10.1124/mol.110.068882. [DOI] [PMC free article] [PubMed] [Google Scholar]
- Burgen AS. Conformational changes and drug action. Fed Proc. 1981;40:2723–2728. [PubMed] [Google Scholar]
- Christmanson L, Westermark P, Betsholtz C. Islet amyloid polypeptide stimulates cyclic AMP accumulation via the porcine calcitonin receptor. Biochem Biophys Res Commun. 1994;205:1226–1235. doi: 10.1006/bbrc.1994.2796. [DOI] [PubMed] [Google Scholar]
- Cook AE, Mistry SN, Gregory KJ, Furness SGB, Sexton PM, Scammells PJ, et al. Biased allosteric modulation at the CaS receptor engendered by structurally diverse calcimimetics. Br J Pharmacol. 2015;172:185–200. doi: 10.1111/bph.12937. [DOI] [PMC free article] [PubMed] [Google Scholar]
- Costa T, Herz A. Antagonists with negative intrinsic activity at δ-opioid receptors coupled to GTP-binding proteins. Proc Natl Acad Sci U S A. 1989;86:7321–7325. doi: 10.1073/pnas.86.19.7321. [DOI] [PMC free article] [PubMed] [Google Scholar]
- Davey AE, Leach K, Valant C, Conigrave AD, Sexton PM, Christopoulos A. Positive and negative allosteric modulators promote biased signaling at the calcium-sensing receptor. Endocrinology. 2012;153:1232–1241. doi: 10.1210/en.2011-1426. [DOI] [PubMed] [Google Scholar]
- DeWire SM, Yamashita DS, Rominger DH, Liu G, Cowan CL, Graczyk TM, et al. A G protein-biased ligand at the μ-opioid receptor is potently analgesic with reduced gastrointestinal and respiratory dysfunction compared with morphine. J Pharmacol Exp Ther. 2013;344:708–717. doi: 10.1124/jpet.112.201616. [DOI] [PubMed] [Google Scholar]
- Ehlert FJ. Estimation of the affinities of allosteric ligands using radioligand binding and pharmacological null methods. Mol Pharmacol. 1988;33:187–194. [PubMed] [Google Scholar]
- Ehlert FJ. Analysis of allosterism in functional assays. J Pharmacol Exp Ther. 2005;315:740–754. doi: 10.1124/jpet.105.090886. [DOI] [PubMed] [Google Scholar]
- Evans BA, Broxton N, Merlin J, Sato M, Hutchinson DS, Christopoulos A, et al. Quantification of functional selectivity at the human a1A-adrenoceptor. Mol Pharmacol. 2011;79:298–307. doi: 10.1124/mol.110.067454. [DOI] [PubMed] [Google Scholar]
- Ferrari SL, Pierroz DD, Glatt V, Goddard DS, Bianchi EN, Lin FT, et al. Bone response to intermittent parathyroid hormone is altered in mice bull for (beta) arrestin 2. Endocrinology. 2005;146:1854–1862. doi: 10.1210/en.2004-1282. [DOI] [PubMed] [Google Scholar]
- Figueroa KW, Griffin MT, Ehlert FJ. Selectivity of agonists for the active state of M1 to M4 muscarinic receptor subtypes. J Pharmacol Exp Ther. 2009;328:331–342. doi: 10.1124/jpet.108.145219. [DOI] [PMC free article] [PubMed] [Google Scholar]
- Fraunfelder H, Parak F, Young RD. Conformational substrates in proteins. Annu Rev Biophys Biophys Chem. 1988;17:451–479. doi: 10.1146/annurev.bb.17.060188.002315. [DOI] [PubMed] [Google Scholar]
- Fraunfelder H, Sligar SG, Wolynes PG. The energy landscapes and motions of proteins. Science. 1991;254:1598–1603. doi: 10.1126/science.1749933. [DOI] [PubMed] [Google Scholar]
- Freire E. Statistical thermodynamic linkage between conformational and binding equilibria. Adv Protein Chem. 1998;51:255–279. doi: 10.1016/s0065-3233(08)60654-3. [DOI] [PubMed] [Google Scholar]
- Galandrin S, Bouvier M. Distinct signaling profiles of β1 and β2 adrenergic receptor ligands toward adenylyl cyclase and mitogen-activated protein kinase reveals the pluridimensionality of efficacy. Mol Pharmacol. 2006;70:1575–1584. doi: 10.1124/mol.106.026716. [DOI] [PubMed] [Google Scholar]
- Gesty-Palmer D, Chen M, Reiter E, Ahn S, Nelson CD, Wang S, et al. Distinct β-Arrestin- and G protein-dependent pathways for parathyroid hormone receptor-stimulated ERK1/2 activation. J Biol Chem. 2006;281:10856–10864. doi: 10.1074/jbc.M513380200. [DOI] [PubMed] [Google Scholar]
- Gesty-Palmer D, Flanner P, Yuan L, Corsino L, Spurney R, Lefkowitz RJ, et al. A β-arrestin-biased agonist of the parathyroid hormone receptor (PTHR1) promotes bone formation independent of G protein activation. Sci Transl Med. 2009;1:1ra1. doi: 10.1126/scitranslmed.3000071. [DOI] [PMC free article] [PubMed] [Google Scholar]
- Gray JA, Roth BL. Paradoxical trafficking and regulation of 5-HT(2A) receptors by agonists and antagonists. Brain Res Bull. 2001;56:441–451. doi: 10.1016/s0361-9230(01)00623-2. [DOI] [PubMed] [Google Scholar]
- Groer CE, Tidgewell K, Moyer RA, Harding WW, Rothman RB, Prisinzano TE, et al. An opioid agonist that does not induce mu opioid receptor-arrestin interactions or receptor internalization. Mol Pharmacol. 2007;71:549–557. doi: 10.1124/mol.106.028258. [DOI] [PMC free article] [PubMed] [Google Scholar]
- Just S, Illing S, Lau EK, Kotowski SJ, Miess E, Mann A, et al. Differentiation of opioid drug effects by hierarchical multi-site phosphorylation. Mol Pharmacol. 2013;83:633–639. doi: 10.1124/mol.112.082875. [DOI] [PMC free article] [PubMed] [Google Scholar]
- Kenakin TP. The relative contribution of affinity and efficacy to agonist activity: organ selectivity of noradrenaline and oxymetazoline with reference to the classification of drug receptors. Br J Pharmacol. 1984;81:131–143. doi: 10.1111/j.1476-5381.1984.tb10753.x. [DOI] [PMC free article] [PubMed] [Google Scholar]
- Kenakin TP. Agonist-receptor efficacy II: agonist-trafficking of receptor signals. Trends Pharmacol Sci. 1995;16:232–238. doi: 10.1016/s0165-6147(00)89032-x. [DOI] [PubMed] [Google Scholar]
- Kenakin TP. The Pharmacologic Analysis of Drug Receptor Interaction. Third edn. New York: Lippincott-Raven; 1997. pp. 1–491. [Google Scholar]
- Kenakin TP. Efficacy at G protein coupled receptors. Annu Rev Pharmacol Toxicol. 2002;42:349–379. doi: 10.1146/annurev.pharmtox.42.091401.113012. [DOI] [PubMed] [Google Scholar]
- Kenakin TP. Efficacy as a vector: the relative prevalence and paucity of inverse agonism. Mol Pharmacol. 2004;65:2–11. doi: 10.1124/mol.65.1.2. [DOI] [PubMed] [Google Scholar]
- Kenakin TP. New concepts in drug discovery: collateral efficacy and permissive antagonism. Nat Rev Drug Discov. 2005;4:919–927. doi: 10.1038/nrd1875. [DOI] [PubMed] [Google Scholar]
- Kenakin TP. Biased signalling and allosteric machines: new vistas and challenges for drug discovery. Br J Pharmacol. 2012;169:1659–1669. doi: 10.1111/j.1476-5381.2011.01749.x. [DOI] [PMC free article] [PubMed] [Google Scholar]
- Kenakin TP. What is pharmacological ‘affinity’? Relevance to biased agonism and antagonism. Trends Pharmacol Sci. 2014;35:434–441. doi: 10.1016/j.tips.2014.06.003. [DOI] [PubMed] [Google Scholar]
- Kenakin TP, Christopoulos A. Signalling bias in new drug discovery: detection, quantification and therapeutic impact. Nat Rev Drug Discov. 2013;12:205–216. doi: 10.1038/nrd3954. [DOI] [PubMed] [Google Scholar]
- Kenakin TP, Miller LJ. Seven transmembrane receptors as shapeshifting proteins: the impact of allosteric modulation and functional selectivity on new drug discovery. Pharmacol Rev. 2010;62:265–304. doi: 10.1124/pr.108.000992. [DOI] [PMC free article] [PubMed] [Google Scholar]
- Kenakin TP, Morgan PH. Theoretical effects of single and multiple transducer receptor coupling proteins on estimates of the relative potency of agonists. Mol Pharmacol. 1989;35:214–222. [PubMed] [Google Scholar]
- Kenakin TP, Watson C, Muniz-Medina V, Christopoulos A, Novick S. A simple method for quantifying functional selectivity and agonist bias. ACS Chem Neurosci. 2012;3:193–203. doi: 10.1021/cn200111m. [DOI] [PMC free article] [PubMed] [Google Scholar]
- Koole C, Wootten D, Simms J, Valant C, Sridhaar R, Woodman OL, et al. Allosteric ligands of the glucagon-like peptide 1 receptor (GLP-1R) differentially modulate endogenous and exogenous peptide responses in a pathway-selective manner: implications for drug screening. Mol Pharmacol. 2010;78:456–465. doi: 10.1124/mol.110.065664. [DOI] [PMC free article] [PubMed] [Google Scholar]
- Liu LJ, Horst R, Katritch V, Stevens RC, Wuthrich K. Biased signaling pathways in β2-adrenergic receptor characterized by 19F-NMR. Science. 2012;335:1106–1110. doi: 10.1126/science.1215802. [DOI] [PMC free article] [PubMed] [Google Scholar]
- Maillet EL, Pellegrini N, Valant C, Bucher B, Hibert M, Bourguignon JJ, et al. A novel, conformation-specific allosteric inhibitor of the tachykinin NK2 receptor (NK2R) with functionally selective properties. FASEB J. 2007;21:2124–2134. doi: 10.1096/fj.06-7683com. [DOI] [PubMed] [Google Scholar]
- Mathiesen JM, Ulven T, Martini L, Gerlach LO, Heinemann A, Kostenis E. Identification of indole derivatives exclusively interfering with a G protein independent signaling pathway of the prostaglandin D2 receptor CRTH2. Mol Pharmacol. 2005;68:393–402. doi: 10.1124/mol.104.010520. [DOI] [PubMed] [Google Scholar]
- Onaran HO, Costa T. Agonist efficacy and allosteric models of receptor action. Ann N Y Acad Sci. 1997;812:98–115. doi: 10.1111/j.1749-6632.1997.tb48150.x. [DOI] [PubMed] [Google Scholar]
- Onaran HO, Scheer A, Cotecchia S, Costa T. A look at receptor efficacy. From the signaling network of the cell to the intramolecular motion of the receptor. In: Kenakin TP, Angus JA, editors. The Pharmacology of Functional, Biochemical, and Recombinant Systems Handbook of Experimental Pharmacology. Vol. 148. Heidelberg: Springer; 2002. pp. 217–280. Vol. [Google Scholar]
- Pawson AJ, Sharman JL, Benson HE, Faccenda E, Alexander SP, Buneman OP, et al. NC-IUPHAR. The IUPHAR/BPS Guide to PHARMACOLOGY: an expert-driven knowledgebase of drug targets and their ligands. Nucl Acids Res. 2014;42(Database Issue):D1098–D1106. doi: 10.1093/nar/gkt1143. [DOI] [PMC free article] [PubMed] [Google Scholar]
- Peters MF, Scott CW. Evaluating cellular impedance assays for detection of GPCR pleiotropic signaling and functional selectivity. J Biomol Screen. 2009;14:246–255. doi: 10.1177/1087057108330115. [DOI] [PubMed] [Google Scholar]
- Peters MF, Knappenberger KS, Wilkins D, Sygowski LA, Lazor LA, Liu L, et al. Evaluation of cellular dielectric spectroscopy, a whole-cell, label-free technology for drug discovery on Gi-coupled GPCRs. J Biomol Screen. 2007;12:312–319. doi: 10.1177/1087057106298637. [DOI] [PubMed] [Google Scholar]
- Price MR, Baillie GL, Thomas A, Stevenson LA, Easson M, Goodwin R, et al. Allosteric modulation of the cannabinoid CB1 receptor. Mol Pharmacol. 2005;68:1484–1495. doi: 10.1124/mol.105.016162. [DOI] [PubMed] [Google Scholar]
- Raehal KM, Walker JK, Bohn LM. Morphine side effects in β-arrestin 2 knockout mice. J Pharmacol Exp Ther. 2005;314:1195–1201. doi: 10.1124/jpet.105.087254. [DOI] [PubMed] [Google Scholar]
- Rasmussen SG, DeVree BT, Zou Y, Kruse AC, Chung KY, Kobilka TS, et al. Crystal structure of the β2 adrenergic receptor-Gs protein complex. Nature. 2011a;477:549–557. doi: 10.1038/nature10361. [DOI] [PMC free article] [PubMed] [Google Scholar]
- Rasmussen SG, Choi H-J, Fung JJ, Pardon E, Casarosa P, Chae PS, et al. Structure of a nanobody-stabilized active state of the β2 adrenoceptor. Nature. 2011b;469:175–180. doi: 10.1038/nature09648. [DOI] [PMC free article] [PubMed] [Google Scholar]
- Rees S, Morrow D, Kenakin T. GPCR drug discovery through the exploitation of allosteric drug binding sites. Receptors Channels. 2002;8:261–268. [PubMed] [Google Scholar]
- Roettger BF, Ghanekar D, Rao R, Toledo C, Yingling J, Pinon D, et al. Antagonist-stimulated internalization of the G protein-coupled cholecystokinin receptor. Mol Pharmacol. 1997;51:357–362. [PubMed] [Google Scholar]
- Roth BL, Chuang D-M. Multiple mechanisms of serotonergic signal transduction. Life Sci. 1987;41:1051–1064. doi: 10.1016/0024-3205(87)90621-7. [DOI] [PubMed] [Google Scholar]
- Samama P, Cotecchia S, Costa T, Lefkowitz RJ. A mutation-induced activated state of the b2-adrenergic receptor: extending the ternary complex model. J Biol Chem. 1993;268:4625–4636. [PubMed] [Google Scholar]
- Scaramellini C, Leff P. Theoretical implications of receptor coupling to multiple G proteins based on analysis of a three-state model. Methods Enzymol. 2002;343:17–29. doi: 10.1016/s0076-6879(02)43125-4. [DOI] [PubMed] [Google Scholar]
- Spengler D, Waeber C, Pantaloni C, Holsboer F, Bockaert J, Seeburg PH, et al. Differential signal transduction by five splice variants of the PACAP receptor. Nature. 1993;365:170–175. doi: 10.1038/365170a0. [DOI] [PubMed] [Google Scholar]
- Stockton JM, Birdsall NJ, Burgen AS, Hulme EC. Modification of the binding properties of muscarinic receptors by gallamine. Mol Pharmacol. 1983;23:551–557. [PubMed] [Google Scholar]
- Tran JA, Chang A, Matsui M, Ehlert FJ. Estimation of relative microscopic affinity constants of agonists for the active state of the receptor in functional studies on m2 and m3 muscarinic receptors. Mol Pharmacol. 2009;75:381–396. doi: 10.1124/mol.108.051276. [DOI] [PMC free article] [PubMed] [Google Scholar]
- Tschammer N, Bollinger S, Kenakin T, Gmeiner P. Histidine 6.55 is a major determinant of ligand-biased signaling in dopamine D2L receptor. Mol Pharmacol. 2011;79:575–585. doi: 10.1124/mol.110.068106. [DOI] [PubMed] [Google Scholar]
- Varga EV, Navratilova E, Stropova D, Jambrosic J, Roeske WR, Yamamura HI. Agonist-specific regulation of the δ-opioid receptor. Life Sci. 2004;76:599–612. doi: 10.1016/j.lfs.2004.07.020. [DOI] [PubMed] [Google Scholar]
- Violin JD, Lefkowitz RJ. β-Arrestin biased ligands at seven transmembrane receptors. Trends Pharmacol Sci. 2007;28:416–422. doi: 10.1016/j.tips.2007.06.006. [DOI] [PubMed] [Google Scholar]
- Violin JD, deWire SM, Yamashita D, Rominger DH, Nguyen L, Sciller K, et al. Selectively engaging b-arrestins at the AT1R reduces blood pressure and increases cardiac performance. J Pharmacol Exp Ther. 2010;335:572–579. doi: 10.1124/jpet.110.173005. [DOI] [PubMed] [Google Scholar]
- Walters RW, Shukla A, Kovacs JJ, Violin JD, DeWire SM, Lam CM, et al. β-arrestin 1 mediates nicotinic acid-induced flushing, but not its antilipolytic effect, in mice. J Clin Invest. 2009;119:1312–1321. doi: 10.1172/JCI36806. [DOI] [PMC free article] [PubMed] [Google Scholar]
- Watson C, Chen G, Irving PE, Way J, Chen W-J, Kenakin TP. The use of stimulus-biased assay systems to detect agonist-specific receptor active states: implications for the trafficking of receptor stimulus by agonists. Mol Pharmacol. 2000;58:1230–1238. doi: 10.1124/mol.58.6.1230. [DOI] [PubMed] [Google Scholar]
- Zhou L, Lovell KM, Frankowski KJ, Slauson SR, Phillips AM, Streicher JM, et al. Development of functionally selective, small molecule agonists at kappa opioid receptors. J Biol Chem. 2013;288:36703–36716. doi: 10.1074/jbc.M113.504381. [DOI] [PMC free article] [PubMed] [Google Scholar]
Associated Data
This section collects any data citations, data availability statements, or supplementary materials included in this article.
Supplementary Materials
Gaddum Memorial Award Lecture.mp4