

Highlights
-
•
GIT2 depletion attenuates Con A-induced immunological hepatic injuries.
-
•
GIT2 depletion suppressed the activation and function of mouse CD4+ T cells.
-
•
GIT2 depletion suppressed liver infiltration by lymphoid cells after Con A treatment.
-
•
There were lower levels of proinflammatory cytokines in Git2−/− mice after Con A injection.
Abbreviations: GIT2, G protein-coupled receptor kinase interactor 2; FACS, fluorescence-activated cell sorting; GFP, green fluorescent protein; TCR, T cell receptor; Con A, concanavalin A; PMA, 4b-phorbol 12-myristate 13-acetate
Keywords: GIT2, Hepatitis, Knock-out mice, Innate immunity, T cell activation
Abstract
G protein-coupled receptor kinase interactor 2 (GIT2) is a signaling scaffold protein involved in regulation of cytoskeletal dynamics and the internalization of G protein-coupled receptors (GPCRs). The short-splice form of GIT2 is expressed in peripheral T cells and thymocytes. However, the functions of GIT2 in T cells have not yet been determined. We show that treatment with Con A in a model of polyclonal T-lymphocyte activation resulted in marked inhibitions in the intrahepatic infiltration of inflammatory cells, cytokine response and acute liver failure in Git2−/− mice. CD4+ T cells from Git2−/− mice showed significant impairment in proliferation, cytokine production and signal transduction upon TCR-stimulated activation. Our results suggested that GIT2 plays an important role in T-cell function in vivo and in vitro.
1. Introduction
Immune cells, including lymphocytes and Kupffer cells, constitute approximately 45% of the total non-hepatocyte cells in the normal liver [1,2]. Nearly all of the innate immune cells in the liver have been reported to be involved in the diverse liver injuries observed in experimental animal models and/or human clinical investigations [1]. It is well established that Con A induced liver damage in mice is a typical model that closely resembles several pathological properties of human viral or autoimmune hepatitis [3]. Activated T cells play a critical role in Con A-induced liver damage [4]. Tiegs found that pretreatment of mice with monoclonal anti-CD4 antibody inhibited Con A-induced hepatitis, suggesting that CD4+ T lymphocytes are required for the initiation of the immunological response [4]. In addition, immune cells, including CD8+ T cells, natural killer (NK) cells, natural killer T cells, Kupffer cells/macrophages, neutrophils and eosinophils, have also been reported to be involved in Con A-induced hepatitis by either cell-to-cell contact or the secretion of pro-inflammatory cytokines or reactive oxygen species [3].
G protein-coupled receptor kinase interacting protein 2 (GIT2) is a signaling scaffold protein involved in the regulation of cytoskeletal dynamics, GPCR internalization and membrane trafficking [5]. GIT2 has numerous splice variants, and the longest splice form of GIT2 (GIT2-long) is expressed in a wider range of cells, whereas GIT2-short is specific to immune cells [6]. GIT2 is a ubiquitous multi-domain protein that has an N-terminal ARF-GAP domain, three Ank repeats, a Spa2-homology domain (SHD), a coiled-coil (CC) domain and a paxillin-binding site (PBS) [5]. The GIT2-short lacks the CC domain and PBS [5]. GIT2 regulates diverse cellular functions through interacting with various proteins. For example, GIT2 agonist GPCR endocytosis through regulating ARFs via ARF-GPA domain and the phosphorylation of GIT2 at PBS via Src and FAK is required for its recruitment to focal complexes, which is essential for the formation of normal lamellipodia during cell spreading [6,7]. In addition, the main binding partner for the SHD of GIT2 is PIX, through which GIT2 can regulate cytoskeletal dynamics via interacting with PAK1 and the small GTPases Rac1 and Cdc42 [8]. GIT/PIX complexes are known to function as scaffolds for a variety of signaling proteins, including GRKs, PAKs, FAK, the MEK1-ERK1/2 mitogen-activated protein kinases, and phospholipase C [5]. Previous studies have shown that GIT interacts constitutively in a tri-molecular complex with PIX and PAK in T cells and that this complex is recruited to the T cell immunological synapse by PIX [9,10]. The mutation of PIX in mice results in neutrophil that are defective in orienting and migrating toward a chemoattractant, and this phenotype resembles that of GIT2-knockout mice [11–13]. Moreover, PIX-knockout T lymphocytes showed defective TCR-induced proliferation and signaling but enhanced basal migration [12]. Interestingly, Git2−/− double-positive (DP) thymocytes display increased migration toward SDF-1 and CCL25 in vitro, suggesting that GIT2 plays a key role in regulating the chemokine-mediated motility of DP thymocytes [14]. In addition, through analyzing a genome-wide association study (GWAS) dataset, significant association between the single nucleotide polymorphisms (SNP) in GIT2 and abnormal values of HDL cholesterol has been reported [15]. Clinically, in addition to metabolic syndrome, it is generally thought that an abnormal value of HDL-C results from liver dysfunction [16], which suggests a potential role of GIT2 in liver disease. Taken together, these data show that GIT2 may play an important role in the regulation of T cell function and in liver disease.
In this study, we utilized Git2−/− mice to investigate the role of GIT2 in immune cells during T cell-mediated hepatitis. We found that GIT2 deficiency in mice led to a spontaneous reduction of basal CD4+ T cells and NKT cells in the liver. Treatment with Con A in a model of polyclonal T lymphocyte activation resulted in marked inhibitions in the intrahepatic infiltration of inflammatory cells, cytokine response and acute liver failure in Git2−/− mice. CD4+ T cells from Git2−/− mice showed significant impairments in proliferation, cytokine production and signal transduction upon TCR-stimulated activation. Our data demonstrate that GIT2 plays an important role in Con A-induced hepatitis and may therefore be a potential target for therapeutic intervention in acute liver diseases.
2. Results
2.1. GIT2 depletion attenuated Con A-induced immunological hepatic injuries
Heterozygous GIT2-knockout mice were bred to produce Git2+/+ controls and homozygous GIT2-knockout (Git2−/−) mice. Positive founder mice were identified by RT-PCR and Western bolt analyses (Fig. 1A and B). GIT2 was completely absent from the total thymocytes, splenic CD4+ T cells and liver tissues, as determined using an antibody against the mouse GIT2. In agreement with previous reports [13], adult Git2−/− mice showed no gross phenotypic abnormalities but often developed splenomegaly (Fig. 1C and D) and an increased CD4+/CD8+ ratio in the liver MNCs (Table 1). To examine the effects of GIT2 on immune-mediated hepatitis, we applied the Con A-induced hepatitis model in six- to eight-week-old male Git2+/+ and Git2−/− mice. We observed that the serum AST and ALT levels after the injection of 15 mg/kg Con A were significantly lower in Git2−/− mice compared with Git2+/+ mice (Fig. 1E). Histological analyses of liver tissue sections obtained 24 h after the administration of 15 mg/kg Con A indicated that Git2−/− mice were less sensitive to Con A-induced hepatic injury (Fig. 1F). Liver tissue sections of Git2−/− mice showed several solitary areas of necrotic tissue characterized by standard morphologic criteria (Fig. 1F – d–f), and the majority of hepatocytes were not affected. However, liver tissue sections of Git2+/+ mice showed widespread areas of necrosis (Fig. 1F – a) with extensive infiltration of mononuclear cells within the liver lobules (Fig. 1F – b) and around the central veins and portal tracts (Fig. 1F – c), indicating an ongoing inflammatory process. Consistent with these findings, the percentage of liver tissue with necrotic damage was markedly lower in Git2−/− mice (Fig. 1G). The livers of Git2−/− mice also demonstrated a significant decrease in hepatocyte apoptosis 24 h after treatment with 15 mg/kg Con A (Fig. 1H): the liver of Git2+/+ mice showed 37% hepatocyte apoptosis, whereas only 13% apoptosis was observed in the Git2−/− mice. Taken together, these data indicated that mice deficient in GIT2 appeared highly resistant to liver injuries induced by Con A.
Fig. 1.

GIT2 depletion attenuated Con A-induced immunological hepatic injuries. (A) Genomic PCR using genomic DNA from the mouse tail of Git2+/+, Git2+/−, and Git2−/− mice. (B) GIT2 expression in thymocytes, splenic CD4+ T cells and liver tissues were analyzed using mouse GIT2 antibody. (C) Representative photographs of spleens in Git2+/+ and Git2−/− mice. (D) Total splenic cell numbers from Git2+/+ and Git2−/− mice (n = 6). Graphs in figures show mean ± s.e.m., *P < 0.05. (E) Serum ALT and AST levels from Git2+/+ and Git2−/− mice (n = 3) were determined at the indicated time points following 15 mg/kg Con A injection. (F and G) 24 h after 15 mg/kg Con A injection, mice were sacrificed and the liver tissues were stained with H&E for histopathological and morphological analysis. Scare bar, 50 μm (F). The percentage of necrotic area was quantitated using ImageJ software, and values are the mean ± SD of five fields of measurements (G). (H) TUNEL staining was performed on liver sections from Git2+/+ and Git2−/− mice with 15 mg/kg Con A treatment. The TUNEL-positive cells are shown by arrows, and values are the mean ± SD of five fields of measurements. Scare bar, 50 μm. The results were representative of three independent experiments and error bars represent standard deviations (*P < 0.05, **P < 0.01, ***P < 0.001).
Table 1.
Lymphocyte populations in Git2+/+ and Git2−/− mice [mean ± SD, n = 3–6].
| Tissue and cells population | Cells [%] |
t | P | |
|---|---|---|---|---|
| Git2+/+ | Git2−/− | |||
| Thymus | ||||
| CD4−CD8− | 6.2 ± 2.8 | 7.4 ± 2.1 | 0.587 | 0.589 |
| CD4+CD8+ | 76.9 ± 6.1 | 78.8 ± 1.4 | 0.526 | 0.647 |
| CD4+CD8− | 10.2 ± 2.0 | 9.7 ± 2.0 | 0.274 | 0.797 |
| CD4−CD8+ | 6.7 ± 2.3 | 4.0 ± 0.9 | 1.839 | 0.140 |
| Spleen | ||||
| CD4+ | 57.3 ± 4.6 | 53.0 ± 2.5 | 1.415 | 0.230 |
| CD8+ | 36.6 ± 3.9 | 41.1 ± 2.7 | 1.640 | 0.176 |
| Lymph nodes | ||||
| CD4+ | 62.9 ± 3.9 | 62.3 ± 8.4 | 0.160 | 0.876 |
| CD8+ | 34.1 ± 3.3 | 34.4 ± 7.3 | 0.087 | 0.932 |
| Liver | ||||
| CD4+ | 61.9 ± 2.9 | 42.8 ± 4.2⁎⁎⁎ | 9.210 | 0.000 |
| CD8+ | 22.1 ± 3.1 | 37.1 ± 5.7⁎⁎ | 5.707 | 0.001 |
T Cells from the thymus, spleen, lymph nodes and liver of 8-week-old Git2+/+ and GIT2−/− littermates were stained with anti-CD4-APC and anti-CD8-PerCP-Cy5.5 and analyzed by FACS. Data are means ± standard deviations. Significance was verified by Student’s t test.
P < 0.01.
P < 0.001 versus Git2+/+ mice.
To test whether GIT2 depletion also protects mice against chemically induced liver injury, Git2+/+ and Git2−/− mice were injected i.p. with CCl4. The results showed no significant differences in liver injury between Git2+/+ and Git2−/− mice (Fig. 2A and B), which may be due to a different mechanism of liver injury in this model, indicating the potential role of GIT2 in T cell-mediated liver injury.
Fig. 2.

The effect of GIT2 depletion on CCl4 induced liver injury. (A) Serum ALT and AST levels from Git2+/+ and Git2−/− mice (n = 3) were determined at 12 h following injection of CCl4 at the dosage of 1 ml/kg (1:3 diluted in corn oil) intraperitoneally (i.p.). (B) 12 h after 1 ml/kg (1:3 diluted in corn oil) CCl4 injection, mice were sacrificed and the liver tissues were fixed, sectioned and stained with H&E for histopathological and morphological analysis. Scare bar, 200 μm. The percentage of necrotic area was quantitated using ImageJ software and values are the mean ± SD of five fields of measurements.
2.2. GIT2 depletion suppressed lymphoid cells infiltration to liver after Con A treatment
To examine whether GIT2 depletion affects the influx of MNCs in the liver after Con A injection, we first analyzed the steady-state composition of immune cells in the liver of Git2−/− mice. The liver MNCs were isolated and subjected to flow cytometry analysis. As shown in Fig. 3A, the total number of mononuclear cells in the liver of Git2−/− mice was equal to that in Git2+/+ mice. However, the numbers of basal CD4+ T cells and NKT cells were significantly reduced in the liver of Git2−/− mice, whereas the CD8+ cells were increased compared with the Git2+/+ controls. Other liver MNC subsets, such as NK cells and B cells, were not influenced (Fig. 3A).
Fig. 3.


GIT2 depletion suppressed lymphoid cells infiltration to liver after Con A treatment. Liver MNC and splenocyte from Git2+/+ and Git2−/− mice (n = 6) were isolated at 6 h after 15 mg/kg Con A injection. (A) Cell numbers of total liver MNC, CD4+, CD8+, CD19+, NK, and NKT were quantified. (B) Cell numbers and percentage of Tregs were quantified. (C) Cell numbers of total splenocyte, splenic CD4+, splenic Tregs and Tregs percentage were quantified. (D) Cells were labeled with PI and annexin V–FITC and then analyzed by FACS. The results were representative of three independent experiments and error bars represent standard deviations (*P < 0.05, **P < 0.01).
After Con A injection, although increased, the number of MNCs in the liver of Git2−/− mice was significantly lower than that found in Git2+/+ mice (Fig. 3A). Moreover, the degree of increase was much smaller in the number of Git2−/− liver MNC subsets, including CD4+, CD8+ T cells and CD19+ B cells (Fig. 3A). For example, the absolute number of CD4+ T cells in the liver of Git2+/+ mice increased approximately two-fold but only increased 20% in GIT2−/− mice. Consistent with the previous report [17], NKT cells were markedly decreased in both Git2−/− and Git2+/+ mice. Additionally, there was no significant difference in the number of NK cells between Git2+/+ and Git2−/− mice. We also analyzed the percentage of these cell types and the pattern is similar with their number (Table 2). Although the absolute number was the same with control, the percentage of T regulatory cells (Tregs; CD4+CD25+Foxp3+) in the liver of Git2−/− mice was significantly higher than that in Git2+/+ mice after Con A injection (Fig. 3B). In addition, we assessed the absolute number and the percentage of Tregs in splenocyte. As shown in Fig. 3C, the number of splenic mononuclear cells in Git2−/− mice was more than 2-fold higher than that of Git2+/+ mice, which consistent with previous reporter [13]. Prior to Con A treatment, no statistically significant difference was detected in the populations of CD4+ and Tregs in spleens of Git2−/− and Git2+/+ mice. After Con A treatment, the absolute number and percentage of Tregs were significantly higher in Git2−/− spleen than Git2+/+. We also detected the apoptosis of liver MNCs and splenocyte and absence of GIT2 did not significantly change the Con A-induced apoptosis (Fig. 3D). These data suggest that GIT2 deficiency attenuate Con A-induced infiltration of inflammatory cells in the liver which protect Git2−/− mice from liver injury.
Table 2.
Liver MNC subsets in Git2+/+ and Git2−/− mice [mean ± SD, n = 6].
| Cells (%) |
Git2+/+ |
Git2−/− |
||||
|---|---|---|---|---|---|---|
| Control | Con A | Control | Con A | Pa | Pb | |
| CD4 | 34.6 ± 4.7 | 23.65 ± 3.3 | 19.56 ± 2.1⁎⁎⁎ | 12.93 ± 0.3⁎ | 0.000103 | 0.0149 |
| CD8 | 10.89 ± 2.7 | 8.15 ± 0.5 | 16.06 ± 2.1⁎⁎ | 9.36 ± 1.4 | 0.00468 | 0.329 |
| NK | 46.46 ± 1.6 | 23.06 ± 2.2 | 37.76 ± 4.8⁎ | 44.93 ± 3.9⁎⁎ | 0.0419 | 0.00113 |
| NKT | 35.7 ± 3.6 | 3.49 ± 1.9 | 24.56 ± 0.9⁎⁎ | 2.5 ± 1.6 | 0.00695 | 0.536 |
| CD19 | 26 ± 3.5 | 22.66 ± 7.9 | 22.2 ± 2.1 | 10.34667 ± 2.4 | 0.322 | 0.0631 |
Pa versus Git2+/+ mice untreated.
Pb versus Git2+/+ mice at 6 h after Con A injection.
Liver MNC from Git2+/+ and Git2−/− mice (n = 6) were isolated at 6 h after 15 mg/kg Con A injection. The percentage of CD4+, CD8+, CD19+, NK, and NKT in liver MNC were analyzed by FACS using FITC-, PE-, APC-conjugated mAbs.
P < 0.05.
P < 0.01.
P < 0.001 versus Git2+/+ mice.
2.3. Lower levels of proinflammatory cytokines in Git2−/− mice after Con A injection
Proinflammatory cytokine production is a key component of Con A-induced liver injury. We therefore assessed the levels of TNF-α, INF-γ, IL-2, IL-4, IL-6, IL-17A, and IL-10 in the mice serum. As shown in Fig. 4A, no significant differences in cytokine levels were found between vehicle-treated Git2+/+ and vehicle-treated Git2−/− mice. Three hours after Con A administration, the serum levels of TNF-α, IFN-γ, IL-2, IL-4, IL-6, and IL-17A were increased significantly in Git2+/+ mice, and the levels of INF-γ and IL-6 continued to increase 6 h post Con A treatment. However, compared with Con A-treated Git2+/+ mice at 3 h after Con A administration, the analysis of the levels of proinflammatory cytokines showed significant reductions in the TNF-α (55% reduction), IFN-γ (30% reduction), IL-2 (50% reduction), IL-4 (90 % reduction), IL-6 (40% reduction) and IL-17A levels (75% reduction) in Git2−/− mice (Fig. 4A). Interestingly, the level of IL-10, an anti-inflammatory cytokine, was significantly increased both 3 and 6 h post Con A injection in Git2−/− mice.
Fig. 4.


Lower levels of proinflammatory cytokines in Git2−/− mice after Con A injection. Git2+/+ and Git2−/− mice (n = 3) were injected in tail vein with 15 mg/kg Con A. (A) Serum levels of cytokine were determined at indicated time points after Con A injection by ELISA. (B) The mRNA levels of the cytokines in the hepatic homogenate were determined at indicated time points after Con A injection by real-time PCR. The expression levels for the target genes were normalized to GAPDH. The real-time PCR procedure was performed three times. (C) Liver MNCs were isolated 1 h after Con A injection and labeled with FITC- or APC-conjugated CD3 antibody following with stained with FITC-, PE-, APC-conjugated indicated antibodies and analyzed by FACS. The results were representative of three independent experiments and error bars represent standard deviations (*P < 0.05, **P < 0.01, ***P < 0.001).
We also observed that the mRNA cytokine levels in the hepatic homogenate in the Con A model groups increased significantly in comparison to those in the saline control groups (Fig. 4B); however, after Con A injection, the TNF-α, IFN-γ, IL-2, IL-4, and IL-6 expression levels were increased less in the Git2−/− mice than in Git2+/+ mice, whereas the inflammation inhibitory cytokine IL-10 increased to a markedly higher level in Git2−/− mice. The expression levels of several major inflammatory mediators, including MIP-1α, MCP-1 and CXCL10, which have been reported to be important in Con A-induced hepatitis pathogenesis, were also found to be significantly lower in Git2−/− mice than in Git2+/+ mice after Con A injection.
We further examined the percentage of TNF-α-, IFN-γ- and IL-4-producing T cells in the liver MNC by intracellular staining. As shown in Fig. 4C, there were no significant differences in the percentages of TNF-α-, IFN-γ- and IL-4-producing T cells isolated from the liver of Git2−/− and Git2+/+ mice. One hour after Con A treatment, compared with Git2+/+ mice, the percentages of TNF-α-, IFN-γ- and IL-4-producing T cells were increased to a markedly lower degree in the liver of Git2−/− mice. These data suggest that less production of proinflammatory cytokines associated with GIT2 absence may contribute to protection mice from hepatic injury.
2.4. GIT2 depletion suppressed the activation and function of mouse CD4+ T cells
To further clarify the mechanisms underlying the GIT2 depletion-induced inhibition of Con A-induced hepatitis, we assessed the effect of GIT2 depletion on the activation and function of mouse CD4+ T cells in vitro. Purified splenic CD4+ T cells from Git2−/− and Git2+/+ mice were treated with Con A, anti-CD3 plus anti-CD28, or PMA/ionomycin, and flow cytometry was performed to examine the activation markers CD25 and CD69. As shown in Fig. 5A, the expression level of CD25 on CD4+ T cells was significantly weaker in Git2−/− mice than in Git2+/+ mice after treatment with Con A. GIT2 depletion also inhibited the Con A-induced expressions of CD69 on CD4+ T cells (data not shown).
Fig. 5.


Defective TCR-induced CD4+ T cell activation, proliferation, and cytokine production in the absence of GIT2. CD4+ T cells were purified from the spleens of the Git2+/+ and Git2−/− mice. (A) CD25 expression was measured by FACS at 24 h after 2.5 μg/ml Con A treatment as indicated. (B) The CD4+ T cells were stimulated with Con A, anti-CD3 and anti-CD28, PMA/ionomycin as indicated for panel added in vitro for 72 h respectively, and the proliferation was examined at 2 h after BrdU labeling. (C) 5 μM CFSE-labeled splenocyte were stimulated with anti-CD3/CD28 Abs for 72 h or with Con A for 5 d. Cells were harvested and gated on CD4+ T cells for FACS. Unstimulated, CFSE-labeled cells were used to verify the peak corresponding to the undivided population. (D) The cells were treated for 48 h as indicated for panel A, and supernatants were collected. Amounts of TNF-α, IFN-γ and IL-2 were determined by ELISA. (E) The cells were treated as indicated for 48 h, and supernatants were collected. Amounts of TNF-α, IFN-γ, IL-2, IL-4, IL-6, and IL-17 were determined by ELISA. The results were representative of three independent experiments and error bars represent standard deviations (*P < 0.05, **P < 0.01, ***P < 0.001).
The CD4+ T cells were stimulated with Con A, anti-CD3 and anti-CD28, PMA/ionomycin in vitro for 72 h respectively, and the proliferation was examined at 2 h after BrdU labeling. As shown in Fig. 5B, Con A and anti-CD3/anti-CD28 mAb can stimulate both CD4+ T cells from Git2−/− mice and Git2+/+ mice whereas the rate of proliferation was significantly faster in the Git2+/+ CD4+ T cells (P < 0.05), while the effect of PMA/ionomycin treatment showed no difference between Git2+/+ and Git2−/− CD4+ T cells. In addition, the cell division was confirmed by CFSE analyses. Splenocytes from Git2+/+ and Git2−/− mice were labeled with CFSE in vitro and stimulated with plate-bound anti-CD3+ soluble anti-CD28 for 72 h, or with Con A for 5 d, and CD4+ T cells were gated for analyses. Similar division patterns were observed after stimulation with Con A, or anti-CD3/anti-CD28 mAb (Fig. 5C).
To investigate whether CD4+ T cells from Git2−/− mice can produce sufficient levels of cytokines, we compared the amounts of IL-2, IFNγ and TNFα produced by the splenic CD4+ T cells from Git2−/− and Git2+/+ mice after Con A, anti-CD3 plus anti-CD28, or PMA/ionomycin stimulation. The results showed a significantly reduced production of TNF-α, IL-2 and IFN-γ by Git2−/− CD4+ T cells than by those from Git2+/+ mice after stimulation with Con A or anti-CD3 plus anti-CD28 (Fig. 5D). However, PMA/ionomycin induced normal levels of TNF-α, IL-2 and IFNγ in Git2−/− CD4+ T cells (Fig. 5D). Furthermore, we assessed the amounts of TNF-α, INF-γ, IL-2, IL-4, IL-6, and IL-17A produced by splenic CD4+ T cells from Git2−/− and Git2+/+ mice after induction with different doses of Con A. As shown in Fig. 5E, compared with Git2+/+ mice, there was a significant decrease in the production of proinflammatory cytokines by T cells from Git2−/− mice. These data suggest that GIT2 is required for CD4+ T cells activation which likely explains the reduction in CD4+ T cells in GIT2−/− mice after Con A treatment.
2.5. Impaired TCR-mediated signal transduction in CD4+ T cells from GIT2-depleted mice
The defects in T-cell activation phenotype are often due to impaired TCR-induced signaling events. To demonstrate the molecular mechanisms mediating the failed induction in Git2−/− T cells, we assessed the activation of several signaling molecules downstream of the TCR. As shown in Fig. 6A, GIT2-difecient T cells did not show any substantial defects in phosphorylation of ERK1/2 after anti-CD3 plus anti-CD28 or Con A stimulation. However, a significant increase in phosphorylation of PAK was observed in wildtype T cells but not in GIT2-deficient T cells (Fig. 6A). Likewise, Rac activation occurred as early as 1 min following anti-CD3 plus anti-CD28 stimulation in wildtype T cells, whereas deficiency in GIT2 resulted in later Rac activation with a peak induction at 5 min post TCR stimulation (Fig. 6B). It has been reported that GIT2 is required for PAK activation upon formation of the immunological synapse. We therefore measured the total amount of cellular F-actin assembled after TCR stimulation. We found that anti-CD3 plus anti-CD28 induced F-actin assembly similarly in wildtype and Git2−/− T cells (Fig. 6C). However, we noted that polarized F-actin assembly appeared in wildtype but not Git2−/− T cells upon anti-CD3 plus anti-CD28 stimulation (Fig. 6D). These data indicated that GIT2 plays an important role in TCR-mediated signal transduction in T cells.
Fig. 6.

Defective TCR-induced signaling in the absence of GIT2. Purified splenic T cells from the Git2+/+ and Git2−/− mice were stimulated by 5 μg/ml anti-CD3 plus 2 μg/ml anti-CD28 at indicated time. (A) ERK1/2 and PAK phosphorylation were analyzed using phospho-specific antibodies. Nonphosphorylated proteins served as a control. The immunoblot bands were scanned for densitometry analysis with the value obtained from control cells set as 1 (bottom). The results were representative of three independent experiments and error bars represent standard deviations (*P < 0.05). (B) Cell extracts were incubated with glutathione S-transferase-PAK RBD to precipitate GTP-bound Rac1 (Rac1-GTP). Anti-Rac1 antibody was used to detect GTP-bound GTPases. Total Rac1 served as a control. The immunoblot bands were scanned for densitometry analysis with the value obtained from control cells set as 1 (right). The results were representative of three independent experiments and error bars represent standard deviations (*P < 0.05). (C and D) The cells were fixed, stained with FITC-phalloidin and anti-CD3, and analyzed by confocal and FACS. All data are representative of at least three independent experiments, Scale bar, 10 μm. All data are representative of at least three independent experiments.
2.6. GIT2 increased protein stability of αPIX
Because GIT2 regulates diverse cellular functions through interacting with various proteins, we analyzed the protein levels of GIT2 partners, such as PAK, PIX, Rac1 and Cdc42. The results showed similar expression of PAK, Rac1, or Cdc42; except for the reduction of PIX expression in GIT2-deficient T cells (Fig. 7A). The reduction in PIX protein was further confirmed in the thymus, spleens, and lymph nodes of Git2−/− mice using an anti-PIX antibody that recognizes both αPIX and βPIX (Fig. 7B). This effect of GIT2 on the PIX protein levels was found to not be due to changes in their transcription because GIT2 deficiency did not significantly alter the abundance of PIX mRNA in the thymus and spleens cells (Fig. 7C). Moreover, compared with control cells, a clear reduction in PIX stability was observed in GIT2-deficient T cells. In contrast, the PIX half-life was higher than 36 h in wild-type GIT2 cells and was shortened to ∼8–10 h in GIT2-deficient T cells (Fig. 7D). To demonstrate that the reduction in the PIX protein levels was a direct consequence of GIT2 deficiency, we reestablished the wild-type GIT2 expression levels in GIT2-deficient T cells using a lentivirus-based approach. The expression of full-length GIT2 led to a significant increase in the PIX steady-state protein levels (Fig. 7E).
Fig. 7.

GIT2 Increased Protein Stability of αPIX. (A) Purified splenic T cells from the Git2+/+ and Git2−/− mice were analyzed for the expression of PAK, PIX, Rac1, and CDC42 by western-blot. Antibodies against the GAPDH served as a control. (B) Cell homogenates from the indicated tissues from the Git2+/+ and Git2−/− mice were resolved by SDS–PAGE and immunoblotted with a polyclonal anti-PIX antibody. (C) Expression analysis of αPIX or βPIX in indicated tissues by real-time PCR using primers recognizing either αPIX or βPIX. (D) Purified splenic T cells from the Git2+/+ and Git2−/− mice were cultured on 24-well plates with or without 50 μg/ml of cycloheximide (CHX) for the indicated times. (E) Purified splenic T cells from the Git2−/− mice were cultured on 24-well plates and infected with pBPLV-GIT2 or mock virus. 24 h later, the cells were treated with or without 50 μg/ml of cycloheximide (CHX) for the indicated times. αPIX and GIT2 expression were analyzed by Western blotting. Antibodies against the GAPDH served as a control. For (D) & (E), the immunoblot bands were scanned for densitometry analysis with the value obtained from control cells set as 1 (bottom). The results were representative of three independent experiments and error bars represent standard deviations (*P < 0.05).
3. Discussion
In this study, we provide the first evidence that GIT2 plays an important role in the pathogenesis of Con A-induced hepatitis. We showed that the targeted disruption of the GIT2 gene led to attenuated liver injury, which was associated with reductions in the number of effector cells, namely T lymphocytes (both CD4+ and CD8+), CD19+ B lymphocytes and NKT cells, accompanied by lower serum levels of TNF alpha, IFN gamma, IL-2, IL-4, and IL-17 and an increase in the serum level of IL-10.
The flow cytometry analyses of liver lymphocytes from GIT2-deficient mice showed a relative increase in CD8+ T cells and reductions in CD4+ and NKT cells under basal conditions. The CD4+/CD8+ ratio is a reflection of immune system health, and its decrease or increase indicates a dysfunction of the immune system [18,19]. In our study, in accordance with previous reports [13], Git2−/− mice often developed splenomegaly, suggesting that Git2−/− mice may be highly susceptible to infection, which may occur sporadically with some pathogens even in specific pathogen-free housing conditions. This result indicated that the loss of GIT2 in vivo led to an immunodeficient state.
The infiltration of lymphocytes into the liver is critical for the development of Con A-induced hepatitis. We found that the targeted disruption of the GIT2 gene led to a suppression of the infiltration of MNCs, particularly CD4+ and CD8+ lymphocytes. Two possible mechanisms may be involved in the reduction in the number of liver-infiltrating effector cells after the loss of GIT2. (1) Inflammatory responses to injury are characterized by increased lymphocyte binding to and migration across sinusoidal endothelial cells that line the hepatic sinusoidal microvasculature [20,21]. Lymphocytes interact with the sinusoidal endothelium via adhesion receptors, including intercellular adhesion molecular-1 (ICAM-1), and ICAM-1-deficient mice demonstrate reduced leukocyte adhesion to hepatic sinusoids [22,23]. In our study, we found that the expression of ICAM-1 in the hepatic homogenate from Git2−/− mice was significantly diminished compared with that found in the homogenate from Git2+/+ mice, which may lead to less T cells are recruited to the liver where they drive immune-mediated damage (Fig. 8). (2) Chemokines are crucial for lymphocyte trafficking to the liver, and in particular, chemokines secreted by liver cells contribute to the compartmentalization of lymphocyte recruitment within the liver [21,24]. It has been reported that the gene ablation of GIT2 in mouse neutrophils results in defective chemotaxis toward GPCR ligands, fMLP and C5a [13]. In our study, we measured the expression of several chemoattractant factors in hepatic homogenates and found that the loss of Git2 significantly suppressed the mRNA expression of MIP-1α [CCL3] and CXCL10, which may affect the attraction of effector cells in the liver of Git2−/− mice after Con A injection.
Fig. 8.
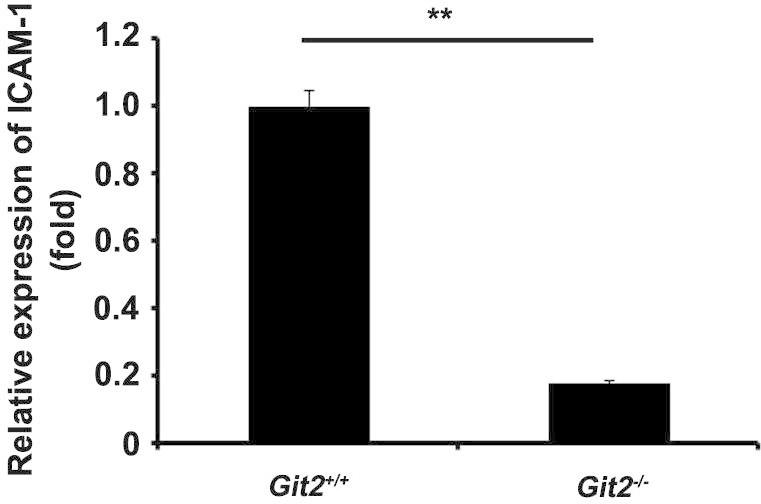
The effect of GIT2 depletion on the expression of ICAM-1. The mRNA levels of ICAM-1 in the hepatic homogenate were determined by real-time PCR. The expression levels for the target genes were normalized to GAPDH. The real-time PCR procedure was performed three times. The results were representative of three independent experiments and error bars represent standard deviations (*P < 0.05).
After infiltration into the liver tissue, T cell recognition of the antigen presented by a dendritic cell results in an activated effector T cell and the production of large amounts of cytokines, such as tumor necrosis factor alpha (TNFα) and interferon gamma (IFNγ), contributing to hepatocyte necrosis and apoptosis [25,26]. In this study, we found that GIT2-deficient T cells showed marked impairments in T cell functions following TCR stimulation, including poor activation phenotypes of CD25 and CD69 expression, proliferation and cytokine production, compared with those from WT mice, suggesting that GIT2 plays an important role in the activation of T lymphocytes. We further showed that stimulation with PMA plus ionomycin, which bypasses the TCR complex, resulted in similar T cell proliferation and cytokine production in WT and Git2−/− mice. PMA is a DAG analog which can pass through cell membrane freely and activates PKC directly. Ionomycin is a Ca2+ ionophore which can raise intracellular Ca2+ levels and stimulate calcineurin. It has been reported that calcineurin cooperated with PKC to transduce mitogenic signals and led to the activation of the transcription factors AP-1 and NF-AT, which are involved in IL-2 gene induction [27]. Therefore, it seems that GIT2 regulates relatively ‘upstream’ events in TCR signaling. Various signaling events occur after TCRs bind to pMHC on antigen-presenting cells (APCs) to initiate and sustain T cell activation, including protein phosphorylation, generating immunological synapse, intracellular calcium flux, small GTPase activation, cytoskeletal remodeling, and transcription factor activation [28]. In these intracellular signaling transduction processes, one group of signaling proteins, such as Grb2, Gads, and SLP-76, which are collectively termed “adapter” or “linker” proteins, are essential for T cell activation by mediating TCR signaling [29]. The function of the GIT2 protein in the regulation of the cytoskeletal structure, membrane trafficking and the scaffolding of signaling cascades have been described in detail [5], which suggested that GIT2 may be involved in T cell activation as a kind of linker proteins. In this study, we found that GIT2-deficient T cells displayed distempered TCR signaling events, such as PAK phosphorylation. A previous study showed that GIT2 interacts with PIX and PAK constitutively in a tri-molecular complex in T cells, and PIX-deficient T cells displayed defective TCR-induced proliferation and signaling [12]. In addition, it has been shown that neutrophils from either GIT2- or αPIX-knockout animals present impaired chemotactic responses [12,13]. The phenotype resemblance between the Git2−/− and PIX−/− mice suggest that these proteins may regulate T cell function through similar mechanisms. Interestingly, we found that the PIX protein level is marked reduced in GIT2-deficient T cells. We also provide evidence that Git2 increased the protein stability of αPIX, similarly to how PIX stabilizes GIT2 in lymphocytes. Therefore, whether the functional defects in the Git2−/− T cells may be due to the loss of Git2 or PIX remain to be investigated.
NKT cells are a heterogeneous group of T lymphocytes that express both the NK1.1 receptor and the TCR. It has been reported that NKT cells are abundant in the liver and play an important role in Con A-induced hepatitis via secretion of proinflammatory cytokines such as IFN-γ. In our research, we found that liver lymphocytes in GIT2 deficient mice showed reduce in NKT cells in basal conditions, which may lead to less secretion of IFN-γ upon Con A administration. Moreover, we found that CD3+NK1.1+NKT cells are markedly decreased 6 h after Con A injection, in agreement with other researchers [17]. There are two possibilities for the mechanisms associated with the change in the NKT cell number at the early stage of Con A-induced liver injury. First, Con A induced FasL expression on NKT cells not only resulted in liver injury but also led to apoptosis of activated NKT cells in the liver [30]. Second, activation of NKT cells upon Con A administration may lead to a dynamic response characterized by surface markers down-modulation, which has been found in the response of NKT cells to glycolipid antigens [31]. Although we observed a decrease in the number of NKT cells in the liver after Con A injection, the levels in Git2−/− and Git2+/+ mice were equivalent 6 h after Con A injection. Thus, NKT cells may not be the major effector cells involved in the process of inhibition of hepatitis by Git2 deficiency.
CD4+CD25+Foxp3+ regulatory T (Treg) cells have been shown to be implicated in a number of pathologic processes, such as cancers, infectious disease, and autoimmune disease [32,33]. Foxp3 is a critical regulator of Treg development and function which is supported by the fact that the lethal lymphoproliferative autoimmune syndrome observed in Foxp3-deficient mice resulted from a dificienty in CD25+CD4+ Tregs [34]. Furthermore, Foxp3 is currently the most specific and reliable molecular marker for natural Tregs in rodents and human [35,36]. In this study, we demonstrated that the deletion of GIT2 increased the percentage of Tregs in liver and spleen and increased the number of CD4+CD25+Foxp3+ cells in spleen compared with Git2+/+ mice after Con A injection. Consistent with this observation, we clearly showed a significantly elevated level of IL-10, which is one of the downstream effectors induced by Foxp3, in the serum of Git2−/− compared with WT mice. Although the physiological factors and pathways initiating intracellular Foxp3 expression and promoting its immune regulatory characteristics remain poorly understood, recent studies have revealed that disruption of the signaling components of the NF-κB pathway, including NF-κB-inducing kinase (NIK) and TNF receptor-associated factor 6 (Traf6), leads to impairments in regulatory T cell generation [37,38]. It was recently reported that GIT2 may terminate TLR-induced NF-κB and MAPK signaling by recruiting the deubiquitinating enzyme cylindromatosis to inhibit the ubiquitination of TRAF6 [39]. Therefore, the higher number of CD4+CD25+Foxp3+ cells found in the mice lacking Git2 may be due to the loss of negative regulation of Toll-like receptor (TLR)-induced NF-κB signaling. Furthermore, given that impaired Treg suppressive activity is associated with impaired activation of the GIT–PIX–PAK complex [40], it would be important to compare the suppressive activity of Treg from WT versus KO mice in a standard in vitro Treg suppression assay. However, we did not observe the obvious difference in suppressive activity between WT versus KO mice (Fig. 9), the reason of which should be studied further.
Fig. 9.

The effect of isolated Tregs on proliferation of responder cells. CD4+CD25− responders were labeled with CFSE and cultured alone or with CD4+CD25+ Tregs at a ratio of 2:1 in the presence of 5 μg/ml Con A. Cells were harvested and gated on CD4+CD25− T cells for FACS. Unstimulated, CFSE-labeled cells were used to verify the peak corresponding to the undivided population.
Because the longest splice form of GIT2 (GIT2-long) is widely expressed, including in the heart, brain, spleen, lung, kidney, liver, muscle, and testis, whether hepatic cells are also responsible for the Git2−/− phenotype associated with the reduced response to Con A hepatitis should be studied further [6]. Given that the GIT2/PIX/PAK1 tri-complex plays a major role in PAK1 activation and that PAK1 is important for cellular survival and proliferation [9,10,41], GIT2 also might regulate hepatocyte survival through control of PAK1 signaling. Although we showed no significant difference in CCl4-induced liver injury between Git2−/− and WT mice, which suggests that GIT2 deficiency may not affect parenchymal function, experiments involving bone marrow chimeras between GIT2 knockout and wild-type mice may finally help to delineate the parenchymal effects.
In summary, this study provides the first demonstration that GIT2 deficiency protects mice from Con A-induced hepatitis by suppressing the function of activated T cells and reducing the intrahepatic infiltration of inflammatory cells. Further work is required to evaluate GIT2 as a potential target in hepatitis in humans.
4. Materials and methods
4.1. Mice
Git2+/− mice were obtained from Osaka Bioscience Institute (Japan) and Git2−/− mice were generated by intercrossing of Git2+/− mice [13]. All mice were housed in a SPF conditions and the protocols used for all animal experiments in this study were approved by the Animal Research Committee of Beijing Institute of Radiation Medicine Animal Center (Beijing, China).
4.2. Antibodies
All antibodies were purchased from commercial sources: CD3-phycoerythrin (PE), CD4-allophycocyanin (APC), CD4-peridinin-chlorophyll–protein complex (PerCP), CD19-PE, CD3-APC, CD3-fluorescein isothiocyanate (FITC), CD8-PE, NK1.1-APC, F4/80-PE, CD11c-PE, CD11c-APC, IL-4-PE, IFN-γ-APC, TNFα-FITC, CD69-APC, anti-CD3 Abs, and anti-CD28 Abs from eBioscience; Rabbit polyclonal GIT2 Abs, anti-phospho-PAK1/2 (Ser199/204 of PAK1 and Ser192/197 of PAK2 Abs, and anti-phospho-c-Cbl (Y774) Abs from Cell Signaling; Anti-phospho-Erk1/2 (E4) Abs, anti-PAKα, anti-Erk1/2 (K23) from Santa Cruz.
4.3. PCR, reverse-transcription and real-time PCR
Genomic DNA was prepared as described previously and the genotypes of the mice were determined by PCR [13,42]. The oligonucleotide PCR primers that were used to distinguish the targeted allele from the wild-type allele were as follows: GIT2-S1, 5′-TGCAGGGTCATTGGAGAGTGAATGAGGCTA-3′; GIT2-S2, 5′-GGTTTGAGCAAGAGAACTCATCGGTCCAAG-3′ and Neo, 5′-CTCGTGCTTTACGGTATCGCC-3′. The GIT2-S1 and GIT2-S2 primers gave an 1131-bp DNA fragment to identify the WT allele, whereas the GIT2-S2 and Neo primers yielded the 650-bp fragment of the target allele. The PCR was carried out for 30 cycles consisting of 94 °C, 1 min; 60 °C, 30 s and 72 °C, 2 min.
Reverse-transcription and real-time PCR were performed as described previously [43]. Specific primers for each gene were listed in Table 3.
Table 3.
Sequences of primers used for real-time PCR.
| Primers | Sequence[5′ → 3′] |
|---|---|
| IL-2 forward | GTCAACAGCGCACCCACTT |
| IL-2 reverse | TGCTTCCGCTGTAGAGCTTG |
| IL-4 forward | ACAGGAGAAGGGACGCCAT |
| IL-4 reverse | GAAGCCCTACAGACGAGCTCA |
| IL-6 forward | GAGGATACCACTCCCAACAGACC |
| IL-6 reverse | AAGTGCATCATCGTTGTTCATACA |
| IL-10 forward | TGGCCCAGAAATCAAGGAGC |
| IL-10 reverse | CAGCAGACTCAATACACACT |
| TNF-α forward | CTGTAGCCCACGTCGTAGC |
| TNF-α reverse | TTGAGATCCATGCCGTTG |
| INF-γ forward | TCAAGTGGCATAGATGTGGAAGAA |
| INF-γ reverse | TGGCTCTGCAGGATTTTCATG |
| MCP-1 forward | GCTGGAGAGCTACAAGAGGATCA |
| MCP-1 reverse | CCTCTCTCTTGAGCTTGGTGACA |
| MIP-1α forward | GCGCCATATGGAGCTGACAC |
| MIP-1α reverse | TCAGGCATTCAGTTCCAGGT |
| CXCL10 forward | CCGTCATTTTCTGCCTCATCCT |
| CXCL10 reverse | T CTCCACATTGTCTTTTGACCT |
| ICAM-1 forward | CCATCACCGTGTATTCGT |
| ICAM-1 reverse | GCTGGCGGCTCAGTATCT |
4.4. Cell purification, cell surface labeling, and flow cytometry
Mice were sacrificed via cervical dislocation. Thymuses, spleens, lymph nodes, and bone marrow were dissected and crushed in RPMI 1640 medium. Livers were passed through a 100 μm nylon mesh. The filtrate was centrifuged at 50 g for 5 min and the supernatant was collected. Cells were suspended in a 40% percoll (GE Healthcare) solution and overlaid on a 70% percoll solution. After centrifugation with 800g for 20 min, the interphase was collected and washed twice with PBS. For spleen and bone marrow cells and liver mononuclear cells, samples were depleted of red blood cells using lysis solution (100 mM NH4Cl, pH 7.4) no more than 5 min. Lymphocyte populations were characterized using FITC-, PE-, APC-conjugated mAbs; for Tregs, Foxp3 detection kit (eBioscience) was used, and analyzed by flow cytometry (FACScan; BD Biosciences, San Jose, CA, USA) and FlowJo software (Tree Star, Ashland, OR) was used for data analysis.
4.5. Cytokine detection
For detection of various cytokines, plasma samples were collected from mice or cells at indicated time after Con A injection and immediately frozen at −70 °C and stored until use. BD Cytometric Bead Array (CBA) Mouse Th1/Th2/Th17 Cytokine Kit (for GM-CSF, IL-1b, IL-2, IL-4, IL-5, IL-6, IL-10, IL-12, IFN-γ and tumor necrosis factor (TNF)-α) was purchased from BD Biosciences. All procedures were performed according to the manufacturer’s protocol.
4.6. Experimental acute toxic hepatitis model
Con A was dissolved in sterile PBS and injected in the tail vein at the dose of 15 mg/kg (for liver pathology) of bodyweight as indicated. For assessment of liver damage, mice were sacrificed at the indicated time points, and serum and liver specimens were collected.
4.7. Alanine aminotransferase (ALT) and aspartate aminotransferase (AST) assay
Serum activities of ALT and AST were measured with an autoanalyser (Hitachi 7020 automatic analyser, Hitachi, Tokyo, Japan) and expressed in IU/L.
4.8. Histological examination and terminal deoxynucleotidyl transferase-mediated dUTP nick-end labeling (TUNEL) assay
Formalin-fixed, paraffin-embedded liver sections were stained with hematoxylin–eosin for the histological investigations to evaluate the degree of necrosis after acute liver injury, which is based on severity of necrotic lesions in the liver parenchyma.
The TUNEL assay was performed using The DeadEnd Colorimetric TUNEL System (Promega) according to the manufacturer’s protocol. The TUNEL-positive cells were quantitated by light microscopy. Five (3200 magnification) fields were randomly selected per slide and 100 hepatocytes counted per field. The mean percentage of apoptotic hepatocytes was calculated and compared between different study groups.
4.9. Intracellular cytokines detection
Liver MNCs were extracted from mice 1 h after Con A injection and were resuspended to a density of 107 cells/ml and 100-μl aliquots of the cell suspension were distributed into tubes for cell surface staining. Cells were incubated with FITC-conjugated CD3 antibody (for IFN-γ and IL-4) or APC-conjugated CD3 antibody (for TNFα) in the dark at 4 °C for 30 min. The cells were washed once with RPM1 1640 with 2% FBS and spun at 800g, 4 °C for 5 min. They were fixed and permeabilized with Cytofix/Cytoperm solution (20 min at 4 °C). Then, the cells were washed twice in Perm/Wash solution, and pelleted cells were stained (30 min at 4 °C) for intracellular cytokines by using PE-conjugated IL-4 antibody and APC-conjugated IFN-γ antibody, and FITC-conjugated TNFα antibody. PE, APC, or FITC-conjugated isotype controls were used in parallel. After the cells were washed twice in PBS with 0.1% BSA, the cells were suspended in PBS–BSA and analyzed immediately by flow cytometry (FACScan; BD Biosciences, San Jose, CA, USA) and FlowJo software (Tree Star, Ashland, OR) was used for data analysis.
4.10. CD4+ T-cell preparation and activation assay
CD4+ T cells from the spleens of the mice were affinity purified using MACS isolation beads. The purity of the purified CD4+ T cells was 94–99%, as determined by flow cytometry (FACScan; BD Biosciences, San Jose, CA, USA) and FlowJo software (Tree Star, Ashland, OR) was used for data analysis.
Cells were treated with 2.5 μg/ml Con A, or 5 μg/ml anti-CD3 antibodies plus 2 μg/ml CD28 antibodies, or 5 ng/ml PMA/0.5 μg/ml ionomycin. The activation phenotypes of CD25 and CD69 expressions were measured by FACS analysis. Proliferation was determined after 72 h using a BrdU Cell Proliferation Assay Kit (Cell Signaling Technology).
4.11. CFSE analysis
CFSE labeling was performed as described previously with a little change [44]. Briefly, 1 × 10⁷ cells were suspended in 1 ml serum-free medium (DKW34-EU0100, DAKEWE, China); 5 μl of 1 mM CFSE (LC01, Dojindo Laboratories) was added, and cells were incubated at 37 °C for 15 min with frequent mixing. An equal volume of FCS was added, and cells were washed two times with PBS. Cells were resuspended in serum-free medium (1 × 10⁶/ml) and seeded in 96-well flat-bottom culture plates. The cell division status of cells was determined by measuring CFSE fluorescence at indicated time. CFSE fluorescence was detected with the FL1 detector (488 nm). Data were analyzed using Cell Quest (BD Biosciences).
4.12. Isolation of CD4+CD25+ Tregs and responder T cells
The isolation was performed using magnetic bead separation (CD4+CD25+ Regulatory T Cell Isolation Kit, mouse, Miltenyi Biotec) according to the protocol. Briefly, CD4+ T cell were enriched using a biotinylated antibody cocktail and anti-biotin microbeads by depletion of all non-CD4+ T cells. CD4+CD25+ T cells were isolated by positive selection using PE-labeled anti-CD25 MAb and anti-PE microbeads.
4.13. Stimulation of cytokine secretion in vitro
CD4+ T cell from the spleens of the mice were incubated at a density of 2 × 10⁵ per well in a 96-well plate. Cells were stimulated with Con A at various concentrations (1, 2.5, or 5 μg/ml) for up to 48 h. Supernatants (100 μl) were taken and immediately frozen at −70 °C and stored until detection with BD Cytometric Bead Array (CBA) Mouse Th1/Th2/Th17 Cytokine Kit (for GM-CSF, IL-1β, IL-2, IL-4, IL-5, IL-6, IL-10, IL-12, IFN-γ and tumor necrosis factor (TNF) α).
4.14. Lentiviral constructs and transduction
For overexpression of GIT2 in T cells, the ViraPower lentiviral expression system was used according to the manufacturer’s protocol (Invitrogen). The cDNA fragment encoding mouse GIT2 was cloned into the lentivirus expression plasmid pBPLV, which has two CMV promoters and an IRES-GFP tag, and construct pBPLV-GIT2. The recombinant vector pBPLV-GIT2 expresses GIT2 protein and GFP protein simultaneously. 293FT cells were transfected using Lipofectamine 2000 (Invitrogen). Lentiviruses were concentrated at 4 °C by centrifugation. Cells transduced with pBPLV vectors were cultured in liquid medium for 48 h and then purified by FACS sorting for GFP expression.
4.15. Statistical analysis
Statistical analysis was performed using SPSS18.0 software. The statistical significance of differences between two sample groups was assessed by the t-test, between multiple groups with multi-level was assessed by factorial analysis. One-way ANOVA analysis was used in group with multi-level. When met heterogeneity of variance, select the Welch statistic in one-way ANOVA analysis. P < 0.05 difference was statistically significant.
Funding
This work was supported by the National Program on Key Basic Research Project: 2013CB910801; National High-tech R&D Program of China: 2012AA020201; National Program on Key Basic Research Project: 2011CB910601 & 2011CB915501.
Conflict of interest
The authors who have taken part in this study declared that they do not have anything to disclose regarding funding or conflict of interest with respect to this manuscript.
Authorship
Author contributions: Yu-E Hao, Dong-Fang He, Miao Yu, and Xiao-Ming Yang designed research; Yu-E Hao, Rong-Hua Yin, Dong-Fang He, Shao-Xia Wang and Hui Chen performed research; Yi-Qun Zhan, Chang-Yan Li, and Chang-Hui Ge analyzed data; and Miao Yu and Xiao-Ming Yang wrote the paper.
Acknowledgments
We thank Dr. Hisataka Sabe (Osaka Bioscience Institute) and the RIKEN BioResource Center for providing the Git2+/− mice.
Contributor Information
Miao Yu, Email: yumiaoer@hotmail.com.
Xiao-Ming Yang, Email: xiaomingyang@sina.com.
References
- 1.Wu Z., Han M., Chen T., Yan W., Ning Q. Acute liver failure: mechanisms of immune-mediated liver injury. Liver Int. 2010;30:782–794. doi: 10.1111/j.1478-3231.2010.02262.x. [DOI] [PubMed] [Google Scholar]
- 2.Dong Z., Wei H., Sun R., Tian Z. The roles of innate immune cells in liver injury and regeneration. Cell. Mol. Immunol. 2007;4:241–252. [PubMed] [Google Scholar]
- 3.Wang H.X., Liu M., Weng S.Y., Li J.J., Xie C., He H.L., Guan W., Yuan Y.S., Gao J. Immune mechanisms of concanavalin A model of autoimmune hepatitis. World J. Gastroenterol. 2012;18:119–125. doi: 10.3748/wjg.v18.i2.119. [DOI] [PMC free article] [PubMed] [Google Scholar]
- 4.Tiegs G., Hentschel J., Wendel A. A T cell-dependent experimental liver injury in mice inducible by concanavalin A. J. Clin. Invest. 1992;90:196–203. doi: 10.1172/JCI115836. [DOI] [PMC free article] [PubMed] [Google Scholar]
- 5.Hoefen R.J., Berk B.C. The multifunctional GIT family of proteins. J. Cell Sci. 2006;119:1469–1475. doi: 10.1242/jcs.02925. [DOI] [PubMed] [Google Scholar]
- 6.Premont R.T., Claing A., Vitale N., Perry S.J., Lefkowitz R.J. The GIT family of ADP-ribosylation factor GTPase-activating proteins. Functional diversity of GIT2 through alternative splicing. J. Biol. Chem. 2000;275:22373–22380. doi: 10.1074/jbc.275.29.22373. [DOI] [PubMed] [Google Scholar]
- 7.Brown M.C., Cary L.A., Jamieson J.S., Cooper J.A., Turner C.E. Src and FAK kinases cooperate to phosphorylate paxillin kinase linker, stimulate its focal adhesion localization, and regulate cell spreading and protrusiveness. Mol. Biol. Cell. 2005;16:4316–4328. doi: 10.1091/mbc.E05-02-0131. [DOI] [PMC free article] [PubMed] [Google Scholar]
- 8.Brown M.C., West K.A., Turner C.E. Paxillin-dependent paxillin kinase linker and p21-activated kinase localization to focal adhesions involves a multistep activation pathway. Mol. Biol. Cell. 2002;13:1550–1565. doi: 10.1091/mbc.02-02-0015. [DOI] [PMC free article] [PubMed] [Google Scholar]
- 9.Ku G.M., Yablonski D., Manser E., Lim L., Weiss A. A PAK1–PIX–PKL complex is activated by the T-cell receptor independent of Nck, Slp-76 and LAT. EMBO J. 2001;20:457–465. doi: 10.1093/emboj/20.3.457. [DOI] [PMC free article] [PubMed] [Google Scholar]
- 10.Phee H., Abraham R.T., Weiss A. Dynamic recruitment of PAK1 to the immunological synapse is mediated by PIX independently of SLP-76 and Vav1. Nat. Immunol. 2005;6:608–617. doi: 10.1038/ni1199. [DOI] [PubMed] [Google Scholar]
- 11.Gavina M., Za L., Molteni R., Pardi R., de Curtis I. The GIT–PIX complexes regulate the chemotactic response of rat basophilic leukaemia cells. Biol. Cell. 2010;102:231–244. doi: 10.1042/BC20090074. [DOI] [PMC free article] [PubMed] [Google Scholar]
- 12.Missy K., Hu B., Schilling K., Harenberg A., Sakk V., Kuchenbecker K., Kutsche K., Fischer K.D. AlphaPIX Rho GTPase guanine nucleotide exchange factor regulates lymphocyte functions and antigen receptor signaling. Mol. Cell. Biol. 2008;28:3776–3789. doi: 10.1128/MCB.00507-07. [DOI] [PMC free article] [PubMed] [Google Scholar]
- 13.Mazaki Y., Hashimoto S., Tsujimura T., Morishige M., Hashimoto A., Aritake K., Yamada A., Nam J.M., Kiyonari H., Nakao K., Sabe H. Neutrophil direction sensing and superoxide production linked by the GTPase-activating protein GIT2. Nat. Immunol. 2006;7:724–731. doi: 10.1038/ni1349. [DOI] [PubMed] [Google Scholar]
- 14.Phee H., Dzhagalov I., Mollenauer M., Wang Y., Irvine D.J., Robey E., Weiss A. Regulation of thymocyte positive selection and motility by GIT2. Nat. Immunol. 2010;11:503–511. doi: 10.1038/ni.1868. [DOI] [PMC free article] [PubMed] [Google Scholar]
- 15.Zabaneh D., Balding D.J. A genome-wide association study of the metabolic syndrome in Indian Asian men. PLoS One. 2010;5:e11961. doi: 10.1371/journal.pone.0011961. [DOI] [PMC free article] [PubMed] [Google Scholar]
- 16.Jiang W., Zheng L., Yang Q., Huang Z., Wang X. Investigation into the effect of hepatitis B virus on apolipoprotein A1 expression and its mechanism. Lipids Health Dis. 2014;13:130. doi: 10.1186/1476-511X-13-130. [DOI] [PMC free article] [PubMed] [Google Scholar]
- 17.Gao B., Radaeva S., Park O. Liver natural killer and natural killer T cells: immunobiology and emerging roles in liver diseases. J. Leukoc. Biol. 2009;86:513–528. doi: 10.1189/jlb.0309135. [DOI] [PMC free article] [PubMed] [Google Scholar]
- 18.Lou Y.F., Dong W., Ye B., Lin S., Mao W.L. Changes in peripheral T-lymphocyte subsets in acute-on-chronic liver failure patients with artificial liver support system. Hepatogastroenterology. 2012;59:814–817. doi: 10.5754/hge10064. [DOI] [PubMed] [Google Scholar]
- 19.Hussain T., Kulshreshtha K.K., Yadav V.S., Katoch K. CD4+, CD8+, CD3+ cell counts and CD4+/CD8+ ratio among patients with mycobacterial diseases (Leprosy, Tuberculosis), HIV infections and Normal Healthy Adults: a comparative analysis of studies in different regions of India. J. Immunoassay Immunochem. 2014 doi: 10.1080/15321819.2014.978082. [DOI] [PubMed] [Google Scholar]
- 20.Adams D.H., Eksteen B. Aberrant homing of mucosal T cells and extra-intestinal manifestations of inflammatory bowel disease. Nat. Rev. Immunol. 2006;6:244–251. doi: 10.1038/nri1784. [DOI] [PubMed] [Google Scholar]
- 21.Adams D.H., Ju C., Ramaiah S.K., Uetrecht J., Jaeschke H. Mechanisms of immune-mediated liver injury. Toxicol. Sci. 2010;115:307–321. doi: 10.1093/toxsci/kfq009. [DOI] [PMC free article] [PubMed] [Google Scholar]
- 22.Lee W.Y., Kubes P. Leukocyte adhesion in the liver: distinct adhesion paradigm from other organs. J. Hepatol. 2008;48:504–512. doi: 10.1016/j.jhep.2007.12.005. [DOI] [PubMed] [Google Scholar]
- 23.Roy-Chaudhury P., Wu B., King G., Campbell M., Macleod A.M., Haites N.E., Simpson J.G., Power D.A. Adhesion molecule interactions in human glomerulonephritis: importance of the tubulointerstitium. Kidney Int. 1996;49:127–134. doi: 10.1038/ki.1996.17. [DOI] [PubMed] [Google Scholar]
- 24.Shetty S., Lalor P.F., Adams D.H. Lymphocyte recruitment to the liver: molecular insights into the pathogenesis of liver injury and hepatitis. Toxicology. 2008;254:136–146. doi: 10.1016/j.tox.2008.08.003. [DOI] [PMC free article] [PubMed] [Google Scholar]
- 25.Kusters S., Gantner F., Kunstle G., Tiegs G. Interferon gamma plays a critical role in T cell-dependent liver injury in mice initiated by concanavalin A. Gastroenterology. 1996;111:462–471. doi: 10.1053/gast.1996.v111.pm8690213. [DOI] [PubMed] [Google Scholar]
- 26.Gantner F., Leist M., Lohse A.W., Germann P.G., Tiegs G. Concanavalin A-induced T-cell-mediated hepatic injury in mice: the role of tumor necrosis factor. Hepatology. 1995;21:190–198. doi: 10.1016/0270-9139(95)90428-x. [DOI] [PubMed] [Google Scholar]
- 27.Werlen G., Jacinto E., Xia Y., Karin M. Calcineurin preferentially synergizes with PKC-theta to activate JNK and IL-2 promoter in T lymphocytes. EMBO J. 1998;17:3101–3111. doi: 10.1093/emboj/17.11.3101. [DOI] [PMC free article] [PubMed] [Google Scholar]
- 28.Smith-Garvin J.E., Koretzky G.A., Jordan M.S. T cell activation. Annu. Rev. Immunol. 2009;27:591–619. doi: 10.1146/annurev.immunol.021908.132706. [DOI] [PMC free article] [PubMed] [Google Scholar]
- 29.Leo A., Wienands J., Baier G., Horejsi V., Schraven B. Adapters in lymphocyte signaling. J. Clin. Invest. 2002;109:301–309. doi: 10.1172/JCI14942. [DOI] [PMC free article] [PubMed] [Google Scholar]
- 30.Hobbs J.A., Cho S., Roberts T.J., Sriram V., Zhang J., Xu M., Brutkiewicz R.R. Selective loss of natural killer T cells by apoptosis following infection with lymphocytic choriomeningitis virus. J. Virol. 2001;75:10746–10754. doi: 10.1128/JVI.75.22.10746-10754.2001. [DOI] [PMC free article] [PubMed] [Google Scholar]
- 31.Wilson M.T., Johansson C., Olivares-Villagomez D., Singh A.K., Stanic A.K., Wang C.R., Joyce S., Wick M.J., Van Kaer L. The response of natural killer T cells to glycolipid antigens is characterized by surface receptor down-modulation and expansion. Proc. Natl. Acad. Sci. U.S.A. 2003;100:10913–10918. doi: 10.1073/pnas.1833166100. [DOI] [PMC free article] [PubMed] [Google Scholar]
- 32.Zhang L., Zhao Y. The regulation of Foxp3 expression in regulatory CD4(+)CD25(+)T cells: multiple pathways on the road. J. Cell. Physiol. 2007;211:590–597. doi: 10.1002/jcp.21001. [DOI] [PubMed] [Google Scholar]
- 33.Okeke E.B., Okwor I., Mou Z., Jia P., Uzonna J.E. CD4+CD25+ regulatory T cells attenuate lipopolysaccharide-induced systemic inflammatory responses and promotes survival in murine Escherichia coli infection. Shock. 2013;40:65–73. doi: 10.1097/SHK.0b013e318296e65b. [DOI] [PubMed] [Google Scholar]
- 34.Fontenot J.D., Gavin M.A., Rudensky A.Y. Foxp3 programs the development and function of CD4+CD25+ regulatory T cells. Nat. Immunol. 2003;4:330–336. doi: 10.1038/ni904. [DOI] [PubMed] [Google Scholar]
- 35.Sakaguchi S., Ono M., Setoguchi R., Yagi H., Hori S., Fehervari Z., Shimizu J., Takahashi T., Nomura T. Foxp3+ CD25+ CD4+ natural regulatory T cells in dominant self-tolerance and autoimmune disease. Immunol. Rev. 2006;212:8–27. doi: 10.1111/j.0105-2896.2006.00427.x. [DOI] [PubMed] [Google Scholar]
- 36.Kim J.M., Rudensky A. The role of the transcription factor Foxp3 in the development of regulatory T cells. Immunol. Rev. 2006;212:86–98. doi: 10.1111/j.0105-2896.2006.00426.x. [DOI] [PubMed] [Google Scholar]
- 37.Akiyama T., Maeda S., Yamane S., Ogino K., Kasai M., Kajiura F., Matsumoto M., Inoue J. Dependence of self-tolerance on TRAF6-directed development of thymic stroma. Science. 2005;308:248–251. doi: 10.1126/science.1105677. [DOI] [PubMed] [Google Scholar]
- 38.Kajiura F., Sun S., Nomura T., Izumi K., Ueno T., Bando Y., Kuroda N., Han H., Li Y., Matsushima A., Takahama Y., Sakaguchi S., Mitani T., Matsumoto M. NF-kappa B-inducing kinase establishes self-tolerance in a thymic stroma-dependent manner. J. Immunol. 2004;172:2067–2075. doi: 10.4049/jimmunol.172.4.2067. [DOI] [PubMed] [Google Scholar]
- 39.Wei J., Wei C., Wang M., Qiu X., Li Y., Yuan Y., Jin C., Leng L., Wang J., Yang X., He F. The GTPase-activating protein GIT2 protects against colitis by negatively regulating Toll-like receptor signaling. Proc. Natl. Acad. Sci. U.S.A. 2014;111:8883–8888. doi: 10.1073/pnas.1309218111. [DOI] [PMC free article] [PubMed] [Google Scholar]
- 40.Kong K.F., Fu G., Zhang Y., Yokosuka T., Casas J., Canonigo-Balancio A.J., Becart S., Kim G., Yates J.R., 3rd, Kronenberg M., Saito T., Gascoigne N.R., Altman A. Protein kinase C-eta controls CTLA-4-mediated regulatory T cell function. Nat. Immunol. 2014;15:465–472. doi: 10.1038/ni.2866. [DOI] [PMC free article] [PubMed] [Google Scholar]
- 41.Ong C.C., Jubb A.M., Zhou W., Haverty P.M., Harris A.L., Belvin M., Friedman L.S., Koeppen H., Hoeflich K.P. P21-activated kinase 1: PAK’ed with potential. Oncotarget. 2011;2:491–496. doi: 10.18632/oncotarget.271. [DOI] [PMC free article] [PubMed] [Google Scholar]
- 42.Suda Y., Aizawa S., Hirai S., Inoue T., Furuta Y., Suzuki M., Hirohashi S., Ikawa Y. Driven by the same Ig enhancer and SV40 T promoter ras induced lung adenomatous tumors, myc induced pre-B cell lymphomas and SV40 large T gene a variety of tumors in transgenic mice. EMBO J. 1987;6:4055–4065. doi: 10.1002/j.1460-2075.1987.tb02751.x. [DOI] [PMC free article] [PubMed] [Google Scholar]
- 43.Yu M., Wang J., Li W., Yuan Y.Z., Li C.Y., Qian X.H., Xu W.X., Zhan Y.Q., Yang X.M. Proteomic screen defines the hepatocyte nuclear factor 1alpha-binding partners and identifies HMGB1 as a new cofactor of HNF1alpha. Nucleic Acids Res. 2008;36:1209–1219. doi: 10.1093/nar/gkm1131. [DOI] [PMC free article] [PubMed] [Google Scholar]
- 44.McKarns S.C., Schwartz R.H. Distinct effects of TGF-beta 1 on CD4+ and CD8+ T cell survival, division, and IL-2 production: a role for T cell intrinsic Smad3. J. Immunol. 2005;174:2071–2083. doi: 10.4049/jimmunol.174.4.2071. [DOI] [PubMed] [Google Scholar]