

Abstract
Spreading depolarizations (SDs) are waves of sustained neuronal and glial depolarization that propagate massive disruptions of ion gradients through the brain. SD is associated with migraine aura and recently recognized as a novel mechanism of injury in stroke and brain trauma patients. SD leads to neuronal swelling as assessed in real time with two-photon laser scanning microscopy (2PLSM). Pyramidal neurons do not express aquaporins and thus display low inherent water permeability, yet SD rapidly induces focal swelling (beading) along the dendritic shaft by unidentified molecular mechanisms. To address this issue, we induced SD in murine hippocampal slices by focal KCl microinjection and visualized the ensuing beading of dendrites expressing EGFP by 2PLSM. We confirmed that dendritic beading failed to arise during large (100 mOsm) hyposmotic challenges, underscoring that neuronal swelling does not occur as a simple osmotic event. SD-induced dendritic beading was not prevented by pharmacological interference with the cytoskeleton, supporting the notion that dendritic beading may result entirely from excessive water influx. Dendritic beading was strictly dependent on the presence of Cl−, and, accordingly, combined blockade of Cl−-coupled transporters led to a significant reduction in dendritic beading without interfering with SD. Furthermore, our in vivo data showed a strong inhibition of dendritic beading during pharmacological blockage of these cotransporters. We propose that SD-induced dendritic beading takes place as a consequence of the altered driving forces and thus activity for these cotransporters, which by transport of water during their translocation mechanism may generate dendritic beading independently of osmotic forces.
SIGNIFICANCE STATEMENT Spreading depolarization occurs during pathological conditions such as stroke, brain injury, and migraine and is characterized as a wave of massive ion translocation between intracellular and extracellular space in association with recurrent transient focal swelling (beading) of dendrites. Numerous ion channels have been demonstrated to be involved in generation and propagation of spreading depolarization, but the molecular machinery responsible for the dendritic beading has remained elusive. Using real-time in vitro and in vivo two-photon laser scanning microscopy, we have identified the transport mechanisms involved in the detrimental focal swelling of dendrites. These findings have clear clinical significance because they may point to a new class of pharmacological targets for prevention of neuronal swelling that consequently will serve as neuroprotective agents.
Keywords: Cl-cotransporters, cotransporters, dendritic beading, neuronal swelling, spreading depression, two-photon microscopy
Introduction
Spreading depolarization (SD) is a fundamental pathological event in the brain that occurs as a wave of neuronal and glial depolarization invading the cortex at a rate of 2–6 mm/min (Leao, 1944; Dreier, 2011). The extracellular negative slow potential change between −5 and −30 mV serves as a robust measure of SD because it directly reflects the depolarization of a large population of cortical neurons (Canals et al., 2005). The full spectrum from short-lasting to very long-lasting SD waves has been observed in association with cerebral pathologies, such as migraine aura, stroke, and traumatic brain injury, not only in experimental animals but also in patients (Hadjikhani et al., 2001; Oliveira-Ferreira et al., 2010; Hartings et al., 2011a; Dreier and Reiffurth, 2015). Moreover, multiple or prolonged SDs may instigate secondary neuronal damage in patients experiencing acute cerebral injuries (Dreier et al., 2006; Hartings et al., 2011b; Lauritzen et al., 2011).
Ionic changes between the extracellular and intracellular compartments during SD are massive, with a sharp increase of [K+]o and a severe drop of [Na+]o, [Ca2+]o, [Cl−]o, and pHo (Kraig and Nicholson, 1978; Hansen and Zeuthen, 1981; Mutch and Hansen, 1984; Menna et al., 2000; Windmüller et al., 2005). During SD, the interstitial space shrinks dramatically (Pérez-Pinzón et al., 1995; Mazel et al., 2002), reflecting abrupt cytotoxic edema manifested by profound neuronal swelling and dendritic beading with spine loss (Takano et al., 2007; Murphy et al., 2008; Risher et al., 2012) and attendant synaptic failure and neuronal damage (Somjen, 2001; Douglas et al., 2011; Chen et al., 2012). It appears that the transient or terminal nature of SD-induced dendritic beading depends on the metabolic status of the tissue invaded by this SD (Li and Murphy, 2008; Risher et al., 2010; Sword et al., 2013). Dendritic preservation is required for successful neuroprotection strategies (Iyirhiaro et al., 2008), and uncoupling of dendritic beading from SD should thus protect dendrites from terminal injury.
However, the molecular mechanisms generating the focal volume increase underlying SD-induced dendritic beading have remained elusive. Simple osmotically obliged water entry during SD is unlikely to cause beading because membranes of pyramidal neurons display low intrinsic osmotic water permeability caused by lack of expression of membrane-bound aquaporins (Andrew et al., 2007; Papadopoulos and Verkman, 2013). Therefore, we hypothesized that dendritic beading, at least in part, occurs secondary to the large SD-induced changes in ion and lactate concentrations. A range of cotransport proteins carry the inherent ability to cotransport water along their translocation mechanism in a manner independent of transmembrane osmotic forces (for review, see MacAulay and Zeuthen, 2010). Consequently, we propose that SD-induced alterations in transmembrane ion and lactate concentrations activate select cotransporters that then act as the molecular mechanisms responsible for dendritic bead formation. Here using two-photon laser scanning microscopy (2PLSM) imaging in hippocampal slices and in vivo, we search for evidence that Cl−-coupled and lactate transporters participate in SD-induced dendritic beading.
Materials and Methods
Brain slice preparation and solutions.
All procedures followed National Institutes of Health guidelines for the humane care and use of laboratory animals and underwent yearly review by the Animal Care and Use Committee at the Medical College of Georgia, Georgia Regents University. Brain slices (400 μm) were made from 35 male and female adult mice (45–70 d old) according to standard protocols (Kirov et al., 2004). We used 32 heterozygous mice of B6.Cg–Tg(Thy1–EGFP)MJrs [GFP-M] strain, two heterozygous mice of B6.129P–Cx3cr1tm1Litt/J [CX3CR1–EGFP] strain, and one wild-type mouse. Founders of the GFP-M colony were kindly provided by Dr. J. Sanes (Harvard University, Boston, MA). This strain of mice expresses the enhanced green fluorescent protein (EGFP) in sparse subsets of neocortical and hippocampal pyramidal neurons (Feng et al., 2000). The founding mice of the CX3CR1–EGFP colony were purchased from The Jackson Laboratory. These mice express EGFP in microglia under control of the endogenous Cx3cr1 locus encoding the chemokine (C-X3-C) receptor 1 (CX3CR1; also known as fractalkine receptor; Jung et al., 2000). Mice were anesthetized deeply with halothane (2-bromo-2-chloro-1,1,1-trifluoroethane) and decapitated. The brain was quickly removed and placed in cold, oxygenated (95% O2/5% CO2) sucrose-based artificial CSF (aCSF; in mm: 1 NaH2PO4, 25 NaHCO3, 10 glucose, 210 sucrose, 2.5 KCl, and 8 MgSO4, pH 7.4). Transverse slices, including hippocampus, subiculum, and neocortex, were cut with a vibrating-blade microtome (VT1000S; Leica) and submerged in oxygenated standard aCSF (in mm: 1 NaH2PO4, 25 NaHCO3, 10 glucose, 120 NaCl, 2.5 KCl, 1.3 MgSO4, and 2.5 CaCl2, pH 7.4) to recover at room temperature for a minimum of 1 h before recordings. For the hyposmolar experiments, 50 mm NaCl was replaced with mannitol in the isosmolar mannitol-containing aCSF (in mm: 1 NaH2PO4, 25 NaHCO3, 10 glucose, 100 mannitol, 70 NaCl, 2.5 KCl, 1.3 MgSO4, and 2.5 CaCl2, pH 7.4). The hyposmolar aCSF was created by removal of the mannitol to obtain a “pure” osmotic challenge while avoiding alterations in ionic strength during the actual hyposmotic challenge and thus shifts in driving forces for the Na+ and Cl−-driven transporters. The aCSF with a low-Cl− concentration contained the following (in mm): 1 NaH2PO4, 25 NaHCO3, 10 glucose, 120 NaCH3SO4, 2.5 KCH3SO4, 1.2 MgSO4, and 1.2 CaCl2, pH 7.4.
In vitro imaging and electrophysiological recording.
A slice was placed into a submersion-type imaging/recording chamber (RC-29; 629 μl working volume; Warner Instruments) mounted on the Luigs & Neumann microscope stage. The slice was held down by an anchor (SHD-27LP/2; Warner Instruments) and superfused with oxygenated aCSF at 30–32°C, using a recirculating system with a flow rate of 7–8 ml/min controlled by two peristaltic pumps (Watson-Marlow). Temperature was monitored by a thermistor probe within 1 mm of the slice and maintained by an in-line solution heater/cooler (CL-100; Warner Instruments) with a bipolar temperature controller (TA-29; Warner Instruments). Images of apical dendrites of hippocampal CA1 pyramidal neurons were acquired in the area of the stratum radiatum localized between the recording microelectrode and the injection micropipette at a depth of ≥80 μm from the cut slice surface in which there was no trace of injured dendrites (Kirov et al., 1999; Davies et al., 2007). The field EPSPs (fEPSPs) were evoked by a concentric bipolar stimulating electrode (25 μm pole separation; FHC) placed in the middle of the stratum radiatum, and recorded with a glass microelectrode (filled with 0.9% NaCl, 1–2 MΩ). Evoked fEPSPs in healthy slices had a sigmoidal input/output response function and a stable response at half-maximal stimulation. The stimulating electrode was subsequently removed, and the first SD was induced by pressure injection of ∼1.5 nl of 1 m KCl (25 psi, 100 ms) using a Picospritzer (Parker Hannifin; Aiba et al., 2012) with an injection micropipette (1–2 MΩ) positioned ∼ 400 μm downstream of aCSF flow from the recording electrode. This experimental design was intended to prevent significant spread of the focally administered KCl into the imaging area. The extracellular negative direct current (DC) potential shift indicated SD. To obtain consecutive SDs, three near-instantaneous KCl injections were used to generate the second and third SD, with a 20 min recovery period between each SD. In low-Cl− aCSF, six instantaneous KCl injections were required to evoke SD. Signals were recorded with a MultiClamp 200B amplifier (Molecular Devices). fEPSPs were filtered at 2 kHz and DC potential at 400 Hz, sampled at 10 kHz with a Digidata 1322A interface board, and analyzed with pClamp 10 software (Molecular Devices).
Preparation of mice for in vivo imaging and electrophysiology.
Craniotomy for the optical window followed standard protocols (Risher et al., 2010). Ten heterozygous GFP-M male and female adult mice (56–70 d old) were used for in vivo experiments. Mice were anesthetized with an intraperitoneal injection of urethane (1.5 mg/g body weight). During surgery, body temperature was maintained at 37°C with a heating pad (Sunbeam). The trachea was cannulated, and mice were ventilated mechanically with an SAR-830 ventilator (CWE) throughout the experiment. Blood oxygen saturation level (>90%) and heart rate (450–650 beats/min) were monitored continuously with a MouseOx pulse oximeter (STARR Life Sciences). The skin covering the cranium above the somatosensory cortex was removed. A custom-made 1.3-cm-diameter plastic ring was glued with dental acrylic cement (Co-Oral-Ite Dental) to stabilize the head during the craniotomy and imaging using a mouse head holder attached to a base plate. A dental drill (Midwest Stylus Mini 540S; DENTSPLY International) with 0.5 mm round bit was used to thin the circumference of a 2- to 4-mm-diameter circular region of the skull over the somatosensory cortex (centered at stereotaxic coordinates −1.8 mm from bregma and 2.8 mm lateral). The thinned bone was lifted up with forceps. An optical chamber was constructed by covering the intact dura with a cortex aCSF containing the following (in mm): 135 NaCl, 5.4 KCl, 1 MgCl2, 1.8 CaCl2, and 10 HEPES, pH 7.3. The chamber was left open to facilitate access with a glass microelectrode and a KCl-injection micropipette for SD induction. After installation of the Ag/AgCl pellet reference electrode (A-M Systems) under the skin above the nasal bone, the base plate containing the head holder with the mouse resting on a heating blanket was affixed to the Luigs & Neumann microscope stage for imaging. Rectal temperature was monitored continuously with an IT-18 thermocouple (AD Instruments) and a Fluke 51 thermometer, and maintained at 37°C with a heating blanket (Harvard Apparatus). Hydration was maintained by intraperitoneal injection of 100 μl of 0.9% NaCl with 20 mm glucose at 1 h intervals. Depth of anesthesia was assessed by toe pinch and heart rate monitoring, maintained with 10% of the initial urethane dose if necessary. A 0.1 ml bolus of 5% (w/v) Texas Red Dextran (70 kDa) in 0.9% NaCl was injected into the tail vein for blood flow visualization. The cortical slow DC potential was recorded with a glass microelectrode (filled with 0.9% NaCl, 1–2 MΩ) inserted through the dura to the site of imaged dendrites within layer I of the somatosensory cortex. SDs were induced by focal pressure injection of <5 nl of 1 m KCl with a Picospritzer (Parker Hannifin) using a micropipette inserted through the dura to the depth of 200–300 μm within 2 mm away from the site of imaged dendrites. Signals were recorded with a MultiClamp 200B amplifier, filtered at 1 kHz, digitized at 10 kHz with a Digidata 1322A interface board, and analyzed with pClamp 10 (Molecular Devices).
2PLSM.
Images were collected with infrared-optimized 40×/0.8 numerical aperture (NA) water-immersion objective (Carl Zeiss) using the Zeiss LSM 510 NLO META multiphoton system mounted on the motorized upright Axioscope 2FS microscope. The scan module was coupled directly with a titanium:sapphire broadband, mode-locked laser (Mai-Tai; Spectra-Physics) tuned to 910 nm for two-photon excitation. Emitted light was detected by internal photomultiplier tubes of the scan module with the pinhole entirely opened. Three-dimensional (3D) time-lapse images were taken at 1 μm increments using a 3× optical zoom, yielding a nominal spatial resolution of 6.8 pixels/μm (12 bits/pixel, 0.9 μs pixel time) across a 75 × 75 μm imaging field. To monitor structural changes, image stacks consisting of 18–20 sections were acquired every 30 s after SD during the first 3 min or until full recovery of beading was observed. Each section takes ∼1 s to acquire, and therefore the time point “10 s” refers to the middle time point of imaging of a new stack, which takes ∼18–20 s to acquire. When experimental conditions caused a shift in the focal plane, it was adjusted and re-centered before subsequent data acquisition (Risher et al., 2009, 2010).
Laser speckle imaging.
Two-dimensional (2D) maps of cerebral blood flow with high spatiotemporal resolution were acquired by laser speckle imaging as described previously (Dunn et al., 2001; Sigler et al., 2008; Risher et al., 2010). Briefly, the cortical surface was illuminated through an anamorphic beam expander (Edmund Optics) by a 785 nm StockerYale laser (ProPhotonix) at an angle of ∼30° and imaged with a 4×/0.075 NA objective (Zeiss). Real-time speckle imaging was used with custom-written LabView software (National Instruments) (Yang et al., 2011) and modified for use with the Dalsa Pantera 1M60 camera (Dalsa) using the XCLIB DLL library (EPIX). The software processes ∼10 fps at an exposure time of 20 ms in our setup using the NVIDIA Quadro FX 1700 graphics card CUDA (NVIDIA) on the graphics processing unit. Laser speckle contrast was obtained by dividing the SD image by the mean of each raw image with a 5 × 5 pixel sliding window for immediate display (Yang et al., 2011). Fifty frames were saved individually as 32 bit images in LabView and averaged offline using NIH ImageJ to obtain a single image for figures.
Image analysis from 2PLSM.
Images were examined and analyzed with NIH ImageJ. The Scientific Volume Imaging Huygens Professional image deconvolution software was used to process images before analyses. All in vivo experiments and the experiments involving cytoskeletal rearrangements were quantified by an investigator blind to the experimental conditions. All other 2PLSM data were not coded for analyses. The formation of focal swelling or beading along the dendritic shaft was identified by rounded regions extending beyond the initial diameter of the dendrite separated from each other by thin dendritic segments (“beads-on-a-string” appearance). The recovery was defined as the disappearance of rounded “beaded” regions. The amount of dendritic beading in an imaging field was quantified as reported previously (Murphy et al., 2008; Sword et al., 2013). Briefly, 2D maximum intensity projections (MIPs) of 3D image stacks were aligned between different time points before and during SD. To quantify the extent of dendritic beading, each MIP image was divided into 6 × 6 squares (12.5 × 12.5 μm), and only the squares containing dendrites were counted and the percentage of squares containing beaded dendrites was calculated. Individual sections through 3D stacks were also examined and compared with pre-SD images to distinguish dendritic beads from sphere-shaped axonal boutons and dendrites imaged in cross-section.
To measure relative changes in the size of dendritic beads between experimental conditions, we used 2D MIPs of 3D image stacks to manually trace the cross-sectional area of individual dendritic beads. Analysis of changes in the lateral dimensions simplified the interpretation of morphometric data imposed by the low axial resolution of 2PLSM (∼2 μm) compared with the lateral resolution (∼0.4 μm). Such morphometric analysis was adequate to determine relative volume changes, which underestimated the actual volume changes assuming they are approximately isotropic.
Electron microscopy and image analysis.
Slices were fixed rapidly during 8 s of microwave irradiation in mixed aldehydes (2% glutaraldehyde, 4% paraformaldehyde in 0.1 m cacodylate buffer, pH 7.4, and containing 2 mm CaCl2 and 4 mm MgCl2) and stored overnight in fixative at room temperature (Jensen and Harris, 1989). A small piece of tissue containing the CA1 region of the hippocampus was microdissected from the slice and subsequently processed with standard microwave-enhanced procedures through osmium, uranyl acetate, dehydration with a graded ethanol series, and embedding in Epon–Araldite resin (Kirov et al., 1999). Thin sections from the middle of the stratum radiatum at an optimal depth of 150–200 μm beneath the slice surface were cut with a diamond knife on a Leica EM UC6 ultramicrotome (Leica), collected on pioloform-coated copper Synaptek slot grids (Electron Microscopy Sciences), and stained with uranyl acetate and lead citrate. These protocols produced well stained and readily identifiable neuronal processes (see Fig. 2G). Five fields were photographed in each slice (total 25 fields) at the JEOL 1230 transmission electron microscope (JEOL). Images were captured digitally at a magnification of 3000× using the Gatan UltraScan 4000 camera (Gatan). The images were randomized, coded, and analyzed blind as to condition. Each image provided ∼225 μm2 (1125 μm2 in total per condition) to evaluate microtubule disassembly. Each dendritic profile was scored as having microtubules present or completely devoid of them.
Figure 2.
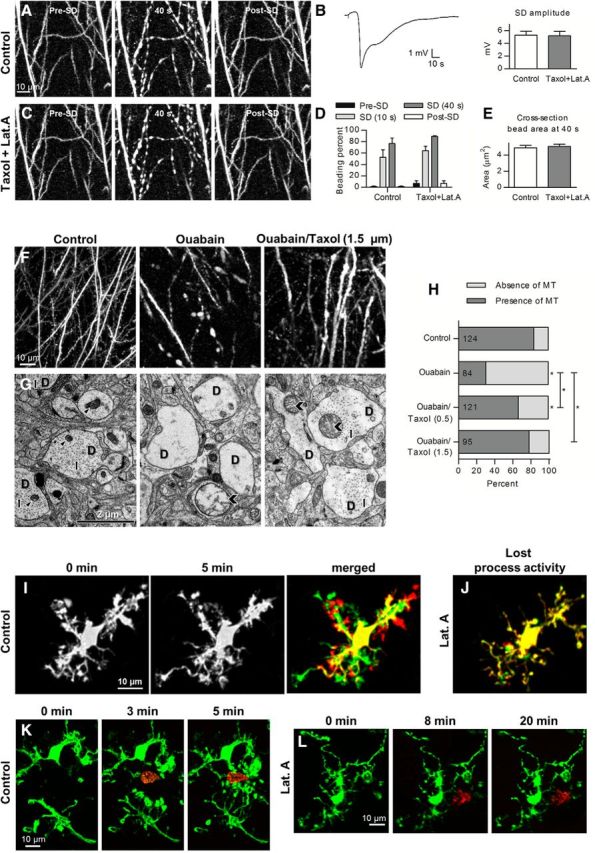
SD-induced beading was not prevented by pharmacological interference with dendritic cytoskeleton. A, 2PLSM MIP control images of dendrites showing rapid beading and recovery during the passage of normoxic KCl-induced SD. B, Representative DC potential recording and quantified amplitude before and after 45 min pretreatment with 1.5 μm Taxol and 1.5 μm Latrunculin A (Lat.A; n = 5 slices, paired t test). C, 2PLSM MIP image sequence of the same dendrites reveals transient beading during the passage of SD induced after pretreatment with Taxol and Latrunculin A. D, SD-induced dendritic beading in control aCSF is similar to the beading after pretreatment with Taxol and Latrunculin A (n = 5 slices, two-way RM-ANOVA and Sidak's post hoc test), post-SD quantified at 250 s. E, At 40 s after SD onset, the size of beads measured at the same dendritic location was not affected by pretreatment with Taxol and Latrunculin A (n = 60 beads in 5 slices, paired t test). F, 2PLSM MIP images of dendrites in control and after onset of terminal long-lasting SD evoked by 100 μm ouabain. Dendrites become beaded precisely coinciding with the passage of ouabain-induced SD elicited in standard aCSF (middle) or aCSF containing 1.5 μm Taxol (right). G, Corresponding ultrastructural components of dendritic structure from the slices shown in F. EM images of neuropil in the CA1 region of the stratum radiatum were acquired in the middle of the slice ∼200 μm below the cut surface. Morphologically healthy neuropil in control slices (left) had dendrites (D) with intact cytoplasm, microtubules (arrows), and non-swollen mitochondria (arrowheads). Disrupted neuropil after ouabain-induced SD (middle) had swollen dendrites (D) devoid of microtubules in their watery cytoplasm that contained severely swollen mitochondria (chevron). Dendrites (D) and mitochondria (chevrons) were swollen after the passage of ouabain-induced SD in aCSF containing 1.5 μm Taxol (right), but microtubule arrays (arrows) remained intact. H, Percentage of dendritic profiles containing microtubules (MT) in control conditions and after passage of ouabain-induced SD triggered in standard aCSF or aCSF containing either 0.5 or 1.5 μm Taxol. The number of dendritic profiles that were analyzed in each condition is indicated within each bar. Asterisks above bars indicate significant difference from control condition (χ2 test). Asterisks above braces indicate significant difference between SD-triggered microtubule loss in standard aCSF and aCSF containing 0.5 and 1.5 μm Taxol (χ2 test). *p < 0.01. I, Activated microglia morphology and dynamics near the cut slice surface. MIPs of image stacks acquired during time-lapse recording at the beginning (left) and 5 min later (middle) are overlaid in the right. Overlay image shows abundant extension (green) and retraction (red) of microglial processes. J, Overlay showing the merged images of microglia captured at 10 and 15 min after 0.5 μm Latrunculin A application reveals lost process activity. K, Image sequence showing extension of microglia processes (green) toward laser lesion (red) indicated by an autofluorescence of lipofuscin produced by peroxidation of lipids during membrane breakdown (Hines et al., 2009). Left (0 min) is control image just before laser lesion. The middle and right show processes outgrowth toward the lesion at 3 and 5 min after injury. L, Extension of microglia processes in the same slice shown in K was blocked by 0.5 μm Latrunculin A treatment. Left is control image of microglia acquired at 14 min of Latrunculin A application, with the middle and right showing lack of processes outgrowth to the lesion site after 8 and 20 min of laser ablation, respectively.
Chemicals.
Latrunculin A and Texas Red Dextran were from Invitrogen, and Taxol was from Tocris Bioscience. All other drugs and chemicals were from Sigma. Furosemide (final concentration of 1 mm), 4-hydroxycinnamate (4-CIN; final concentration of 0.5 mm), and ouabain (final concentration of 100 μm) were dissolved directly into the aCSF. 4,4′-Diisothiocyanatostilbene-2,2′-disulphonic acid (DIDS; 15 mg) was dispersed in 300 μl of water and then solubilized at 300 μm in aCSF. Taxol (final concentration of 1.5 μm) and Latrunculin A (final concentration of 1.5 μm) were dissolved in DMSO to a stock solution of 500 μm each. aCSF solutions and drug mixtures were made fresh each day. Solutions containing Latrunculin A and Taxol were made immediately before their experimental application. All solutions and drugs were applied to the slices for 15 min (osmotic solutions, low-Cl− aCSF, a mixture of furosemide, DIDS, and 4-CIN) or for 45 min (Taxol/Latrunculin A, furosemide, DIDS, or 4-CIN). The mixture of furosemide, DIDS, and 4-CIN in the cortex aCSF was applied directly to the cortex with dura intact for ∼120 min.
Statistics.
Statistica (StatSoft), SigmaStat (Systat), or GraphPrism 6.0 (GraphPad Software) was used to evaluate significant differences between conditions. Unpaired and paired Student's t tests, Wilcoxon's signed-rank test, and one-way and two-way repeated-measures (RM) ANOVA, followed by the Tukey's or Sidak's multiple comparison post hoc tests were used when applicable. The χ2 test was used to analyze data arranged in contingency tables. Data are presented as mean ± SEM, and the significance criterion was set at p < 0.05. For clarity of small panel figures, one asterisk signifies all significance levels, whereas the exact significance level is stated in Results.
Results
Generation of SD and dendritic beading in brain slices
Live brain slices allow real-time imaging of fully arborized neurons deep under the cut surface in which the native tissue architecture and cellular milieu is preserved. Anoxic or terminal SD, similar to an SD wave ignited in vivo in the severely energy-deprived ischemic core, can be initiated in slices during simulated global ischemia induced by oxygen/glucose deprivation (OGD) or by exposure to ouabain, which, like OGD, inhibits the Na+/K+-ATPase (Balestrino et al., 1999; Anderson et al., 2005). Initially, we induced SD by ouabain application (100 μm; for a representative SD recording, see Fig. 1A). Apical dendrites of hippocampal CA1 pyramidal neurons were imaged first in control aCSF and then during ouabain-induced SD (Fig. 1B). Dendritic beading occurred at the onset of SD, with the fraction of beaded dendrites increasing to 98.9 ± 1.1% at 310 s after SD initiation (n = 6 slices from 4 mice, p < 0.001; Fig. 1C, black symbols). As expected from previous studies, there was no recovery of dendritic beading during a wash in control aCSF (data not shown; Douglas et al., 2011). Because in normal healthy cortex and in moderately metabolically stressed ischemic penumbra SD-induced dendritic beading is transient (Takano et al., 2007; Risher et al., 2010), it was desirable to find experimental conditions that would allow the repeated trigger of transient SD-induced dendritic beading in the same slice. Normoxic SD can be evoked repetitively in slices by briefly elevating [K+]o in the aCSF superfusate (Anderson and Andrew, 2002; Zhou et al., 2010) or by focal pressure injection of small quantities of 1 m KCl (Aiba et al., 2012). However, it was unknown whether transient dendritic beading could be triggered repetitively in the same slice by subsequent normoxic SDs. Focal pressure injection of KCl reliably triggered SD, and dendrites underwent a rapid cycle of beading and recovery that coincided with the passage of SD (Fig. 1D). Beading was maximal at 40 s after the start of SD, with the fraction of beaded dendrites reaching 91.6 ± 6.4% (n = 6 slices from 4 mice) with complete recovery obtained by 220 s (Fig. 1C, gray symbols). The three consecutive KCl pressure injections (20 min interval) yielded SDs of comparable amplitude (4.4 ± 0.7 mV for first SD, 4.2 ± 0.5 mV for second SD, and 3.8 ± 0.9 mV for third SD, n = 6 slices, p = 0.79; Fig. 1E). The time course of SD-induced beading was similar during these consecutive KCl applications, with a maximal fraction of beaded dendrites at 40 s (91.6 ± 6.4% for first SD, 96.2 ± 1.9% for second SD, and 96.2 ± 3.8% for third SD, n = 6 slices, p = 0.95) and a complete recovery at 220 s after SD start (Fig. 1F). The size of dendritic beads at 40 s was also similar between the three consecutive depolarizations, with the cross-sectional area of individual dendritic beads reaching 4.4 ± 0.2, 4.7 ± 0.2, and 5.0 ± 0.3 μm2, respectively (n = 34 beads in 6 slices, p = 0.06; Fig. 1G). Thus, we established that transient dendritic beading can be triggered reliably in slices by subsequent rounds of focal KCl microinjections without accumulating dendritic injury. Therefore, we used this experimental approach to determine molecular mechanisms underlying dendritic beading.
Figure 1.

SD-induced dendritic beading in hippocampal slices. A, Representative DC potential recording at the imaging site during exposure to ouabain-containing aCSF. The negative deflection in the DC trace represents the SD. B, 2PLSM MIP images of apical dendrites of CA1 pyramidal neurons in the stratum radiatum before and 40 s after onset of terminal long-lasting SD evoked by exposure to 100 μm ouabain. C, The fraction of beaded dendrites during SD evoked either by chemical ischemia with ouabain (black symbols, n = 6 slices) or by KCl microinjection (gray symbols, n = 6 slices) in normoxic hippocampus. Values are based on manually scored beading percentages in imaging fields using a 6 × 6 grid (Sword et al., 2013). Asterisks indicate significant difference from the time point before SD (one-way RM-ANOVA with Tukey's post hoc test); *p < 0.001. D, 2PLSM MIP image sequence reveals transient dendritic beading during a passage of normoxic KCl-induced SD. Images were taken shortly before (Pre-SD), during initiation (10 s), and 40 and 250 s after onset of the short-lasting SD shown in the middle. Arrows specify time points on the recording when corresponding image stacks were taken, with braces indicating acquisition duration of each stack. The DC potential fully recovered to the baseline as neurons repolarized. E, Quantified amplitudes of three consecutive KCl-induced SDs (n = 6 slices, one-way RM-ANOVA with Tukey's post hoc test). F, Summary from three consecutive SDs showing that dendrites undergo similar beading and recovery during each round of SD (n = 6 slices, two-way RM-ANOVA with Tukey's post hoc test). G, Summary from 34 beads in six slices showing identical increase in bead cross-section area at the same dendritic location as measured at 40 s after onset of each of three consecutive SDs (one-way RM-ANOVA with Tukey's post hoc test).
Cytoskeletal rearrangement is not required for dendritic beading
Even during normoxic SD, the energy demand of the Na+/K+-ATPase increases so markedly (LaManna and Rosenthal, 1975) that the ATP concentration falls to ∼50% (Mies and Paschen, 1984). Such sharp reduction in ATP might trigger unregulated polymerization of monomeric globular actin to polymeric filamentous actin (Atkinson et al., 2004) and may thus contribute to beading (Gisselsson et al., 2005). In addition, dendritic [Ca2+] rises into the micromolar range during the course of SD (Dietz et al., 2008), which may interfere with microtubule stability. Therefore, to elucidate the role of cytoskeletal rearrangement in SD-induced dendritic beading, we stabilized microtubules with Taxol (Bird, 1984) and inhibited actin polymerization with Latrunculin A (Spector et al., 1983). First, SD was induced by focal KCl microinjection, and control dendritic beading was observed with 2PLSM (Fig. 2A). The slice subsequently recovered before exposure to aCSF containing 1.5 μm Taxol and 1.5 μm Latrunculin A. Then a second SD of similar amplitude was triggered with KCl (5.3 ± 0.6 vs 5.2 ± 0.7 mV, n = 5 slices from 5 mice, p = 0.80; Fig. 2B). Dendritic beading readily occurred in the presence of Taxol and Latrunculin A (Fig. 2C). There was no difference in the amount of SD-induced beading between control aCSF and aCSF containing toxins (76.7 ± 9.8 vs 89.6 ± 1.0% at 40 s, n = 5 slices, p = 0.17; Fig. 2D). Likewise, the size of dendritic beads at 40 s after SD initiation in control aCSF was not affected by pretreatment with Taxol and Latrunculin A (4.9 ± 0.3 vs 5.1 ± 0.3 μm2, n = 60 beads in 5 slices, p = 0.19; Fig. 2E). These findings suggest that cytoskeletal rearrangements do not underlie formation of SD-induced dendritic beading.
To ensure that microtubules were stabilized and actin polymerization was indeed sufficiently abolished under our experimental conditions, we designed positive control experiments to independently verify the drug actions. Apparently, dendritic microtubules disassemble when intracellular [Ca2+] increases to the micromolar range (Schliwa et al., 1981), and several ultrastructural studies have revealed disintegration of microtubules inside swollen dendrites immediately after ischemia (Yamamoto et al., 1986, 1990). Therefore, we used chemical ischemia to verify whether Taxol could prevent microtubule fragmentation during ouabain-induced SD, which is by itself a much stronger noxious stimuli than KCl-induced SD. Slices were fixed rapidly during microwave irradiation in mixed aldehydes immediately after confirmation of dendritic integrity in control conditions or validation of dendritic beading by ouabain-induced SD in the absence or presence of 0.5 and 1.5 μm Taxol (Fig. 2F). The occurrence of microtubules in the cross-sectioned dendritic profiles was determined by EM (Fig. 2G), and the dendritic profiles were scored either as having microtubules or devoid of them (Fig. 2H). In control slices not exposed to SD, microtubules were clearly detectable in 84% of dendritic profiles, whereas in slices exposed to ouabain-induced SD only 31% of dendritic profiles contained microtubulus (p < 0.001; Fig. 2H). When SD was induced in the presence of 0.5 μm Taxol, 67% of cross-sectioned dendrites had microtubules. The number of dendrites with microtubules was significantly higher than in slices with ouabain-induced SD (p < 0.001), but this number was still significantly less than in the control condition (p < 0.01; Fig. 2H), indicating intermediate protection. However, quantification revealed a similar percentage of dendritic profiles with microtubules in the control and after ouabain-induced SD in the presence of 1.5 μm Taxol (84 vs 78%, respectively, p = 0.3; Fig. 2H), suggesting that, at this concentration, Taxol blocked microtubule fragmentation during ouabain-induced SD.
It has been reported that agents blocking actin polymerization were effective at inhibiting microglial process extension in slices (Hines et al., 2009). Therefore, we monitored activated microglia within 70 μm of the cut slice surface and confirmed that microglial processes were continuously undergoing cycles of extension and retraction (Fig. 2I) as shown in vivo (Nimmerjahn et al., 2005; Masuda et al., 2011). Bath application of Latrunculin A, even at a lower concentration (0.5 μm), reliably stopped microglia process activity (Fig. 2J; n = 2 slices from 2 mice). Next, we used two-photon excitation to create discrete circular microlesion and monitor outgrowth of microglia processes toward lesion as reported in previous studies in slices (Hines et al., 2009). The laser intensity was kept comparable between all experiments. After detection of robust microglia response to the injury (Fig. 2K), we superfused the same slice with aCSF containing 0.5 μm Latrunculin A and then created another microlesion away from the site of initial damage. Application of Latrunculin A for 14–66 min completely blocked process extension to the new lesion site (Fig. 2L; n = 5 slices from 2 mice). These observations indicate that Taxol and Latrunculin A exerted their inhibitory effect under our experimental conditions but failed to block SD-induced dendritic beading.
Dendritic beading does not occur as osmotically induced swelling
Dendritic beading is associated with increased dendritic volume (Hasbani et al., 1998) and therefore necessarily with a flux of water into the dendrites (Kirov et al., 2004; Andrew et al., 2007; also note the watery cytoplasm of swollen cross-sectioned dendrites after ouabain-induced SD shown in the middle and the right panels of Fig. 2G). During SD, the physiological transmembrane ion gradients are greatly altered. Thus, osmotic particles could potentially accumulate intracellularly and promote passive flux of water from the extracellular space into the dendrites. To mimic such an event, we introduced an extracellular hyposmotic challenge of 100 mOsm and monitored dendrites by 2PLSM (Fig. 3). The slice was initially kept in control aCSF (left panel, Control). To preserve the ionic strength of the aCSF and thus ionic driving forces during changes in aCSF osmolarity, the slice was then superfused with an isosmolar mannitol-containing aCSF (50 mm NaCl replaced with 100 mm mannitol; second panel, Isosmolar). When the slice was subsequently exposed to the aCSF in which the 100 mm mannitol was removed, the slice would encounter an abrupt 100 mOsm hyposmotic challenge with no simultaneous changes in ionic driving forces and/or membrane potential (third panel, −100 mOsm). After the hyposmotic challenge, the slice was reexposed to the isosmolar mannitol-containing aCSF (right panel, Isosmolar). During the first minutes of the hyposmotic stress, a slow shift in the focal plane of the optical sections was observed, revealing the expected slice swelling. However, there was no dendritic beading observed during the hyposmotic challenge, indicating that SD-induced dendritic beading does not occur as a simple osmotic event after the ionic movements during SD.
Figure 3.

Dendrites withstand severe hyposmotic challenge. Representative 2PLSM MIP image sequence showing dendritic structural stability during superfusion of slices with control aCSF, after 15 min of isosmolar mannitol-containing aCSF, after 15 min of exposure to hyposmotic aCSF (−100 mOsm), and then after 15 min of return of isosmolar aCSF (n = 4 slices from 2 mice).
Chloride is required for SD-induced dendritic beading
To determine the requirement of Cl− flux for dendritic beading, we triggered SD in slices superfused with a low-Cl− containing aCSF (2.4 mm Cl−). First, transient dendritic beading was observed in control aCSF during a passage of normoxic SD triggered by a focal KCl microinjection (Fig. 4A). Then, after recovery in control aCSF, the slice was exposed to a low-Cl− aCSF, followed by induction of the second SD, which was of similar amplitude to the control SD and SD evoked after subsequent reperfusion with the control aCSF (normalized to control, 0.8 ± 0.2 in low-Cl− aCSF and 1.2 ± 0.1 after wash, n = 5 slices from 2 mice, p = 0.08; Fig. 4D). Nevertheless, the amount of dendritic beading in the imaging field was decreased visibly (Fig. 4B). Indeed, quantification revealed significant reduction of beading in the low-Cl− aCSF in which the average beading percentage only reached ∼25% of beading in control aCSF at 40 s after start of SD (87.2 ± 3.8% in control vs 21.7 ± 3.0% in low-Cl− aCSF, n = 5 slices, p < 0.001; Fig. 4E). However, a small fraction of the dendrites persisted in beading despite the low extracellular Cl− concentration. Still, the size of the remaining beads in the low-Cl− aCSF was reduced significantly by 42.1 ± 3.3% at 40 s after SD start compared with the control (4.4 ± 0.3 vs 2.5 ± 0.2 μm2, n = 30 beads from 5 slices, p < 0.001; Fig. 4F). After wash with control aCSF, the amount of transient SD-induced dendritic beading (94.4 ± 1.5% at 40 s, n = 5 slices; Fig. 4C,E) and the size of the beads (4.8 ± 0.3 μm2, n = 30 beads from 5 slices; Fig. 4F) returned to the control values obtained before the exposure to the low-Cl− aCSF. These data suggest that the generation and amplitude of normoxic SD did not require the presence of extracellular Cl−, whereas the molecular mechanism underlying dendritic beading was Cl− -dependent.
Figure 4.

SD-induced dendritic beading is reduced in low-Cl− aCSF. A, Transient dendritic beading in control aCSF during passage of SD. Corresponding SD is shown to the right. B, 2PLSM MIP image sequence of the same dendrites reveals the lack of SD-evoked beading after 15 min of superfusion with a low-Cl− aCSF. C, SD-triggered dendritic beading returns after 15 min of exposure to control aCSF (wash). D, Control KCl-induced SD amplitudes varied in this set of experiments, and amplitudes were accordingly normalized before quantification. The amplitude did not change significantly in low-Cl− aCSF (n = 5 slices, one-way RM-ANOVA with Tukey's post hoc test). E, SD-induced beading was significantly reduced in low-Cl− aCSF (n = 5 slices, two-way RM-ANOVA with Tukey's post hoc test), post-SD quantified at 160 s. Pre-SD fraction of dendritic beading was determined as 0 ± 0% for all conditions and therefore not visible. *p < 0.001. F, Summary of measurements from 30 beads in five slices reveals significant reduction in the beading size in low-Cl− aCSF at 40 s after SD onset (one-way RM-ANOVA with Tukey's post hoc test). *p < 0.001. G, Onset of dendritic beading evoked by ouabain-induced SD is delayed in low-Cl− aCSF (gray symbols) compared with ouabain-induced SDs in normal aCSF (control, black symbols; n = 12 slices, two-way RM-ANOVA with Tukey's post hoc test). *p < 0.05.
To ensure that the Cl− dependency of dendritic beading was not restricted to normoxic KCl-induced SD, we determined the effect of Cl− removal on dendritic beading evoked by terminal ouabain-induced SD. As quantified in Figure 4G, irreversible beading resulting from ouabain-induced SD was delayed significantly in low-Cl− aCSF. Dendritic beading in control aCSF happened at the onset of ouabain-induced SD (Fig. 1A–C), and it was complete by 310 s after SD initiation (Fig. 4G). Intriguingly, within this timeframe, no beading occurred in slices superfused with low-Cl− aCSF: at 8 min after ouabain-induced SD, a mere 10.0 ± 8.3% fraction of beaded dendrites was detected, with the amount of beading slowly increasing as a function of time, with five of six slices displaying complete beading after 20 min. However, ouabain-induced SDs obtained in low-Cl− aCSF displayed ∼60% smaller amplitude than those obtained in control aCSF (3.1 ± 0.5 vs 1.2 ± 0.2 mV, p < 0.01, n = 7 slices from 4 mice). Together, these data suggest that the molecular mechanism underlying SD-induced dendritic beading required Cl− in the extracellular solution whether the SD was triggered by focal KCl microinjection or by exposure to ouabain.
Cotransporters may underlie the generation of dendritic beading
Because beading is not driven by passive osmotic forces and requires the presence of extracellular Cl−, we hypothesized that the SD-induced dendritic beading takes place as a consequence of the altered driving forces for Cl−-dependent cotransporters. A range of cotransporters have been demonstrated to transport water during their translocation mechanism in a manner independent of osmotic forces (Zeuthen, 1994; Zeuthen and MacAulay, 2012; for review, see MacAulay et al., 2004; MacAulay and Zeuthen, 2010) and could thereby induce dendritic beading despite the low osmotic water permeability of the neuronal plasma membrane. To test this hypothesis, we inhibited two cation-chloride cotransporters expressed in neurons, the K+/Cl− cotransporter 2 (KCC2) and the Na+/K+/2Cl− cotransporter 1 (NKCC1; DeFazio et al., 2000; Blaesse et al., 2009) during SD induction. First SD (3.9 ± 0.3 mV) was triggered in control aCSF by focal KCl microinjection, followed by 20 min recovery. Then the slice was pretreated with 1 mm furosemide (blocker of both KCC2 and NKCC1; Payne, 1997; Kakazu et al., 1999) before the induction of a second SD of similar amplitude (4.0 ± 0.4 mV, n = 6 slices from 5 mice, p = 0.67). Dendritic beading occurred in both conditions (Fig. 5A) but the amount of beading was reduced significantly by furosemide at 10 s after SD onset (81.1 ± 6.0% in control aCSF vs 51.8 ± 9.0% in furosemide, n = 6 slices, p < 0.01; Fig. 5B). The cross-section bead area decreased by 21.5 ± 2.8% as measured at 40 s after SD onset (5.4 ± 0.2 μm2 in control vs 4.1 ± 0.2 μm2 in furosemide, n = 36 beads from 6 slices, p < 0.001; Fig. 5C).
Figure 5.

SD-induced dendritic beading is attenuated by separate inhibition of three different classes of cotransporters. A, Representative 2PLSM MIP images of dendritic beading at 40 s after SD onset elicited before (control) and 45 min after pretreatment with 1 mm furosemide. B, Beading before and after furosemide treatment shows significant difference at 10 s after SD onset (n = 6 slices, two-way RM-ANOVA and Sidak's post hoc test), post-SD quantified at 250 s. *p < 0.01. C, Quantification of the size of beads at 40 s after SD onset reveals significant reduction in the cross-section bead area in furosemide-containing aCSF (n = 36 beads in 6 slices, paired t test). *p < 0.001. D, Representative images of beaded dendrites at 40 s after SD onset in control condition and after 45 min of pretreatment with 300 μm DIDS. E, SD-induced beading was significantly reduced in DIDS-containing aCSF at 10 and 40 s after SD onset (n = 6 slices, two-way RM-ANOVA and Sidak's post hoc test), post-SD quantified at 250 s. *p < 0.001. F, The size of beads at 40 s after SD initiation in DIDS-containing aCSF was significantly decreased (n = 36 beads in 6 slices, paired t test). *p < 0.001. G, 2PLSM MIP images showing dendritic beads of similar sizes at 40 s after SD onset evoked in control condition and after 45 min of pretreatment with 0.5 mm 4-CIN. H, SD-induced dendritic beading percentage was unaffected by 4-CIN, whereas a slower recovery of beading was observed in 4-CIN-containing aCSF compared with control (n = 7 slices, two-way RM-ANOVA and Sidak's post hoc test), post-SD quantified at 250 s. *p < 0.01. I, Summary from 36 beads in 6 slices demonstrating no significant decrease in the size of beads at 40 s during SD after 4-CIN pretreatment (Wilcoxon's signed-rank test, p = 0.07).
The anion exchanger 3 (AE3), which is also expressed in neurons, transports HCO3− and Cl− in opposite directions and therefore requires the presence of Cl− to engage in cotransport activity (Kopito et al., 1989; Alper, 2009). In an experimental design similar to the one described above, the amount of dendritic beading at 40 s after SD onset was reduced significantly by 29.0 ± 6.7% (89.2 ± 4.1 vs 62.7 ± 5.7%, n = 6 slices from 4 mice, p < 0.001; Fig. 5D,E) in the presence of the AE3 inhibitor DIDS (300 μm; Kopito et al., 1989) without affecting the SD amplitude (4.5 ± 0.6 vs 4.6 ± 0.2 mV, n = 6 slices, p = 0.90). Moreover, the size of DIDS-persistent dendritic beads at 40 s after SD onset was also reduced significantly by 13.6 ± 2.5% (5.3 ± 0.3 vs 4.5 ± 0.2 μm2, n = 36 beads from 6 slices, p < 0.001; Fig. 5F).
SD-elicited extracellular acidification and increased levels of lactate should increase the function of the neuronal monocarboxylate transporter 2 (MCT2; Halestrap, 2013). Therefore, we hypothesized that MCT2 could also participate in the dendritic beading by cotransporting water molecules during lactate and proton clearance from the extracellular space (Zeuthen et al., 1996). We quantified dendritic beading in the control aCSF and then after exposure to the MCT2 inhibitor 4-CIN (0.5 mm; Bröer et al., 1999) in an experimental design as above. The maximal fraction of dendrites beaded at 40 s during SD was not altered by the inhibition of MCT2 (87.9 ± 4.7 vs 83.9 ± 4.8%, n = 7 slices from 3 mice, p = 0.92; Fig. 5G,H) nor were the amplitude of SD changed (3.5 ± 0.3 vs 3.7 ± 0.4 mV, n = 7 slices, p = 0.15) or the cross-section area of the beads at 40 s after SD induction (4.3 ± 0.1 vs 4.2 ± 0.2 μm2, n = 72 beads from 6 slices, p = 0.07; Fig. 5I). However, at 250 s after SD initiation, 21.8 ± 11.0% of beading remained during 4-CIN treatment, whereas beading had returned to 0.5 ± 0.5% in the control condition (n = 7 slices, p < 0.01; Fig. 5H).
Together, these data suggest that the disturbance of ion homeostasis during SD could alter the activity of these cotransport proteins which thereby contribute to intracellular water accumulation and generation of dendritic beading.
Inhibition of NKCC1, KCC2, AE3, and MCT2 reduces dendritic beading in slices
Because blockers against these classes of cotransporters independently diminished the extent of SD-induced dendritic beading or reduced their recovery, we hypothesized that additive contribution of these cotransporters to dendritic beading might be reduced to an even greater degree by a mixture of all three inhibitors: furosemide, DIDS, and 4-CIN. Control dendritic beading was elicited by KCl-induced SD (Fig. 6A), followed by 20 min recovery and subsequent exposure to aCSF containing furosemide (1 mm), DIDS (300 μm), and 4-CIN (0.5 mm). The second SD of amplitude similar to the control SD elicited in the presence of the drug mixture (3.0 ± 0.7 vs 2.8 ± 0.4 mV, n = 6 slices from 3 mice, p = 0.61; Fig. 6B) resulted in less prominent beading (Fig. 6C). The maximal degree of dendritic beading at 40 s after SD initiation was reduced significantly by 19.2 ± 2.7% (94.7 ± 2.7 vs 76.6 ± 3.6%, n = 6 slices, p < 0.01; Fig. 6D) and the cross-section area of remaining beads was decreased by 45.5 ± 4.3% (4.2 ± 0.2 vs 2.2 ± 0.2 μm2, n = 36 beads from 6 slices, p < 0.001; Fig. 6E). At 250 s after SD initiation, the fraction of beaded dendrites was 42.2 ± 8.7% in the drug mixture containing aCSF compared with 0.9 ± 0.9% of beading that remained in the control aCSF (n = 6 slices, p < 0.001; Fig. 6D). Therefore, inhibition of these selected cotransporters does not affect generation and amplitude of SD but reduces the fraction of beaded dendrites by ∼20% and the cross-section area of the remaining beads by ∼50%. These data indicate that cotransporter activity, at least in part, mediates the formation of SD-induced dendritic beading.
Figure 6.

Mixture of furosemide (Fur), DIDS, and 4-CIN inhibits dendritic beading in slices. A, 2PLSM MIP control image sequence of transient dendritic beading during passage of KCl-induced SD (shown to the right). B, Amplitude of KCl-evoked SD was not different before and after pretreatment with drug mixture (n = 6 slices, paired t test). C, 2PLSM MIP image sequence of the same dendrites exhibiting reduced beading during the second SD evoked 15 min after pretreatment of the slice with a mixture of inhibitors of cotransport proteins. The brief drug mixture incubation time was chosen to optimize image quality before induction of the second SD. D, SD-induced dendritic beading shows diminished maximal fraction of beaded dendrites at 40 s after SD onset alongside slower dendritic recovery in the drug mixture containing aCSF (n = 6 slices, two-way RM-ANOVA and Sidak's post hoc test), post-SD quantified at 250 s. *p < 0.01. E, Quantification of cross-section area of beads 40 s after SD onset before and after the three drug mixture application illustrates reduced beading area after drug exposure (n = 36 beads in 6 slices, paired t test). *p < 0.001.
Inhibition of NKCC1, KCC2, AE3, and MCT2 effectively reduces dendritic beading in vivo
Although slice preparations offer the advantage of rapid introduction of drugs with known concentrations and the precise control of pO2, pCO2, pH, and temperature, slices lack circulation and are obviously not as intact as highly relevant life and disease models with in vivo preparations. Therefore, we corroborated in vivo whether pharmacological inhibition of these cotransporters by a mixture of furosemide, DIDS, and 4-CIN would diminish SD-induced beading. The same methodological approach was used, although 2PLSM images were taken through the cranial window over the somatosensory cortex of the mouse. Previously, several studies in mice have reported that normoxic SD induces vasoconstriction/hypoperfusion and that it takes ∼1 h for blood flow to recover to initial values (Ayata et al., 2004; Chang et al., 2010). Hence, 2D maps of cerebral blood flow acquired by laser speckle imaging was used to confirm return of blood flow to baseline when SDs were evoked with an ∼1 h time interval (Fig. 7A) and to ensure sustainability of circulation throughout the experiment. As expected, when the first SD invaded the imaging field, rapid transient dendritic beading was observed (Fig. 7B; Takano et al., 2007; Sword et al., 2013). Initial time control experiments with three consecutive SDs elicited at 59 ± 7 min apart illustrated a tendency toward reduced amplitude of the second SD and a reduction of the third SD amplitude (17.9 ± 0.7 vs 16.4 ± 1.2 and 13.8 ± 1.1 mV, n = 4 mice, p < 0.05; Fig. 7B–D, bottom panels for representative SD traces and E for summarized SD amplitudes). However, these experiments revealed a similar degree of transient dendritic beading (100 ± 0% for first SD, 96.5 ± 2.5% for second SD, and 99.2 ± 0.8% for third SD, p < 0.001, compared with pre-SD beading percentages; Fig. 7B–D, summarized in F, n = 4 mice). Together, these results illustrate that our in vivo preparation was viable and sufficiently robust to act as its own control and thus could be used to determine the effect of cotransporter inhibition on SD-induced dendritic beading in vivo.
Figure 7.
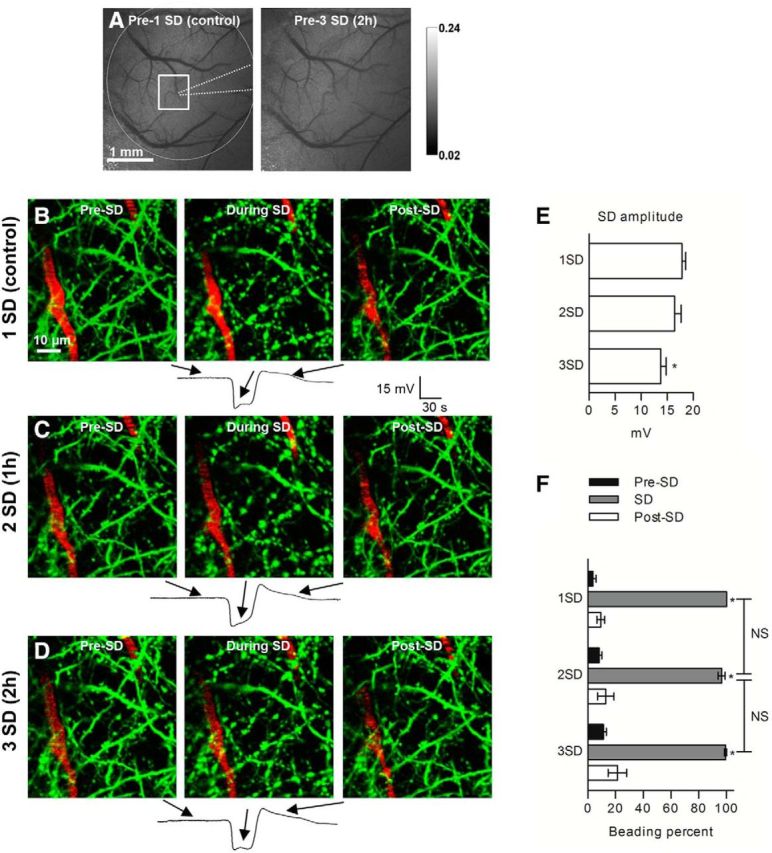
Several rounds of normoxic SD in vivo result in a similar pattern of reversible dendritic beading. A, Grayscale image sequence of laser speckle contrast reveals cortical vasculature directly below the open craniotomy with flowing vessels appearing dark. Edges of the craniotomy (dashed circle), placement of recording electrode (dotted line), and 2PLSM imaging area (square) are indicated in the first image acquired before control SD at the beginning of experiment. Blood flow is stable, as seen in the second image acquired ∼2 h later just before the third SD. B, 2PLSM MIP image sequence of EGFP-positive dendrites (green) and flowing blood vessels (red; blood plasma labeled with Texas Red Dextran) showing rapid beading and recovery of dendrites during passage of control SD. SD was induced with focal KCl microinjection away from the imaging field. Arrows correspond to various time points on the recording of SD obtained with a glass microelectrode placed next to the imaged dendrites. C, D, 2PLSM MIP image sequence of the same dendrites exhibiting similar beading during the second and third SDs elicited at ∼1 h time intervals after the control SD. E, Quantified SD amplitudes from four mice indicate a tendency toward reduced amplitude for the second SD with significant decrease in the amplitude of the third SD (one-way RM-ANOVA with Tukey's post hoc test). *p < 0.05. F, Summary from 12 SDs in four animals shows that dendrites undergo similar rounds of transient beading during the passage of three SDs evoked every ∼1 h. Asterisks at each bar during SD indicate significant difference from the time point before and after SD (one-way RM-ANOVA with Tukey's post hoc test). *p < 0.001.
Cerebral blood flow was monitored with laser speckle imaging before each SD to ensure lack of drug effects on blood flow and its recovery to baseline after SD (Fig. 8A). To test the contribution of NKCC1, KCC2, AE3, and MCT2 to formation of SD-induced dendritic beading in vivo, a control SD was initially induced (18.1 ± 1.0 mV; Fig. 8B, bottom panel for representative trace and F for summarized data). Then, a cortex aCSF containing furosemide (1 mm), DIDS (300 μm), and 4-CIN (0.5 mm) was applied directly to the cortical surface with the dura intact. The amplitude of subsequent SDs obtained at 69 ± 3 min of drug exposure was 13.9 ± 1.2 mV, whereas the third SD induced at 138 ± 7 min of drug application yielded a reduced amplitude of 10.3 ± 1.1 mV (n = 6 mice, p < 0.001; Fig. 8C–E, bottom panel for representative trace and F for summarized data). However, the amplitude of this third SD was not significantly different from the amplitude of the third SD obtained in the time control experiments (p = 0.07) or the amplitude of the fourth SD recorded 30 min after 3× washout of drugs (10.6 ± 1.3 mV, n = 3 mice, p = 0.77; Fig. 8E, bottom panel for representative trace and F for summarized data). Therefore, the drug mixture does not appear to interfere directly with the mechanisms that trigger SD. Additionally, we observed comparable levels of DC electroencephalographic (EEG) signal before control SD and after 2 h of drug mixture application. To confirm this observation, we calculated the power spectrum amplitude (mV2/Hz) in the 0.3–3 Hz band of DC EEG activity that is typical for urethane anesthesia (Mohajerani et al., 2010). DC EEG recordings were analyzed by selecting homologous 3 min segments during the periodic activity reported in urethane-anesthetized mice (Clement et al., 2008; Pagliardini et al., 2013). The power spectrums of EEG signals were similar before control SD and before the third SD at 135 ± 7 min of drug application (n = 6 mice, p = 0.63), indicating no significant drug-induced effects on cortical function.
Figure 8.
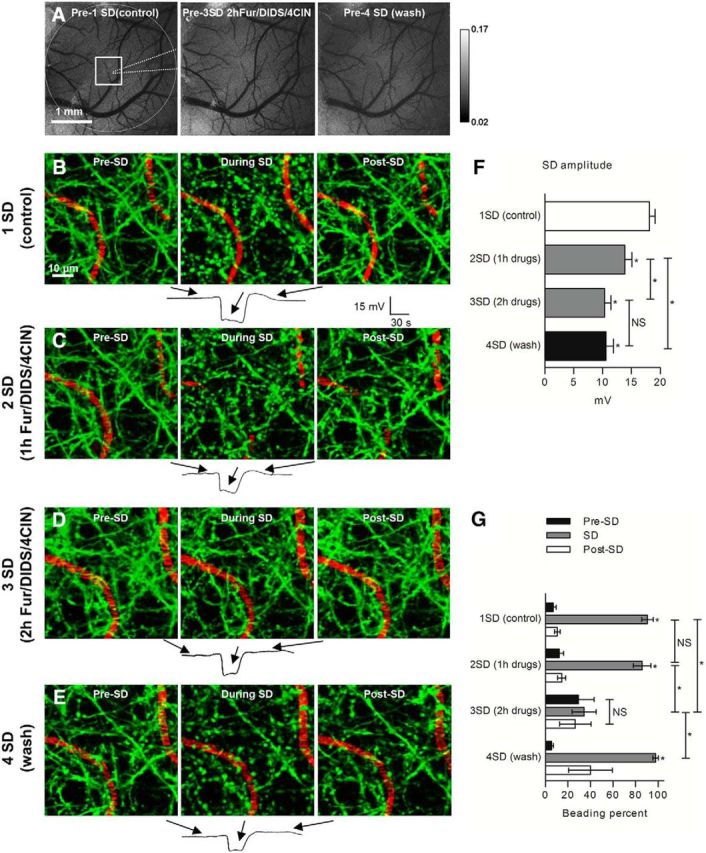
A three-drug mixture of furosemide (Fur), DIDS, and 4-CIN inhibited SD-induced dendritic beading in vivo. A, Representative grayscale sequence of laser speckle contrast images taken before induction of SDs in control, ∼2 h after drug mixture application, and 30 min after three times washout of drugs with cortex aCSF. Edges of craniotomy (dashed circle), placement of recording electrode (dotted line), and 2PLSM imaging area (square) are indicated in the control image acquired at the beginning of experiment. B, 2PLSM MIP image sequence of EGFP-positive dendrites (green) and flowing blood vessels (red) showing rapid beading and recovery of dendrites during passage of control SD. Each image corresponds with a time point indicated on the respective SD recording from a glass microelectrode placed next to imaged dendrites. C, 2PLSM MIP image sequence shows same dendrites undergoing rapid beading during the passage of the second SD induced after ∼1 h of three-drug mixture application to the open craniotomy. D, Dendritic structure remained mostly unchanged (lack of beading) during the passage of the third SD induced after ∼2 h of three-drug mixture application. E, Wash of the exposed cortex three times with cortex aCSF once again revealed a rapidly reversible beading with the passage of SD at 30 min after wash. F, Quantification of the SD amplitudes from six mice indicates significant decrease in the subsequent SD amplitudes with no significant difference between SD elicited at ∼2 h of the three-drug mixture application and SD elicited 30 min after washout of drugs (one-way RM-ANOVA with Tukey's post hoc test). *p < 0.01. G, Quantification of SD-induced dendritic beading reveals that beading was significantly reduced after ∼2 h of three-drug mixture application (n = 6 mice). In three mice that were tested at 30 min after washing three times with cortex aCSF, the drug effect was reversible. Asterisks at the bar during SD indicate significant difference from the time points Pre-SD and Post-SD. The amount of beading during the third SD elicited in the three-drug mixture was not significantly different from Pre-SD and Post-SD (one-way RM-ANOVA with Tukey's post hoc test). Asterisks above the braces indicate significant difference between the amount of beading during SD elicited at ∼2 h in drug mixture from SDs elicited at all other time points during the experiment (one-way RM-ANOVA with Tukey's post hoc test). *p < 0.001.
Dendritic beading in the imaging field was unaffected by the drug mixture at 1 h exposure, but it was reduced visibly during the passage of the third SD induced after 2 h exposure to the drug mixture (Fig. 8D, summarized in G). Accordingly, the amount of dendritic beading in the imaging field was 90.5 ± 5.1% during the control SD, but it was significantly reduced by 65.5 ± 10.3% after 2 h exposure to the transport inhibitors (90.5 ± 5.1 vs 34.3 ± 10.6%, n = 6 mice, p < 0.001; Fig. 8G). However, the SD evoked after the washout procedure induced beading similar to that of the control SD (97.6 ± 2.4%, n = 3 mice; Fig. 8E, summarized in G), indicating that drug-mediated inhibition of SD-induced dendritic beading indeed occurred in a reversible manner. After this post-wash SD induction, a fraction of the dendritic beading remained, with the dendrites in one of the three tested animals resisting recovery. This observation indicates that, at this late experimental time point, SD induction may lead to some degree of partial terminal dendritic beading. Remarkably, in one animal, when the drug mixture was reapplied for 2 h after the first wash, SD-induced beading was, once more, reduced by nearly 50%, followed by partial restoring of SD-induced beading (87.5%) after a second wash procedure. Together, these data provide strong evidence that combined pharmacological inhibition of NKCC1, KCC2, AE3, and MCT2 is sufficient for reduction of SD-induced dendritic beading in vivo.
Discussion
We have demonstrated that SD generation and the ensuing dendritic beading occur by distinct sets of molecular mechanisms and that the latter does not require cytoskeletal rearrangements and evolves independently of osmotic water transport. Rather, select neuronal cotransporters mediate the SD-induced dendritic beading.
SD is triggered by noxious stimuli, such as elevated potassium, glutamate, hypoxia, and ouabain (Balestrino et al., 1999; Hasbani et al., 2001). Once SD is triggered, its course is dictated by underlying ion currents without regard to the noxious stimulus that set the process in motion (Dreier, 2011). Attempts to define a specific ion channel responsible for SD have failed because several ion channels cooperate in initiation, propagation, and its maintenance (Somjen, 2004). SD leads to cytotoxic edema with associated focal swelling or beading along the dendritic shaft separated from each other by thin dendritic segments. Here, we took advantage of the spatial and temporal resolution afforded by 2PLSM to directly quantify, in real time, the parameters of SD-induced dendritic beading with simultaneous monitoring of SD amplitudes. By choosing KCl microinjection as a noxious stimulus to trigger SD, we were able to reliably induce consecutive SDs in the same slice or animal, which allowed for direct assessment of drug-induced alterations in SD-induced dendritic beading.
Cytoskeletal rearrangements have been anticipated to underlie dendritic beading. Previous studies have revealed disrupted microtubules within dendritic beads (Kirov et al., 2004; Hoskison et al., 2007) and accumulated actin filaments (Gisselsson et al., 2005). In our experiments, SD-induced dendritic beading was not prevented by pharmacological interference with cytoskeletal rearrangements. This observation is in agreement with a previous study (Hoskison and Shuttleworth, 2006) that suggested that both initial disruption of microtubules and dendritic beading may result directly from excessive water influx. SD-induced dendritic beading could thus result from Ca2+-independent events, such as excessive influx of Na+ and Cl− with obligatory osmotic water uptake (Hasbani et al., 1998; Kirov et al., 2004). When a severe prolonged hyposmotic challenge was used to mimic such osmotic driving forces, dendrites nevertheless resisted volume change. This finding is in agreement with neurons lacking aquaporin expression (Papadopoulos and Verkman, 2013) and their resistance toward volume changes during acute osmotic stress in slices (Andrew et al., 2007). Contrarily, cultured or dissociated neurons respond readily to acute osmotic challenges and return to their initial volume over a matter of minutes (Pasantes-Morales et al., 1993; Aitken et al., 1998). Therefore, in acute brain slices, as used in the present study, SD-induced osmotically obliged passive water transport did not appear as the transmembrane route for the water influx causing the SD-induced dendritic beading.
Near-complete removal of Cl− from the aCSF did not affect the amplitude of KCl-induced SD, whereas ouabain-induced SD displayed reduced amplitude. The latter observation agrees with a previous report demonstrating low-Cl− aCSF-dependent reduction of hypoxia-induced SD amplitude (Müller, 2000). Reduced SD amplitude might reflect fewer implicated neurons near the microelectrode tip, thus lesser disturbance of transmembrane ion gradients within the imaging field that could affect dendritic beading. However, we have observed significant variations in SD amplitude among slices (1–5 mV) which all induced comparable patterns of beading, indicating that the size of the SD amplitude does not directly affect formation of dendritic beads.
Despite the robust SD amplitude observed in the low-Cl− aCSF, SD-induced dendritic beading was severely impaired, whether SD was triggered by focal KCl microinjection or by ouabain, suggesting separation of the molecular pathways underlying SD and dendritic beading. This finding also indicates that SD-induced beading during depolarization occurs via a common mechanism, independently of the nature of the noxious stimulus used to trigger SD. This finding underscores the likelihood that the molecular machinery underlying dendritic beading will also be set in motion during pathological events, such as cerebral ischemia and migraine. Notably, a much-delayed irreversible dendritic beading did occur in the low-Cl− ouabain-containing aCSF. This beading likely took place via a distinct molecular mechanism, possibly caused by cation influx driven by Gibbs–Donnan forces and insufficient cation efflux caused by prolonged inhibition of the Na+/K+-ATPase (Dreier et al., 2013).
A previous comprehensive study (Müller and Somjen, 1999), based on indirect assessment of dendritic beading, yielded conflicting data regarding the Cl− dependence of hypoxia-mediated SD-induced dendritic beading: beading in brain slices required the presence of Cl− when assessed as changes in tissue electrical resistance or light scattering, but bead formation occurred in a Cl−-independent manner when assessed with tetramethyl-ammonium (TMA+)-sensitive microelectrodes. It was concluded that SD-induced dendritic beading occurred independently of Cl−, because the TMA+-sensitive microelectrodes were deemed the more reliable experimental approach to assess changes in the interstitial space (Müller and Somjen, 1999). Here, by real-time monitoring of SD-induced dendritic beading with 2PLMS, we have provided direct evidence that extracellular Cl− is not a requirement for SD generation but is essential for the molecular mechanisms underlying SD-induced dendritic beading.
A range of cotransporters carry the inherent ability to transport water along with translocation of their respective substrates in a manner independent of osmotic driving forces (MacAulay and Zeuthen, 2010). During SD, the driving forces, and thus activity and/or transport direction, for many of these cotransporters alter with the massive shifts in lactate and ion concentrations and pH: increase of [K+]o and [lactate]o and decrease in [Na+]o and [Cl−]o with the extracellular pH after a brief alkaline transient at the onset of SD succeeded by prolonged acidification (Mutch and Hansen, 1984; Müller and Somjen, 2000; Müller, 2000). Several cotransporters of these substrates are expressed in dendrites: the cation/chloride transporters KCC2 and NKCC1 (Payne et al., 1996; Plotkin et al., 1997), the bicarbonate/chloride exchanger AE3 (Kopito et al., 1989), and the H+-coupled monocarboxylate transporter MCT2 (Pierre et al., 2002). Among these cotransporters, NKCC1 and other isoforms of KCC and MCT have been documented to cotransport water along their translocation pathway (Zeuthen, 1994; Zeuthen et al., 1996; Zeuthen and MacAulay, 2012) and thus share the ability to induce dendritic water influx with their SD-induced increased activity. Accordingly, and in line with the requirement for [Cl−]o, we observed a robust reduction in SD-induced dendritic beading on combined inhibition of these cotransporters in both slice and in vivo preparations. It should be noted that the quantification of changes in the size of dendritic beads after inhibition of cotransporters is most likely an underestimate (see Materials and Methods). The pharmacological tools used may not be entirely specific to the tested transporters and may act on other targets, such as the GABAA receptor and the oxidative metabolism pathways (Korpi and Lüddens, 1997; Del Prete et al., 2004). However, none of the inhibitors used affected cortical function, blood flow, or SD amplitudes, providing additional evidence for separate molecular machinery generating the membrane depolarization and dendritic beading. In the in vivo experiments, application of cotransport inhibitors did partly reduce the amplitude of the SD, as detected previously with DIDS and furosemide on hypoxia-induced SD in slices (do Carmo and Martins-Ferreira, 1984; Müller, 2000), while providing near-complete prevention of dendritic beading after sufficient time for drug penetration through the dura into the cortex. Notably, after washout of inhibitors in the in vivo experiments, SD-induced dendritic beading returned to control level but the SD amplitude remained decreased, indicating that the smaller SD amplitude was not the sole cause for reduced SD-induced beading in the presence of cotransport inhibitors. Our results align with previous data on hypoxia-mediated SD-induced changes in dendritic beading (assessed with light reflectance) in which separate inhibition of KCC/NKCC1 yielded little changes in SD-induced dendritic beading (Müller and Somjen, 1999). Conversely, with the increased sensitivity of 2PLSM, we detected a bicarbonate transporter-dependent contribution to dendritic beading that was not observed in the study by Müller and Somjen (1999). In our study, however, combined inhibition of KCCs, NKCC1, MCTs, and bicarbonate transporters yielded substantial (in slices) and almost complete (in vivo) blockage of SD-induced dendritic beading. Therefore, we propose that SD-mediated shifts in ion concentrations and pH alter the driving forces, transport direction, and/or activity of the tested cotransporters. These cotransporters share the ability to mediate dendritic water influx in a manner independent of osmotic forces and thereby promote dendritic beading despite the low inherent osmotic water permeability of the neuronal membrane. It was reported recently that the Cl− channel SLC26A11 contributes to neuronal cell body swelling after pharmacologically induced increased [Na+]i (Rungta et al., 2015). Given the negligible osmotic water permeability of the neuronal membrane (Andrew et al., 2007; Papadopoulos and Verkman, 2013), it will be of future interest to address the mechanism of water entry after SLC26A11 activation.
We conclude that SD-induced dendritic beading does not require cytoskeletal rearrangement and is independent of osmotic forces. Extracellular [Cl−] was not critical for SD generation but was essential for the ensuing dendritic beading that, at least in part, took place as a consequence of altered driving forces, transport direction, and activity of select neuronal cotransporters. These cotransporters share the ability to cotransport water during their translocation mechanism, in a manner independent of osmotic forces, thereby contributing to SD-induced dendritic beading. Using this experimental approach, we provided evidence for the SD generation and the dendritic beading occurring by separate molecular mechanisms.
Footnotes
This work was supported by National Institutes of Health Grant NS083858, American Heart Association Grant 12GRNT16570006 (S.A.K.), and Thorberg's Foundation (N.M.). We thank Libby Perry and Brendan Marshall of the Electron Microscopy Core at the Medical College of Georgia, Georgia Regents University for assistance with electron microscopy.
References
- Aiba I, Carlson AP, Sheline CT, Shuttleworth CW. Synaptic release and extracellular actions of Zn2+ limit propagation of spreading depression and related events in vitro and in vivo. J Neurophysiol. 2012;107:1032–1041. doi: 10.1152/jn.00453.2011. [DOI] [PMC free article] [PubMed] [Google Scholar]
- Aitken PG, Borgdorff AJ, Juta AJA, Kiehart DP, Somjen GG, Wadman WJ. Volume changes induced by osmotic stress in freshly isolated rat hippocampal neurons. Pflugers Arch. 1998;436:991–998. doi: 10.1007/s004240050734. [DOI] [PubMed] [Google Scholar]
- Alper SL. Molecular physiology and genetics of Na+-independent SLC4 anion exchangers. J Exp Biol. 2009;212:1672–1683. doi: 10.1242/jeb.029454. [DOI] [PMC free article] [PubMed] [Google Scholar]
- Anderson TR, Andrew RD. Spreading depression: imaging and blockade in the rat neocortical brain slice. J Neurophysiol. 2002;88:2713–2725. doi: 10.1152/jn.00321.2002. [DOI] [PubMed] [Google Scholar]
- Anderson TR, Jarvis CR, Biedermann AJ, Molnar C, Andrew RD. Blocking the anoxic depolarization protects without functional compromise following simulated stroke in cortical brain slices. J Neurophysiol. 2005;93:963–979. doi: 10.1152/jn.00654.2004. [DOI] [PubMed] [Google Scholar]
- Andrew RD, Labron MW, Boehnke SE, Carnduff L, Kirov SA. Physiological evidence that pyramidal neurons lack functional water channels. Cereb Cortex. 2007;17:787–802. doi: 10.1093/cercor/bhk032. [DOI] [PubMed] [Google Scholar]
- Atkinson SJ, Hosford MA, Molitoris BA. Mechanism of actin polymerization in cellular ATP depletion. J Biol Chem. 2004;279:5194–5199. doi: 10.1074/jbc.M306973200. [DOI] [PubMed] [Google Scholar]
- Ayata C, Shin HK, Salomone S, Ozdemir-Gursoy Y, Boas DA, Dunn AK, Moskowitz MA. Pronounced hypoperfusion during spreading depression in mouse cortex. J Cereb Blood Flow Metab. 2004;24:1172–1182. doi: 10.1097/01.WCB.0000137057.92786.F3. [DOI] [PubMed] [Google Scholar]
- Balestrino M, Young J, Aitken P. Block of (Na+, K+) ATPase with ouabain induces spreading depression-like depolarization in hippocampal slices. Brain Res. 1999;838:37–44. doi: 10.1016/S0006-8993(99)01674-1. [DOI] [PubMed] [Google Scholar]
- Bird MM. The effects of taxol on embryonic chick tectum maintained in culture: an electron microscope study. J Ultrastruct Res. 1984;89:123–135. doi: 10.1016/S0022-5320(84)80009-X. [DOI] [PubMed] [Google Scholar]
- Blaesse P, Airaksinen MS, Rivera C, Kaila K. Cation-chloride cotransporters and neuronal function. Neuron. 2009;61:820–838. doi: 10.1016/j.neuron.2009.03.003. [DOI] [PubMed] [Google Scholar]
- Bröer S, Bröer A, Schneider HP, Stegen C, Halestrap AP, Deitmer JW. Characterization of the high-affinity monocarboxylate transporter MCT2 in Xenopus laevis oocytes. Biochem J. 1999;341:529–535. doi: 10.1042/0264-6021:3410529. [DOI] [PMC free article] [PubMed] [Google Scholar]
- Canals S, Makarova I, López-Aguado L, Largo C, Ibarz JM, Herreras O. Longitudinal depolarization gradients along the somatodendritic axis of CA1 pyramidal cells: a novel feature of spreading depression. J Neurophysiol. 2005;94:943–951. doi: 10.1152/jn.01145.2004. [DOI] [PubMed] [Google Scholar]
- Chang JC, Shook LL, Biag J, Nguyen EN, Toga AW, Charles AC, Brennan KC. Biphasic direct current shift, haemoglobin desaturation and neurovascular uncoupling in cortical spreading depression. Brain. 2010;133:996–1012. doi: 10.1093/brain/awp338. [DOI] [PMC free article] [PubMed] [Google Scholar]
- Chen S, Mohajerani MH, Xie Y, Murphy TH. Optogenetic analysis of neuronal excitability during global ischemia reveals selective deficits in sensory processing following reperfusion in mouse cortex. J Neurosci. 2012;32:13510–13519. doi: 10.1523/JNEUROSCI.1439-12.2012. [DOI] [PMC free article] [PubMed] [Google Scholar]
- Clement EA, Richard A, Thwaites M, Ailon J, Peters S, Dickson CT. Cyclic and sleep-like spontaneous alternations of brain state under urethane anaesthesia. PLoS One. 2008;3:e2004. doi: 10.1371/journal.pone.0002004. [DOI] [PMC free article] [PubMed] [Google Scholar]
- Davies ML, Kirov SA, Andrew RD. Whole isolated neocortical and hippocampal preparations and their use in imaging studies. J Neurosci Methods. 2007;166:203–216. doi: 10.1016/j.jneumeth.2007.07.012. [DOI] [PMC free article] [PubMed] [Google Scholar]
- DeFazio RA, Keros S, Quick MW, Hablitz JJ. Potassium-coupled chloride cotransport controls intracellular chloride in rat neocortical pyramidal neurons. J Neurosci. 2000;20:8069–8076. doi: 10.1523/JNEUROSCI.20-21-08069.2000. [DOI] [PMC free article] [PubMed] [Google Scholar]
- Del Prete E, Lutz TA, Scharrer E. Inhibition of glucose oxidation by α-cyano-4-hydroxycinnamic acid stimulates feeding in rats. Physiol Behav. 2004;80:489–498. doi: 10.1016/j.physbeh.2003.10.007. [DOI] [PubMed] [Google Scholar]
- Dietz RM, Weiss JH, Shuttleworth CW. Zn2+ influx is critical for some forms of spreading depression in brain slices. J Neurosci. 2008;28:8014–8024. doi: 10.1523/JNEUROSCI.0765-08.2008. [DOI] [PMC free article] [PubMed] [Google Scholar]
- do Carmo RJ, Martins-Ferreira H. Spreading depression of Leao probed with ion-selective microelectrodes in isolated chick retina. An Acad Bras Ciênc. 1984;56:401–421. [PubMed] [Google Scholar]
- Douglas HA, Callaway JK, Sword J, Kirov SA, Andrew RD. Potent inhibition of anoxic depolarization by the sodium channel blocker dibucaine. J Neurophysiol. 2011;105:1482–1494. doi: 10.1152/jn.00817.2010. [DOI] [PMC free article] [PubMed] [Google Scholar]
- Dreier JP. The role of spreading depression, spreading depolarization and spreading ischemia in neurological disease. Nat Med. 2011;17:439–447. doi: 10.1038/nm.2333. [DOI] [PubMed] [Google Scholar]
- Dreier JP, Reiffurth C. The stroke-migraine depolarization continuum. Neuron. 2015;86:902–922. doi: 10.1016/j.neuron.2015.04.004. [DOI] [PubMed] [Google Scholar]
- Dreier JP, Woitzik J, Fabricius M, Bhatia R, Major S, Drenckhahn C, Lehmann TN, Sarrafzadeh A, Willumsen L, Hartings JA, Sakowitz OW, Seemann JH, Thieme A, Lauritzen M, Strong AJ. Delayed ischaemic neurological deficits after subarachnoid haemorrhage are associated with clusters of spreading depolarizations. Brain. 2006;129:3224–3237. doi: 10.1093/brain/awl297. [DOI] [PubMed] [Google Scholar]
- Dreier JP, Isele T, Reiffurth C, Offenhauser N, Kirov SA, Dahlem MA, Herreras O. Is spreading depolarization characterized by an abrupt, massive release of gibbs free energy from the human brain cortex? Neuroscientist. 2013;19:25–42. doi: 10.1177/1073858412453340. [DOI] [PMC free article] [PubMed] [Google Scholar]
- Dunn AK, Bolay H, Moskowitz MA, Boas DA. Dynamic imaging of cerebral blood flow using laser speckle. J Cereb Blood Flow Metab. 2001;21:195–201. doi: 10.1097/00004647-200103000-00002. [DOI] [PubMed] [Google Scholar]
- Feng G, Mellor RH, Bernstein M, Keller-Peck C, Nguyen QT, Wallace M, Nerbonne JM, Lichtman JW, Sanes JR. Imaging neuronal subsets in transgenic mice expressing multiple spectral variants of GFP. Neuron. 2000;28:41–51. doi: 10.1016/S0896-6273(00)00084-2. [DOI] [PubMed] [Google Scholar]
- Gisselsson LL, Matus A, Wieloch T. Actin redistribution underlies the sparing effect of mild hypothermia on dendritic spine morphology after in vitro ischemia. J Cereb Blood Flow Metab. 2005;25:1346–1355. doi: 10.1038/sj.jcbfm.9600131. [DOI] [PubMed] [Google Scholar]
- Hadjikhani N, Sanchez Del Rio M, Wu O, Schwartz D, Bakker D, Fischl B, Kwong KK, Cutrer FM, Rosen BR, Tootell RB, Sorensen AG, Moskowitz MA. Mechanisms of migraine aura revealed by functional MRI in human visual cortex. Proc Natl Acad Sci U S A. 2001;98:4687–4692. doi: 10.1073/pnas.071582498. [DOI] [PMC free article] [PubMed] [Google Scholar]
- Halestrap AP. The SLC16 gene family—structure, role and regulation in health and disease. Mol Aspects Med. 2013;34:337–349. doi: 10.1016/j.mam.2012.05.003. [DOI] [PubMed] [Google Scholar]
- Hansen AJ, Zeuthen T. Extracellular ion concentrations during spreading depression and ischemia in the rat brain cortex. Acta Physiol Scand. 1981;113:437–445. doi: 10.1111/j.1748-1716.1981.tb06920.x. [DOI] [PubMed] [Google Scholar]
- Hartings JA, Bullock MR, Okonkwo DO, Murray LS, Murray GD, Fabricius M, Maas AI, Woitzik J, Sakowitz O, Mathern B, Roozenbeek B, Lingsma H, Dreier JP, Puccio AM, Shutter LA, Pahl C, Strong AJ. Spreading depolarisations and outcome after traumatic brain injury: a prospective observational study. Lancet Neurol. 2011a;10:1058–1064. doi: 10.1016/S1474-4422(11)70243-5. [DOI] [PubMed] [Google Scholar]
- Hartings JA, Watanabe T, Bullock MR, Okonkwo DO, Fabricius M, Woitzik J, Dreier JP, Puccio A, Shutter LA, Pahl C, Strong AJ. Spreading depolarizations have prolonged direct current shifts and are associated with poor outcome in brain trauma. Brain. 2011b;134:1529–1540. doi: 10.1093/brain/awr048. [DOI] [PubMed] [Google Scholar]
- Hasbani MJ, Hyrc KL, Faddis BT, Romano C, Goldberg MP. Distinct roles for sodium, chloride, and calcium in excitotoxic dendritic injury and recovery. Exp Neurol. 1998;154:241–258. doi: 10.1006/exnr.1998.6929. [DOI] [PubMed] [Google Scholar]
- Hasbani MJ, Schlief ML, Fisher DA, Goldberg MP. Dendritic spines lost during glutamate receptor activation reemerge at original sites of synaptic contact. J Neurosci. 2001;21:2393–2403. doi: 10.1523/JNEUROSCI.21-07-02393.2001. [DOI] [PMC free article] [PubMed] [Google Scholar]
- Hines DJ, Hines RM, Mulligan SJ, Macvicar BA. Microglia processes block the spread of damage in the brain and require functional chloride channels. Glia. 2009;57:1610–1618. doi: 10.1002/glia.20874. [DOI] [PubMed] [Google Scholar]
- Hoskison MM, Shuttleworth CW. Microtubule disruption, not calpain-dependent loss of MAP2, contributes to enduring NMDA-induced dendritic dysfunction in acute hippocampal slices. Exp Neurol. 2006;202:302–312. doi: 10.1016/j.expneurol.2006.06.010. [DOI] [PubMed] [Google Scholar]
- Hoskison MM, Yanagawa Y, Obata K, Shuttleworth CW. Calcium-dependent NMDA-induced dendritic injury and MAP2 loss in acute hippocampal slices. Neuroscience. 2007;145:66–79. doi: 10.1016/j.neuroscience.2006.11.034. [DOI] [PMC free article] [PubMed] [Google Scholar]
- Iyirhiaro GO, Brust TB, Rashidian J, Galehdar Z, Osman A, Phillips M, Slack RS, Macvicar BA, Park DS. Delayed combinatorial treatment with flavopiridol and minocycline provides longer term protection for neuronal soma but not dendrites following global ischemia. J Neurochem. 2008;105:703–713. doi: 10.1111/j.1471-4159.2007.05166.x. [DOI] [PubMed] [Google Scholar]
- Jensen FE, Harris KM. Preservation of neuronal ultrastructure in hippocampal slices using rapid microwave-enhanced fixation. J Neurosci Methods. 1989;29:217–230. doi: 10.1016/0165-0270(89)90146-5. [DOI] [PubMed] [Google Scholar]
- Jung S, Aliberti J, Graemmel P, Sunshine MJ, Kreutzberg GW, Sher A, Littman DR. Analysis of fractalkine receptor CX3CR1 function by targeted deletion and green fluorescent protein reporter gene insertion. Mol Cell Biol. 2000;20:4106–4114. doi: 10.1128/MCB.20.11.4106-4114.2000. [DOI] [PMC free article] [PubMed] [Google Scholar]
- Kakazu Y, Akaike N, Komiyama S, Nabekura J. Regulation of intracellular chloride by cotransporters in developing lateral superior olive neurons. J Neurosci. 1999;19:2843–2851. doi: 10.1523/JNEUROSCI.19-08-02843.1999. [DOI] [PMC free article] [PubMed] [Google Scholar]
- Kirov SA, Sorra KE, Harris KM. Slices have more synapses than perfusion-fixed hippocampus from both young and mature rats. J Neurosci. 1999;19:2876–2886. doi: 10.1523/JNEUROSCI.19-08-02876.1999. [DOI] [PMC free article] [PubMed] [Google Scholar]
- Kirov SA, Petrak LJ, Fiala JC, Harris KM. Dendritic spines disappear with chilling but proliferate excessively upon rewarming of mature hippocampus. Neuroscience. 2004;127:69–80. doi: 10.1016/j.neuroscience.2004.04.053. [DOI] [PubMed] [Google Scholar]
- Kopito RR, Lee BS, Simmons DM, Lindsey AE, Morgans CW, Schneider K. Regulation of intracellular pH by a neuronal homolog of the erythrocyte anion exchanger. Cell. 1989;59:927–937. doi: 10.1016/0092-8674(89)90615-6. [DOI] [PubMed] [Google Scholar]
- Korpi ER, Lüddens H. Furosemide interactions with brain GABAA receptors. Br J Pharmacol. 1997;120:741–748. doi: 10.1038/sj.bjp.0700922. [DOI] [PMC free article] [PubMed] [Google Scholar]
- Kraig RP, Nicholson C. Extracellular ionic variations during spreading depression. Neuroscience. 1978;3:1045–1059. doi: 10.1016/0306-4522(78)90122-7. [DOI] [PubMed] [Google Scholar]
- LaManna JC, Rosenthal M. Effect of ouabain and phenobarbital on oxidative metabolic activity associated with spreading cortical depression in cats. Brain Res. 1975;88:145–149. doi: 10.1016/0006-8993(75)90963-4. [DOI] [PubMed] [Google Scholar]
- Lauritzen M, Dreier JP, Fabricius M, Hartings JA, Graf R, Strong AJ. Clinical relevance of cortical spreading depression in neurological disorders: migraine, malignant stroke, subarachnoid and intracranial hemorrhage, and traumatic brain injury. J Cereb Blood Flow Metab. 2011;31:17–35. doi: 10.1038/jcbfm.2010.191. [DOI] [PMC free article] [PubMed] [Google Scholar]
- Leao AAP. Pial circulation and spreading depression of activity in the cerebral cortex. J Neurophysiol. 1944;7:391–396. [Google Scholar]
- Li P, Murphy TH. Two-photon imaging during prolonged middle cerebral artery occlusion in mice reveals recovery of dendritic structure after reperfusion. J Neurosci. 2008;28:11970–11979. doi: 10.1523/JNEUROSCI.3724-08.2008. [DOI] [PMC free article] [PubMed] [Google Scholar]
- MacAulay N, Zeuthen T. Water transport between CNS compartments: contributions of aquaporins and cotransporters. Neuroscience. 2010;168:941–956. doi: 10.1016/j.neuroscience.2009.09.016. [DOI] [PubMed] [Google Scholar]
- MacAulay N, Hamann S, Zeuthen T. Water transport in the brain: role of cotransporters. Neuroscience. 2004;129:1029–1042. doi: 10.1016/j.neuroscience.2004.06.045. [DOI] [PubMed] [Google Scholar]
- Masuda T, Croom D, Hida H, Kirov SA. Capillary blood flow around microglial somata determines dynamics of microglial processes in ischemic conditions. Glia. 2011;59:1744–1753. doi: 10.1002/glia.21220. [DOI] [PMC free article] [PubMed] [Google Scholar]
- Mazel T, Richter F, Vargová L, Syková E. Changes in extracellular space volume and geometry induced by cortical spreading depression in immature and adult rats. Physiol Res. 2002;51:S85–S93. [PubMed] [Google Scholar]
- Menna G, Tong CK, Chesler M. Extracellular pH changes and accompanying cation shifts during ouabain-induced spreading depression. J Neurophysiol. 2000;83:1338–1345. doi: 10.1152/jn.2000.83.3.1338. [DOI] [PubMed] [Google Scholar]
- Mies G, Paschen W. Regional changes of blood flow, glucose, and ATP content determined on brain sections during a single passage of spreading depression in rat brain cortex. Exp Neurol. 1984;84:249–258. doi: 10.1016/0014-4886(84)90222-X. [DOI] [PubMed] [Google Scholar]
- Mohajerani MH, McVea DA, Fingas M, Murphy TH. Mirrored bilateral slow-wave cortical activity within local circuits revealed by fast bihemispheric voltage-sensitive dye imaging in anesthetized and awake mice. J Neurosci. 2010;30:3745–3751. doi: 10.1523/JNEUROSCI.6437-09.2010. [DOI] [PMC free article] [PubMed] [Google Scholar]
- Müller M. Effects of chloride transport inhibition and chloride substitution on neuron function and on hypoxic spreading-depression-like depolarization in rat hippocampal slices. Neuroscience. 2000;97:33–45. doi: 10.1016/S0306-4522(00)00025-7. [DOI] [PubMed] [Google Scholar]
- Müller M, Somjen GG. Intrinsic optical signals in rat hippocampal slices during hypoxia-induced spreading depression-like depolarization. J Neurophysiol. 1999;82:1818–1831. doi: 10.1152/jn.1999.82.4.1818. [DOI] [PubMed] [Google Scholar]
- Müller M, Somjen GG. Na+ and K+ concentrations, extra-and intracellular voltages, and the effect of TTX in hypoxic rat hippocampal slices. J Neurophysiol. 2000;83:735–745. doi: 10.1152/jn.2000.83.2.735. [DOI] [PubMed] [Google Scholar]
- Murphy TH, Li P, Betts K, Liu R. Two-photon imaging of stroke onset in vivo reveals that NMDA-receptor independent ischemic depolarization is the major cause of rapid reversible damage to dendrites and spines. J Neurosci. 2008;28:1756–1772. doi: 10.1523/JNEUROSCI.5128-07.2008. [DOI] [PMC free article] [PubMed] [Google Scholar]
- Mutch WAC, Hansen AJ. Extracellular pH changes during spreading depression and cerebral ischemia: mechanisms of brain pH regulation. J Cereb Blood Flow Metab. 1984;4:17–27. doi: 10.1038/jcbfm.1984.3. [DOI] [PubMed] [Google Scholar]
- Nimmerjahn A, Kirchhoff F, Helmchen F. Resting microglial cells are highly dynamic surveillants of brain parenchyma in vivo. Science. 2005;308:1314–1318. doi: 10.1126/science.1110647. [DOI] [PubMed] [Google Scholar]
- Oliveira-Ferreira AI, Milakara D, Alam M, Jorks D, Major S, Hartings JA, Lückl J, Martus P, Graf R, Dohmen C, Bohner G, Woitzik J, Dreier JP. Experimental and preliminary clinical evidence of an ischemic zone with prolonged negative DC shifts surrounded by a normally perfused tissue belt with persistent electrocorticographic depression. J Cereb Blood Flow Metab. 2010;30:1504–1519. doi: 10.1038/jcbfm.2010.40. [DOI] [PMC free article] [PubMed] [Google Scholar]
- Pagliardini S, Gosgnach S, Dickson CT. Spontaneous sleep-like brain state alternations and breathing characteristics in urethane anesthetized mice. PLoS One. 2013;8:e70411. doi: 10.1371/journal.pone.0070411. [DOI] [PMC free article] [PubMed] [Google Scholar]
- Papadopoulos MC, Verkman AS. Aquaporin water channels in the nervous system. Nat Rev Neurosci. 2013;14:265–277. doi: 10.1038/nrn3468. [DOI] [PMC free article] [PubMed] [Google Scholar]
- Pasantes-Morales H, Maar TE, Morán J. Cell volume regulation in cultured cerebellar granule neurons. J Neurosci Res. 1993;34:219–224. doi: 10.1002/jnr.490340209. [DOI] [PubMed] [Google Scholar]
- Payne JA. Functional characterization of the neuronal-specific K-Cl cotransporter: implications for [K+]o regulation. Am J Physiol Cell Physiol. 1997;273:C1516–C1525. doi: 10.1152/ajpcell.1997.273.5.C1516. [DOI] [PubMed] [Google Scholar]
- Payne JA, Stevenson TJ, Donaldson LF. Molecular characterization of a putative K-Cl cotransporter in rat brain A neuronal-specific isoform. J Biol Chem. 1996;271:16245–16252. doi: 10.1074/jbc.271.27.16245. [DOI] [PubMed] [Google Scholar]
- Pérez-Pinzón MA, Tao L, Nicholson C. Extracellular potassium, volume fraction, and tortuosity in rat hippocampal CA1, CA3, and cortical slices during ischemia. J Neurophysiol. 1995;74:565–573. doi: 10.1152/jn.1995.74.2.565. [DOI] [PubMed] [Google Scholar]
- Pierre K, Magistretti PJ, Pellerin L. MCT2 is a major neuronal monocarboxylate transporter in the adult mouse brain. J Cereb Blood Flow Metab. 2002;22:586–595. doi: 10.1097/00004647-200205000-00010. [DOI] [PubMed] [Google Scholar]
- Plotkin MD, Kaplan MR, Peterson LN, Gullans SR, Hebert SC, Delpire E. Expression of the Na+-K+-2Cl− cotransporter BSC2 in the nervous system. Am J Physiol Cell Physiol. 1997;41:C173. doi: 10.1152/ajpcell.1997.272.1.C173. [DOI] [PubMed] [Google Scholar]
- Risher WC, Andrew RD, Kirov SA. Real-time passive volume responses of astrocytes to acute osmotic and ischemic stress in cortical slices and in vivo revealed by two-photon microscopy. Glia. 2009;57:207–221. doi: 10.1002/glia.20747. [DOI] [PMC free article] [PubMed] [Google Scholar]
- Risher WC, Ard D, Yuan J, Kirov SA. Recurrent spontaneous spreading depolarizations facilitate acute dendritic injury in the ischemic penumbra. J Neurosci. 2010;30:9859–9868. doi: 10.1523/JNEUROSCI.1917-10.2010. [DOI] [PMC free article] [PubMed] [Google Scholar]
- Risher WC, Croom D, Kirov SA. Persistent astroglial swelling accompanies rapid reversible dendritic injury during stroke-induced spreading depolarizations. Glia. 2012;60:1709–1720. doi: 10.1002/glia.22390. [DOI] [PMC free article] [PubMed] [Google Scholar]
- Rungta RL, Choi HB, Tyson JR, Malik A, Dissing-Olesen L, Lin PJ, Cain SM, Cullis PR, Snutch TP, MacVicar BA. The cellular mechanisms of neuronal swelling underlying cytotoxic edema. Cell. 2015;161:610–621. doi: 10.1016/j.cell.2015.03.029. [DOI] [PubMed] [Google Scholar]
- Schliwa M, Euteneuer U, Bulinski JC, Izant JG. Calcium lability of cytoplasmic microtubules and its modulation by microtubule-associated proteins. Proc Natl Acad Sci U S A. 1981;78:1037–1041. doi: 10.1073/pnas.78.2.1037. [DOI] [PMC free article] [PubMed] [Google Scholar]
- Sigler A, Goroshkov A, Murphy TH. Hardware and methodology for targeting single brain arterioles for photothrombotic stroke on an upright microscope. J Neurosci Methods. 2008;170:35–44. doi: 10.1016/j.jneumeth.2007.12.015. [DOI] [PubMed] [Google Scholar]
- Somjen GG. Mechanisms of spreading depression and hypoxic spreading depression-like depolarization. Physiol Rev. 2001;81:1065–1096. doi: 10.1152/physrev.2001.81.3.1065. [DOI] [PubMed] [Google Scholar]
- Somjen GG. Ions in the brain: normal function, seizures, and stroke. New York: Oxford UP; 2004. [Google Scholar]
- Spector I, Shochet NR, Kashman Y, Groweiss A. Latrunculins: novel marine toxins that disrupt microfilament organization in cultured cells. Science. 1983;219:493–495. doi: 10.1126/science.6681676. [DOI] [PubMed] [Google Scholar]
- Sword J, Masuda T, Croom D, Kirov SA. Evolution of neuronal and astroglial disruption in the peri-contusional cortex of mice revealed by in vivo two-photon imaging. Brain. 2013;136:1446–1461. doi: 10.1093/brain/awt026. [DOI] [PMC free article] [PubMed] [Google Scholar]
- Takano T, Tian GF, Peng W, Lou N, Lovatt D, Hansen AJ, Kasischke KA, Nedergaard M. Cortical spreading depression causes and coincides with tissue hypoxia. Nat Neurosci. 2007;10:754–762. doi: 10.1038/nn1902. [DOI] [PubMed] [Google Scholar]
- Windmüller O, Lindauer U, Foddis M, Einhäupl KM, Dirnagl U, Heinemann U, Dreier JP. Ion changes in spreading ischaemia induce rat middle cerebral artery constriction in the absence of NO. Brain. 2005;128:2042–2051. doi: 10.1093/brain/awh545. [DOI] [PubMed] [Google Scholar]
- Yamamoto K, Morimoto K, Yanagihara T. Cerebral ischemia in the gerbil: transmission electron microscopic and immunoelectron microscopic investigation. Brain Res. 1986;384:1–10. doi: 10.1016/0006-8993(86)91212-6. [DOI] [PubMed] [Google Scholar]
- Yamamoto K, Hayakawa T, Mogami H, Akai F, Yanagihara T. Ultrastructural investigation of the CA1 region of the hippocampus after transient cerebral ischemia in gerbils. Acta Neuropathol. 1990;80:487–492. doi: 10.1007/BF00294608. [DOI] [PubMed] [Google Scholar]
- Yang O, Cuccia D, Choi B. Real-time blood flow visualization using the graphics processing unit. J Biomed Optics. 2011;16 doi: 10.1117/1.3528610. 016009. [DOI] [PMC free article] [PubMed] [Google Scholar]
- Zeuthen T. Cotransport of K+, Cl- and H2O by membrane proteins from choroid plexus epithelium of Necturus maculosus. J Physiol. 1994;478:203–219. doi: 10.1113/jphysiol.1994.sp020243. [DOI] [PMC free article] [PubMed] [Google Scholar]
- Zeuthen T, MacAulay N. Cotransport of water by Na+-K+-2Cl− cotransporters expressed in Xenopus oocytes: NKCC1 versus NKCC2. J Physiol. 2012;590:1139–1154. doi: 10.1113/jphysiol.2011.226316. [DOI] [PMC free article] [PubMed] [Google Scholar]
- Zeuthen T, Hamann S, La Cour M. Cotransport of H+, lactate and H2O by membrane proteins in retinal pigment epithelium of bullfrog. J Physiol. 1996;497:3–17. doi: 10.1113/jphysiol.1996.sp021745. [DOI] [PMC free article] [PubMed] [Google Scholar]
- Zhou N, Gordon GR, Feighan D, MacVicar BA. Transient swelling, acidification, and mitochondrial depolarization occurs in neurons but not astrocytes during spreading depression. Cereb Cortex. 2010;20:2614–2624. doi: 10.1093/cercor/bhq018. [DOI] [PubMed] [Google Scholar]