

Abstract
Many studies of reaching and pointing have shown significant spatial and temporal correlations between eye and hand movements. Nevertheless, it remains unclear whether these correlations are incidental, arising from common inputs (independent model); whether these correlations represent an interaction between otherwise independent eye and hand systems (interactive model); or whether these correlations arise from a single dedicated eye-hand system (common command model). Subjects were instructed to redirect gaze and pointing movements in a double-step task in an attempt to decouple eye-hand movements and causally distinguish between the three architectures. We used a drift-diffusion framework in the context of a race model, which has been previously used to explain redirect behavior for eye and hand movements separately, to predict the pattern of eye-hand decoupling. We found that the common command architecture could best explain the observed frequency of different eye and hand response patterns to the target step. A common stochastic accumulator for eye-hand coordination also predicts comparable variances, despite significant difference in the means of the eye and hand reaction time (RT) distributions, which we tested. Consistent with this prediction, we observed that the variances of the eye and hand RTs were similar, despite much larger hand RTs (∼90 ms). Moreover, changes in mean eye RTs, which also increased eye RT variance, produced a similar increase in mean and variance of the associated hand RT. Taken together, these data suggest that a dedicated circuit underlies coordinated eye-hand planning.
Keywords: drift diffusion, race model, reaction time, eye-hand coordination
hand movements requiring the reaching or grasping of objects are typically preceded by fast eye movements, called saccades, that foveate the location of the intended action (Hayhoe et al. 2003; Johansson et al. 2001; Land and Hayhoe 2001). Such eye-hand coordination is quantified by the degree of coupling seen in the end-point scatter (Sailer et al. 2000; Vercher et al. 1994) and reaction times (RTs) (Fischer and Rogal 1986; Herman et al. 1981; Sailer et al. 2000). Nevertheless, the computational architecture that enables the flexible coupling between otherwise independent eye and hand effectors is not understood (Hwang et al. 2014; Song et al. 2011; Yttri et al. 2013). In principle, three architectures can account for eye-hand coordination. In the first model, temporal correlations are thought to arise from common inputs. In such model, the eye and hand system are independent and the observed correlations are incidental. In the second model, the interactive model, eye-hand coordination is thought to arise from an interaction between otherwise independent systems. In the third model, called the common command model, eye-hand coordination is thought to arise from a dedicated eye-hand system (Bizzi et al. 1971).
To distinguish between these three architectures, we used a redirect task (Kapoor and Murthy 2008; Ramakrishnan et al. 2010) in which subjects make coordinated eye-hand movements to a peripheral target but are expected to cancel that initial plan in real time and redirect their response to a second target on a random fraction of target step trials. The redirect task is a double-step variant of the classical countermanding task, which is used to probe the nature of inhibitory control in various effector systems (Mirabella et al. 2006; Ramakrishnan et al. 2012). Hence, like the countermanding task, performance in the redirect task can also be explained by a race model (Camalier et al. 2007; Kapoor and Murthy 2008; Logan and Cowan 1984) that comprises two computational processes, a GO1 process that represents the planning of the intended response and a STOP signal that countermands the plan. Both processes are modeled to accumulate toward their respective thresholds, and the winner of the race, i.e., the process that reaches the finish line first, determines the behavioral outcome. Although the race model framework has been extremely successful in explaining the inhibitory performance when a single effector, such as an eye or hand, is used in isolation (Boucher et al. 2007b; Kapoor and Murthy 2008; Mirabella et al. 2006; Ramakrishnan et al. 2012), in the present study we used the redirect task and the race model to test the three different models of eye-hand coordination. The infrequent number of target step trials in the redirect task acted as a behavioral probe that decoupled eye and hand movement planning in real time, providing an opportunity to study the nature of eye-hand coordination during reach/pointing, rather than study inhibitory control per se. Based on the degree and pattern of decoupling predicted by the three models, we tested which of the models best fitted the observed data. In addition, stochastic accumulator models also predict a monotonic dependence of variance on mean RT. We therefore also tested its applicability to explain RT distributions of the compensated and noncompensated eye and hand responses in the context of the three proposed models.
MATERIALS AND METHODS
We recorded 8 normal (4 male, 4 female) right-handed subjects between 23 and 26 yr of age with normal or corrected-to-normal vision. The task and computational methods used in this study are identical to those reported in Gopal et al. (2015). All subjects gave their informed consent in accordance with the guidelines of the Institutional Human Ethics Committee of the National Brain Research Centre, which reviewed and approved the experimental protocol. Subjects were monetarily rewarded for their participation.
Task
We used a redirect task consisting of randomly interleaved no-step (60%) and step trials (40%). Both trials began when subjects fixated on a central white box with their eye and index finger. After a fixation period of 300 ± 100 ms (accurate to the screen refresh rate of 60 Hz), a peripheral green target appeared on either the right or left side of the fixation box at an eccentricity of 12°. Subjects were instructed to make a saccade and point, as quickly and accurately as possible, to the green target. A time limit of 600 ms was imposed on the subject to make a response, after which the trial was aborted. In step trials, the green target was followed by a yellow target, which appeared in a position opposite (180°) to that of the initial green target, with the same eccentricity (12°), after a randomized delay called the target step delay (TSD). On these trials, subjects were instructed to inhibit their planned response to the initial green target and to execute a new response to the yellow final target instead. Trials in which subjects inhibited the response to initial target but responded to the second target were called successful “compensated trials.” Trials in which subjects failed to inhibit the response to the initial target and made an erroneous response to the initial green target were called “noncompensated trials.” Figure 1A shows a schematic of this task and the different responses. Data (no-step trials) from these 8 subjects were used in a previous article (Gopal et al. 2015); in the present article we focus on the step trials.
Fig. 1.

The task. A: in a no-step trial, subjects were instructed to make a saccade, pointing movement, or both to targets that could appear 12° on either side of fixation in an eye-alone, hand-alone, and eye-hand condition, respectively. In a step trial, a second yellow target appeared in the opposite hemifield after a target step delay (TSD). Examples of the different responses are shown for both no-step and step trials. B: temporal sequence of events in a typical noncompensated step trial: the sequence of stimuli (top) and the successive eye (middle) and hand positions (bottom) are shown. The eye and hand initially respond to the green target and are then redirected to the second yellow target, which is shown in the form of displacement (top). The start and end of the saccade (middle) are marked by black and cyan lines, respectively, and those of the hand movement (bottom) are indicated by green and magenta lines, respectively. C and D: schematics of the race model architecture are shown in which a GO process (green) after the initial target onset and a STOP process (red) after the second target onset rise to a common threshold following a constant visual delay. The two processes are modeled as stochastic accumulators. The outcome of the race determines the behavioral outcome in a step trial. A GO2 process (light green) is also initiated along with the STOP process and redirects the response to the second target. C: a compensated step trial in which the STOP process wins the race, thereby inhibiting the response to the initial target. The GO2 process produces a correct response directed to the second target. D: a noncompensated trial in which the GO process wins the race, resulting in an overt response to the initial target.
A compensation function that describes the propensity to make erroneous noncompensated response with increasing TSD was used to assess the performance of subjects in the redirect task. A monotonically increasing function is expected because subjects are more committed to executing the response to the initial target and therefore fail to inhibit their planned response at higher TSDs.
Trials were scored as successful if subjects fixated/reached the target within ±5°, which was determined online by means of an electronic window centered on the target. Auditory feedback was given to the subjects on all successful trials. Verbal feedback was also given to the subjects occasionally when they delayed their response in anticipation of a step trial.
Trial Conditions
Subjects were recorded on the redirect task with three different conditions in separate blocks during separate sessions. TSDs were chosen separately for saccade/pointing conditions to span at least two standard deviations (SDs) of the saccade/hand no-step RT distribution. Time steps were also chosen separately for each condition to ensure reliable compensation functions that span from 0 to 100%.
Eye alone.
Subjects were instructed to position their pointing finger at the central fixation box throughout while they responded with eye to the redirect task. A trial was aborted when the pointing finger moved out of the fixation box along with the eye during a trial. We recorded 600 trials per subject under the eye-alone condition with 6 TSDs ranging from 34 to 284 ms in steps of ∼50 ms, accurate to the screen refresh rate.
Hand alone.
Subjects were instructed to maintain their gaze at the central fixation box while they responded with their hand in the redirect task. A trial was aborted when the eye moved out of the fixation box along with the hand during the trial. We recorded 700 trials per subject under the hand-alone condition with 7 TSDs ranging from 134 to 734 ms in steps of ∼100 ms.
Eye-hand.
Subjects were instructed to respond with both their eye and hand together. Only those trials in which both the eye and the pointing finger satisfied the redirect condition were considered successful. This condition most naturally emulated visually guided coordinated eye-hand behavior. We recorded 1,000 trials per subject under the eye-hand condition with 10 TSDs. TSD values that were used in the eye-hand condition were a combination of those used in the eye-alone and hand-alone conditions, i.e., 34–234 ms in steps of 50 ms (5 TSDs) and 234–734 ms in steps of 100 ms (5 TSDs).
Setup for Data Acquisition
TEMPO/VDOSYNC software (Reflective Computing, St. Louis, MO) displayed the visual cues and facilitated real-time data acquisition at a temporal resolution of 1 ms. A pupil tracker (ISCAN, Boston, MA) running at a sampling frequency of 240 Hz was interfaced with TEMPO, which conveyed eye-movement data in real time. To monitor the hand movements, an electromagnetic tracker (LIBERTY; Polhemus, Colchester, VT) that measured the movement of a sensor strapped on the pointing finger at a sampling frequency of 240 Hz was interfaced with TEMPO in real time. The CRT monitor (SONY SGI, 21-in., 60-Hz refresh rate), housed overhead on a custom-made wooden frame, presented visual cues. Stimuli were calibrated for physical isoluminance using a colorimeter (Minolta CR-96). A plane mirror (25% transmission, 75% reflectance) was placed below the monitor at an angle to reflect the CRT monitor display conveniently for the subjects. To constrain the pointing hand movement on the same virtual plane, an acrylic sheet was kept in the same plane where the virtual image of the monitor was formed. This virtual reality setup was preferred to display targets because it minimized the distortion caused by the CRT monitor on the electromagnetic tracker and facilitated simultaneous eye tracking.
Recording Procedure
Subjects were recorded on three different trial conditions, on separate days, in separate blocks. They were given written as well as verbal instructions, followed by some practice trials (∼50) at the beginning of each session. Each subject performed five to eight sessions. About 500 trials, on average, were performed in a typical session, with breaks after every 250 trials. Trackers were calibrated by having subjects point and fixate at the two target positions and the fixation spot. A chin rest with temple and forehead supports constrained head movements while the pointing hand was placed over the acrylic sheet. A battery-powered light-emitting diode (LED) was strapped with sensor onto the pointing finger to provide visual feedback while the pointing hand moved on the acrylic sheet on which the virtual image of the monitor was formed.
Analysis
Analysis and the statistical testing were done off-line using MATLAB (The MathWorks, Natick, MA). A velocity threshold of 30°/s was used to mark the beginning and the end of a saccade (Fig. 1B). Blinks were filtered out from the saccade traces using a velocity threshold of (800°/s). Such blink-perturbed saccades were removed from the analysis. A threshold of 10 cm/s was used to mark the start and end of the pointing movement. Unless specified, a paired t-test was used throughout to test for statistical significance. Frequency data were arcsine transformed before statistical testing. The population mean and SD are reported throughout. All data tested with parametric tests were tested for normality using the Lilliefors test. The compensation function, which was used to assess performance, was fitted to a cumulative Weibull function, and the midpoint of the fitted function, called the Weibull mean, was calculated. χ2 tests were conducted between the predicted and the observed frequencies of different trial types within each subject. The averaged χ2 statistic across subjects was used as a metric to compare performance between models. The coefficient of determination (r2), which measures the total proportion of observed variation in data that can be explained by a model, was used to assess the goodness of fit between the predicted and the observed distribution of trial types with respect to the TSDs.
Modeling: Race Model Framework.
Behavior in a redirect task can be theoretically explained by a race between two independent stochastic processes - a GO1 process responsible for initiating the response to the target and a STOP process that attempts to inhibit the GO1 process. In step trials these two processes race against each other to a decision threshold and the outcome of this race determines behavior (Boucher et al. 2007a; Ramakrishnan et al. 2012). A noncompensated erroneous response occurs when the GO1 process crosses the threshold before the STOP process (Fig. 1D). In contrast, a correct compensated response occurs when the STOP process crosses the threshold before the GO1 process, allowing a subsequent GO2 process to initiate the response to the final target (Fig. 1C).
Parameter estimation for the race model.
The underlying processes responsible for behavior in the redirect task are the GO1, STOP and GO2 processes. Since the race between the GO1 and STOP determined the outcome of behavior, we focused only on the GO1 process, hereafter called the GO process, and the STOP process. The individual units (GO, and STOP) were modeled as noisy accumulators of sensory information (Fig. 1, C and D) (Ratcliff 2006; Ratcliff and Rouder 1998; Ratcliff and Van Dongen 2011; Usher and McClelland 2001).
GO process.
The rate of accumulation of the GO process is governed by the stochastic equation given below.
| (1) |
where aGO represents the GO unit activation at time t. The mean growth rate of the GO unit is given by μGO, which represents the mean strength of the sensory signal. ξ is a Gaussian noise term with a mean of zero and a standard deviation of σGO that represents the noise in the sensory signal. The accumulation process is simulated after a visual afferent delay of 60 ms using a time resolution of 1 ms between a baseline fixed at 0 and a threshold fixed at 1. Given these model constraints, the strength of the mean growth rate (μGO) and the standard deviation of the noise (σGO) were optimized by scanning a range (0.001–0.1) that can produce RT distributions ranging from 1 to 1,000 ms, using Monte Carlo methods described in greater detail below.
For estimating the parameters of the GO process, a set of μGO and σGO were randomly chosen from a range of values that can generate behaviorally relevant RT distributions (60-1,000 ms). In a single iteration, 2,000 trials were simulated, based on Eq. 1. We computed the least square error (LSE) between the simulated and the observed no-step RT distributions. The LSE served as an index of error that was minimized in the parameter space by using a nonlinear minimization procedure (fmincon) running in MATLAB, which ran 1,000 such iterations. Convergence typically happened in 20–30 iterations. We repeated this procedure 100 times, seeding each run with a different set of initial parameter values that spanned the parameter range, typically observed for RT distributions. This approach ensured that we sampled the parameter space properly by seeding the initial parameter value in random places. The algorithm converged to the same optimal value on majority of the runs, but on a minority of runs it landed in local minima points. We found that the LSE associated with these local minima points were higher compared with the optimal solution. Hence we chose the set of parameters that resulted in the smallest value of the LSE. This whole procedure was repeated to ensure the reliability of the estimated parameters. We also used different bench marking tests to check the reliability of the Monte Carlo estimation procedure, which is detailed in previous work (Gopal et al. 2015).
STOP process.
The STOP process represents the inhibitory activity that builds up to a threshold following the onset of the second stimulus. The rate of accumulation in the STOP accumulator is governed by the stochastic equation shown below
| (2) |
where aSTOP represents the STOP unit activation at time t. The mean growth rate of the STOP unit is given by μSTOP, and ξSTOP is a Gaussian noise term with a mean of zero and a standard deviation of σSTOP that characterizes the noise in the sensory signal. Using Monte Carlo methods, we estimated the strength of the mean growth rate (μSTOP) and the standard deviation of the noise (σSTOP) that could explain the redirect behavior.
The parameters of the STOP process were estimated for each condition separately (eye alone, hand alone, eye-hand) using the observed compensation function. Step trials were simulated based on the race model framework, with the same TSDs used in each condition. In a step trial, the GO accumulator, simulated based on the parameters obtained by fitting the no-step trials, was instantiated after the first target onset. After the final target onset, a STOP accumulator began to rise to the same threshold, controlled by the μSTOP and σSTOP values randomly chosen from a range (0.001–0.1) that is known to generate behaviorally observed compensation functions. GO RTs as well as STOP RTs were estimated based on the time that the respective accumulators took to cross the threshold in each trial. For each TSD, 350 step trials were simulated. The proportion of trials in each TSD that were noncompensated (GO RT < STOP RT) and compensated (GO RT > STOP RT) were calculated. By determining the fraction of compensated to noncompensated trials as a function of TSD, we constructed the simulated compensation function, which was fitted to a Weibull function. The LSE was calculated between the simulated and the observed compensation functions. The LSE was used as an index that was minimized in the parameter space as described above using the fmincon function in MATLAB. The function typically converged to a minimum value within 20–30 iterations. As described earlier, we repeated this procedure 100 times, seeding fmincon with different sets of initial parameter values, which spanned the parameter space for each run. We chose the set of μSTOP and σSTOP parameters (see Supplemental Table S1) that had the least square error. (Supplemental data is available online at the Journal of Neurophysiology website.).
Model of Eye-Hand Coordination
We tested three different models of eye-hand coordination for their ability to account for behavior during a redirect task. To test these models, we used an independent race model, which has been used to explain redirect behavior of saccades (Kapoor and Murthy 2008). Unlike previous work that used the race model to assess inhibitory control, we used it to test three different models underlying the planning of coordinated eye-hand movements. This was achieved by assuming two separate, independent effector-specific STOP processes for the eye and hand in all three models that were tested.
Independent model.
The independent model assumes that the GO processes of the eye and hand are completely independent of each other (Fig. 2A). They are modeled based on Eq. 1 as noisy accumulators whose parameters μGO and σGO (Supplemental Table S1) are estimated using the no-step RT distributions of their alone conditions.
Fig. 2.
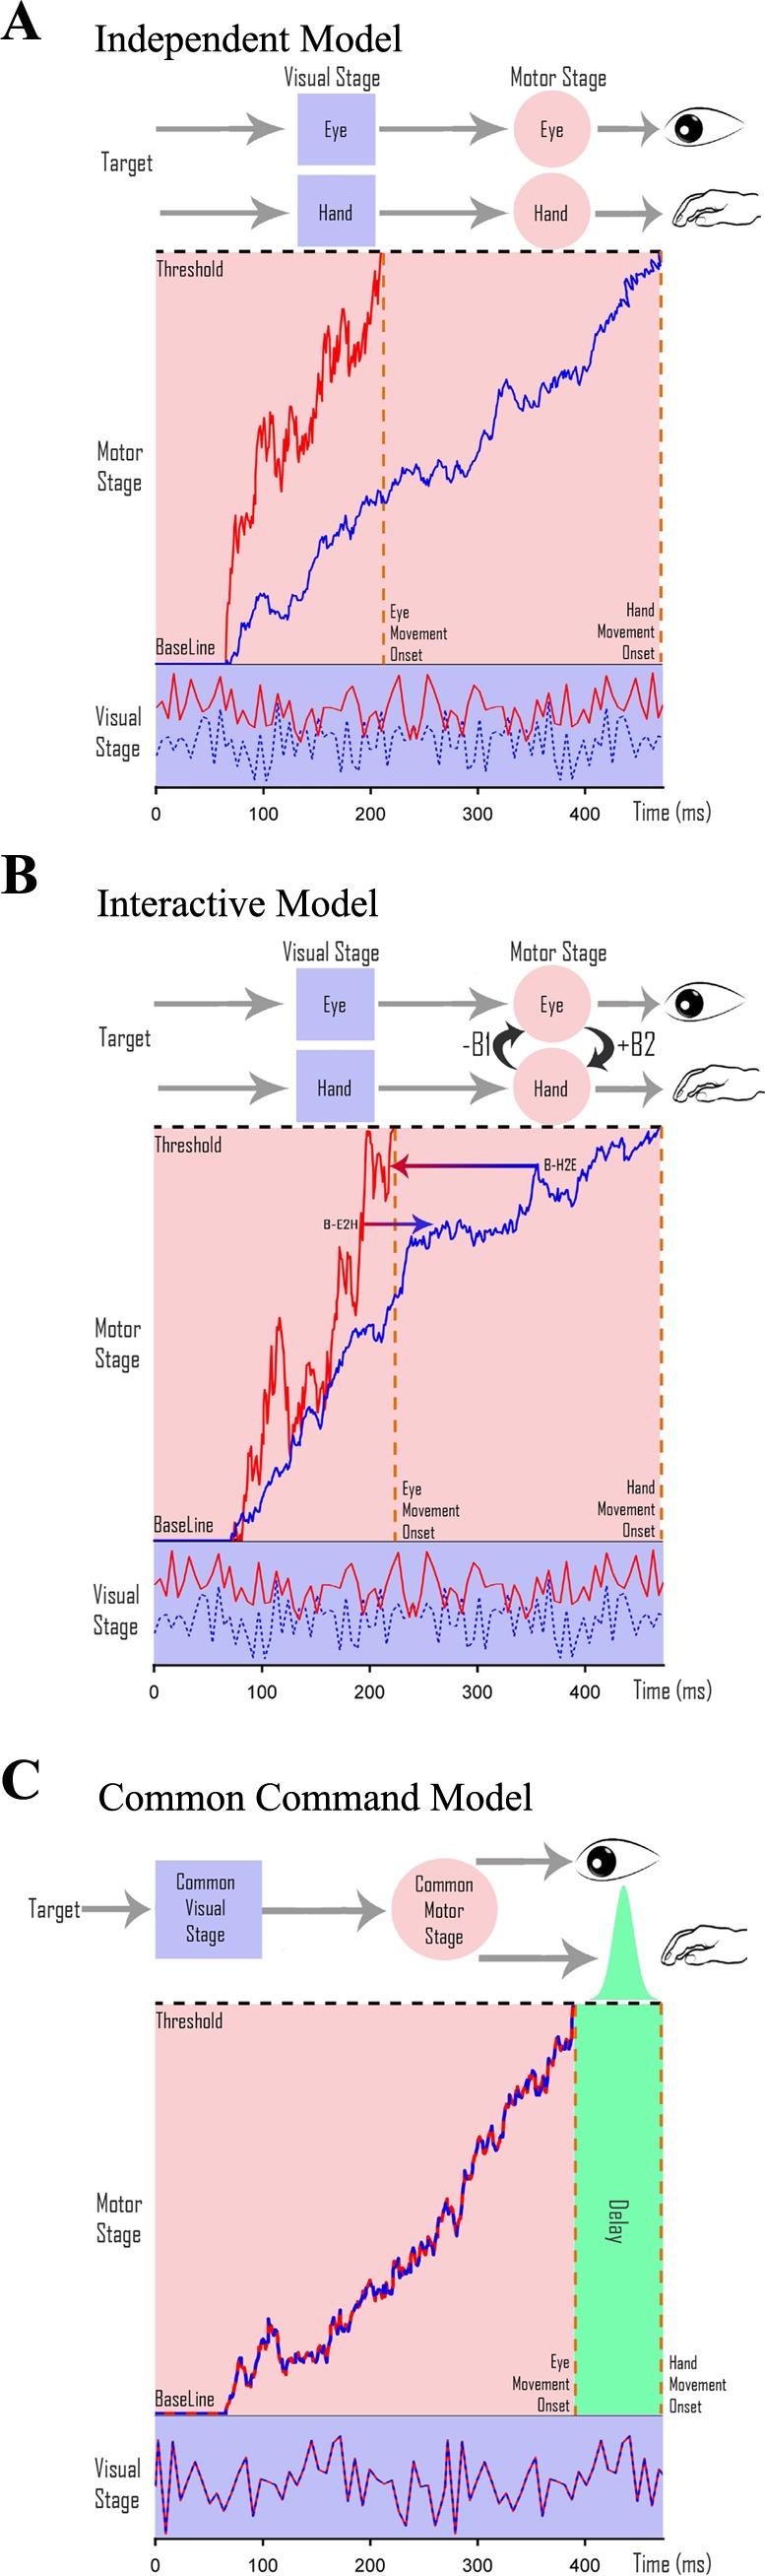
Architecture of eye-hand coordination. A–C: schematics of the 3 different architectures that generate coordinated eye-hand movements. [Adapted from Gopal et al. (2015).] A possible architecture is schematized with a separate visual stage (purple squares), where the targets get encoded, and a motor planning stage (pink circles). Thick red (eye) and dashed blue (hand) traces represent separate stochastic signals that are integrated over time to reach a threshold indicated by the dashed black line. Each movement is executed as soon as the respective accumulator reaches threshold. A: an independent model in which eye and hand effectors have completely distinct and separate visual and motor planning stages but are passively coordinated by the common target. B: an interactive model comprising independent eye and hand networks that interact (black arrows) at the level of motor preparation. C: a common command model, which is thought to have a common visual and motor planning stage. The dashed red-blue trace represents the common stochastic sensory signal that is integrated over time to reach threshold. Saccades are executed as soon as the common signal reaches threshold, whereas hand movements are executed after a temporal delay with Gaussian jitter (green).
Interacting model.
The interacting model assumes an interaction between GO processes of the eye and hand effectors (Fig. 2B) that shifts their mean RT distribution when compared between the eye-alone, hand-alone, and eye-hand conditions (Dean et al. 2011). We estimated the strength of this interaction between the eye and hand accumulators. Each effector was modeled as a separate noisy accumulator governed by the equations below.
| (3) |
| (4) |
The rates of accumulation in the two accumulators were controlled separately. On average, the eye unit accumulated at the rate of μGO-eye per millisecond, varying with a standard deviation of σGO-eye, which was estimated from the no-step RT distribution in the eye-alone condition. Similarly, the hand unit accumulated at a rate of μGO-hand with a noise equivalent to σGO-hand, which was estimated from the no-step hand RT distribution in the hand-alone condition. The level of accumulated activity in the eye accumulator was thought to influence the accumulation in the hand unit, and vice versa. The strength of these interactions from eye to hand and hand to eye were controlled separately by the parameters βe→h and βh→e, respectively, which were estimated from the RT distributions during the eye-hand condition. We simulated 2,000 no-step RTs for eye and hand separately using the above equations after randomly choosing values for the interaction parameters from a range of values. The LSE between the simulated and observed no-step RT distributions of the eye and hand in the eye-hand condition was estimated. The combined (LSEeye + LSEhand) value was used as an index, which was minimized using the fmincon function. As before, we repeated this procedure 100 times, with different sets of initial parameters, and choose that set of parameters (Supplemental Table S1) which had the least error. This model had six parameters that generated multiple solutions if fitted simultaneously. Hence we used a sequential fitting method for estimating the different parameters.
Common command model.
The common command model (Fig. 2C) assumes that eye and hand movements are initiated by a single accumulator that rises to a threshold. Eye movements are executed after the common accumulator reaches threshold, whereas hand movements are executed after a temporal delay. This delay takes into account the difference in the mean eye and hand RT distributions in the coordinated condition.
The common accumulator is again modeled as a noisy accumulator governed by the equation below:
| (5) |
where aGO-COM represents the accumulated activity in the common accumulator at time t. The mean growth rate of the common accumulator is given by μGO-COM, and ξ is a Gaussian noise term with a mean of zero and a standard deviation of σGO-COM that characterizes the noise in the common accumulator.
The no-step eye RT in the coordinated condition was used to estimate the parameters (μGO-COM and σGO-COM; Supplemental Table S1) of the common accumulator. The parameters of the delay distribution were estimated based on the hand RT in the coordinated condition. The delay distribution was assumed to be Gaussian, characterized by the parameters μDELAY and σDELAY. We simulated 2,000 no-step trials. Using the values of μGO-COM and σGO-COM that were estimated earlier, from the above equation, we generated a distribution of time of threshold crossings for the common accumulator. A Gaussian distribution of temporal delays was generated by choosing a random set of parameters for the μDELAY and σDELAY, which were then added to the distribution of time of threshold crossing to simulate the hand RT. The LSE between the simulated no-step hand RT distributions and the observed distribution of the hand in the eye-hand condition was estimated. The LSEhand was minimized in the parameter space using the fmincon function. This procedure was repeated 100 times, with different sets of initial parameter values, randomly chosen to span the parameter space, before the best set of parameters (Supplemental Table S1) for the delay distribution were chosen.
Because a common visual target drives the accumulators of both eye and hand effectors, we also tested a variant of the independent and interacting model by assuming the noise in the respective accumulators to be fully correlated. To implement this, we generated two fully correlated zero mean distributions with variances controlled by σeye and σhand. These noise terms were added to the sensory signals μeye and μhand, respectively, at each time step in implementation of Eqs. 1, 3, and 4 depending on the model under discussion.
RESULTS
A redirect task was performed by subjects to understand the architecture that instantiates eye-hand coordination. To test the independent model (Fig. 2A), we instructed the subjects to perform the redirect task under three different conditions: eye-alone, hand-alone, and eye-hand conditions. We hypothesized that if eye-hand coordination emerged by virtue of receiving common inputs rather than an active process, then redirect behavior in the eye-hand condition should in principle be a superposition of the eye-alone and hand-alone conditions. We used a race model framework to test linear superposition of behavior.
To ensure the validity of using the race model framework on our data set, we tested whether erroneous trials were derived from a subset of no-step trials that escaped inhibition due to their shorter RTs. To test this prediction, we calculated the cumulative probability distribution of the noncompensated trials at each TSD. As predicted by the race model, the cumulative RT distribution at each TSD shifted rightward, i.e., became slower and approached the no-step distribution. This patterning of the noncompensated trials, called “fanning effect,” was shown by all subjects for both the eye-alone (Fig. 3A) and hand-alone conditions (Fig. 3B). To quantify the fanning effect across subjects, median RTs of noncompensated trials at each TSD were computed and subtracted from the median no-step RT distribution. The only TSDs considered reliable for this analysis were those where the number of noncompensated trials was greater than five. In accordance with the fanning effect, the difference between the median no-step and median noncompensated RT was greater in the lowest TSDs, where noncompensated trials were faster than the mean no-step RT, but gradually reduced at higher TSDs as the median noncompensated RT approached the median no-step RT. This pattern is quantified in the significantly negative slope of the best-fit line for the eye-alone and hand-alone conditions This negative trend was seen across subjects for the eye-alone and hand-alone conditions (Fig. 3, C and D, respectively). The mean regression slope was −0.206 ± −0.124 (t = −4.703, df = 7, P = 0.002) for the eye-alone condition and −0.260 ± −0.074 (t = −9.963, df = 7, P < 0.001) for the hand-alone condition. This analysis indicated that the RT data conformed to the predictions of the independent race model.
Fig. 3.

Validating the race model framework. The fanning effect is the progressive shift of the cumulative distributions of noncompensated reaction times (RTs) at each TSD (graded colors) toward the cumulative no-step RT distribution (dashed black line). A: fanning effect for the eye-alone condition in which TSDs ranging from 34 to 285 ms in steps of 50 ms are shown as graded colors from cyan to magenta. B: fanning effect for the hand-alone condition in which TSDs ranging from 134 to 737 ms in steps of 100 ms are shown as graded colors from blue to green. The fanning effect is quantified as the difference between the median no-step RT and the median of the noncompensated trials at each TSD. This difference decreases with increasing TSD, as shown across subjects (separate colors) for the eye-alone (C) and hand-alone (D) conditions.
Testing an Independent Model of Eye-Hand Coordination
We extended the single-effector race model (Fig. 1, C and D) to predict redirect behavior in the coordinated eye-hand condition by introducing two stochastically independent GO processes and two independent STOP processes that initiated and cancelled, respectively, eye and hand movements independently. The GO processes for the individual effectors were modeled based on the no-step RT distributions of the eye-alone and hand-alone conditions. Likewise, the STOP processes for eye and hand were governed by their ability to fit the eye-alone and hand-alone compensation functions. As expected from an independent model, this architecture predicted four different behavioral outcomes in the eye-hand redirect task based on the threshold crossing times (GOeye, STOPeye, GOhand, STOPhand) of the GO and STOP accumulators for eye and hand. There were trials in which both eye and hand movements escaped inhibition (GOeye < STOPeye and GOhand < STOPhand), henceforth called EH-initial trials (also called noncompensated trials). There were trials in which the eye movement escaped inhibition while the hand movement did not (GOeye < STOPeye and GOhand > STOPhand), henceforth called EH-dissociated trials. Conversely, the model also predicted trials in which the eye movement was inhibited while the hand movement escaped inhibition (GOeye > STOPeye and GOhand < STOPhand), henceforth called EH-inverse dissociated trials. The model also predicted trials in which both eye and hand movements were successfully inhibited (GOeye > STOPeye and GOhand > STOPhand), henceforth called the EH-final trials (also called compensated trials). In addition to qualitative predictions, the independent model also predicted the frequency of these different trial types.
Consistent with the independent model, we observed EH-initial trials, EH-dissociated trials, and EH-final trials in each of the eight subjects (Fig. 4A), but unlike the model, we rarely observed any instance of EH-inverse dissociated trials. Also as predicted by the model, we observed the three trial types to occur with different frequencies (Fig. 4B). Nevertheless, the independent model failed to predict the observed data in a number of important ways. For example, a comparison between the predicted and the observed compensation functions for the eye (Fig. 5A) and hand (Fig. 5C) is shown for a typical subject. The observed compensation function was significantly different from the predicted compensation function for both the eye [Kolmogorov-Smirnov (KS) test: P = 0.03] and hand (KS test: P = 0.03). Compensation functions were compared using the Weibull mean and found to be statistically different for the eye (t = 4.05, df = 7, P = 0.005; Fig. 5B) as well as the hand (t = −8.4, df = 7, P < 0.001; Fig. 5D) across subjects. Additionally, the frequency of the three trial types predicted by the model and observed in the data was also used as a metric to test the validity of the independent architecture in a quantitative manner, as shown for a typical subject. As depicted in Fig. 5E, EH-initial trials were underestimated, whereas EH-dissociated trials were overestimated. However, the frequency with which the EH-final trials occurred was well predicted by the independent architecture. The same trend was seen across population (Fig. 5F). EH-initial trials were underestimated, on average, by 18 ± 6% (t = 7.7, df = 7, P < 0.001), whereas the EH-dissociated trials were overestimated, on average, by 22 ± 7% (t = −7.657, df = 7, P < 0.001). In contrast, the frequency of EH-final trials was well predicted across all the subjects (t = 1.74, df = 7, P = 0.12). We also performed a χ2 test and found the predictions to be significantly different from the observed values in all subjects (n = 8, P < 0.001). The average χ2 statistic for the independent model was 298 ± 122. Taken together, these analyses suggest that coordinated eye-hand movements are not just a linear superposition of independent eye and hand behavior.
Fig. 4.

Extending the race model frame work for eye-hand coordination. A: representative trials for 3 different observed behavioral responses. The central fixation spot, initial target (green), and final target (yellow) are shown, along with the eye (red) and hand (blue) trajectories. In an EH-initial trial (top), both eye and hand are directed to the initial target. In an EH-dissociated trial (middle), the eye is directed to the initial target while the hand is directed to the final target. In an EH-final trial (bottom), both eye and hand are directed to the final target. B: the frequency with which the 3 different trial types (EH-initial, black; EH-dissociated, dark brown; EH-final, light brown) occur in the observed data across population is shown separately for each subject.
Fig. 5.

Validating the independent model. A: comparison between the predicted (green) and observed (blue) compensation function fitted using a cumulative Weibull function for the eye. The data points (large symbols) constituting the fit are also plotted. The predicted (small) data points along with their 95% confidence interval (bars) are shown for reference. B: scatter plot of the Weibull means calculated separately from the observed and predicted compensation functions of the eye. Data points are below the unity line (dashed black), suggesting underestimation by the model. C: comparison between the predicted (light green) and observed (cyan) compensation functions fitted using a cumulative Weibull function for the hand. The data points (black circles) observed are also plotted. The predicted (black squares) data points along with their 95% confidence interval (bars) are also shown for reference. D: scatter plot of the Weibull means calculated separately from the observed and predicted compensation functions of the hand. Data points are above the unity line (dashed black), suggesting overestimation by the model. E: predicted (orange) and observed (black) frequencies of EH-initial, EH-dissociated, and EH-final trials for a typical subject. F: scatter plot showing relationship between the predicted and observed frequencies of EH-initial (green), EH-dissociated (red), and EH-final (blue) trials across subjects. The unity line (dashed black) is shown for reference.
We also tested a variant of the independent model in which noisy sensory signals, which were perfectly correlated, accumulated separately for eye and hand. This version of the independent model generated correlations (0.43 ± 0.2; P < 0.001 for all subjects) between simulated RTs of eye and hand, whereas the earlier model did not produce any significant correlations. Interestingly, even after the RT correlations were incorporated in the model, we found that the compensation functions for the eye and hand predicted by the model did not match the data. The frequency of different trial types predicted by the model was also significantly different from the data. There was a modest but significant (t = 2.93, df = 7, P = 0.02) change that was quantified by the average χ2 statistic for the independent model (298 ± 122) compared with the independent model with correlated input (280 ± 116). These observations further suggest that the independent model is not a valid architecture for generating coordinated eye-hand movements.
Testing an Interactive Model of Eye-Hand Coordination
To test for signatures that causally couple eye and hand movement planning, we compared eye and hand no-step RT distributions in the eye-alone and hand-alone conditions and the eye-hand condition and observed that the mean eye RT in the eye-alone condition was faster than the mean eye RT in the eye-hand condition. The converse was true of the hand RT. The mean hand RT in the hand-alone condition was slower than the mean hand RT in the eye-hand condition. Across subjects, compared with the eye-alone condition (255 ± 40 ms), the mean eye RT in the eye-hand condition (299 ± 50 ms) increased by 44 ms, on average (n = 8/8 subjects, t = −4.54, df = 7, P = 0.003). In contrast, the mean hand RT (472 ± 60 ms) in the hand-alone condition compared with the mean hand RT in the eye-hand condition (392 ± 74 ms) decreased by 80 ms, on average, for eye-hand movements (n = 8/8 subjects, t = 5.37, df = 7, P = 0.001).
To test the whether an interactive model (Fig. 2B) could generate the required RT shift and successfully predict the eye-hand behavior in the redirect task, we modeled eye and hand effectors, as independent but interacting accumulators responsible for initiating the movements (GO processes) based on their no-step RT distributions in the eye-alone and hand-alone conditions. RT shifts were modeled through a specific form of interaction between eye and hand accumulators. Hastening of the hand RT in the eye-hand condition occurred through an activity-dependent excitatory interaction from the eye to the hand accumulator. In contrast, the delay of the eye RT in the eye-hand condition occurred through an activity-dependent inhibitory interaction from the hand to the eye accumulator.
The mean RTs predicted by the interactive model and observed in the data were not statistically different (eye: teye = 2.04, dfeye = 7, Peye = 0.08; hand: thand = −2.03, dfhand = 7, Phand = 0.081) across subjects. The best-fit line of the simulated and observed mean eye and hand RTs across all the subjects was close to the unity line (slopeeye = 0.86, slopehand = 0.89) and was also significantly correlated (reye = 0.94, Peye < 0.001; rhand = 0.97, Phand < 0.001). However, the SDs of the eye and hand RT distributions were significantly overestimated by the model (eye: teye = −2.56, dfeye = 7, Peye = 0.03; hand: thand = −6.07, dfhand = 7, Phand < 0.001).
To test whether such an interactive model, embedded in the context of a race model framework, can explain the control of eye-hand behavior, we compared the observed and predicted compensation functions. Across subjects, the predicted and observed Weibull means were significantly different for the eye (t = 2.766, df = 7, P = 0.02; Fig. 6A) but not for the hand (t = −1.27, df = 7, P = 0.24; Fig. 6A). In addition, the frequency of occurrence of different trial types predicted by the model was compared with the observed frequency for a typical subject (Fig. 6C) and across the population (Fig. 6E). The frequency of EH-initial trials was underestimated by 15.8 ± 2.5% (t = 17.88, df = 7, P < 0.001), whereas that of EH-dissociated trials was overestimated by 11.5 ± 4% (t = −7.005, df = 7, P < 0.001). However, the model could reliably predict the frequency of EH-final trials (observed: 34%; predicted: 32%; t = 0.92, df = 7, P = 0.38). The predictions of the model were found to be significantly different from the observed data for each subject (χ2 test, P < 0.001; Fig. 6E). The average χ2 statistic across subjects (213 ± 61) was significantly less (t = 13.64, df = 7, P < 0.001) than for the independent model (280 ± 116). Taken together, these analyses suggest that an interacting model was better than the independent model and predicted the compensation functions of eye and hand effectors well. However, the interacting model failed to explain the frequency of different trial types.
Fig. 6.

Comparison between the interactive and common command models. A and B: scatter plots of Weibull means calculated separately from the observed and predicted compensation functions of the eye (red) and hand (green) for the interactive (A) and common command (B) models. C and D: predicted (orange) and observed (black) frequencies of EH-initial, EH-dissociated, and EH-final trials for a typical subject for the interactive (C) and common command (D) models. E and F: scatter plot showing relationship between the predicted and observed frequencies of EH-initial (green), EH-dissociated (red), and EH-final (blue) trials across subjects for the interactive (E) and common command (F) models. The unity line (dashed black) is shown for reference.
We also tested a modified version of the interactive accumulator model in which independent accumulators were completely correlated. The presence of such correlations indeed improved the predictions of the model. The predicted compensation functions for the eye (t = 2.0, df = 7, P = 0.08) and hand (t = 0.383, df = 7, P = 0.71) were comparable to the observed data. The predictions of the frequency of the different trial types improved, since the average χ2 statistic of 132 ± 64 was significantly better (t = 13.64, df = 7, P < 0.001) than that of the earlier version of the interactive model (213 ± 61). This notwithstanding, the frequency of predicted and observed trial types was still significantly different for EH-initial (t = 11.45, df = 7, P < 0.001) as well as EH-dissociated trials (t = −4.82, df = 7, P = 0.002). This shows that although RT correlations may have a causal influence, improving behavior predictions, they do so only modestly.
Testing the Common Command Model of Eye-Hand Coordination
In contrast to the interactive model, we tested a common command model in which eye and hand movements were instantiated by a single common accumulator that rises to a common threshold as shown in Fig. 2C. We used the eye RT in the eye-hand condition to model the common single accumulator. Monte Carlo simulation was used to estimate the delay required to fit the hand RT distributions. We then incorporated the common command architecture in the race model framework to generate eye and hand movements, i.e., as the GO process. We tested the ability of this modified race model to account for the observed behavior in the redirect task. Across subjects, the Weibull mean calculated from the predicted (WMeye: 206 ± 49, WMhand: 246 ± 80 ms) and the observed compensation functions (WMeye: 208 ± 53 ms, WMhand: 250 ± 62 ms) were not significantly different for the eye (t = 0.60, df = 7, P = 0.68; Fig. 6B) and the hand (t = 0.39, df = 7, P = 0.71; Fig. 6B). In addition, the frequency of occurrence of different trial types predicted by the model was compared with the observed frequency for a typical subject (Fig. 6D) and across the population (Fig. 6F). The frequency of EH-initial trials observed in the data (FObs = 60 ± 10%) and predicted by the model (FPrd = 55 ± 10%) was significantly different (t = 5.77, df = 7, P < 0.001). Unlike the earlier models, the frequency of EH-dissociated trials (FObs = 6 ± 5%, FPrd = 7 ± 4%, t = −1.46, df = 7, P = 0.19) was reliably predicted along with that of the EH-final trials (FObs = 34 ± 10%, FPrd = 35 ± 10%, t = 0.46, df = 7, P = 0.46). Although the predictions of the common command model were significantly different from the observed data for all but one subject (χ2 test: P < 0.001), the average χ2 statistic computed for the common command model (48 ± 28) was significantly lower (t = 4.68, df = 7, P = 0.004) than that for the interactive accumulator model (132 ± 64). This suggests that the common command architecture may provide a better descriptor of the observed behavior in the redirect task.
To further test the common command architecture, we tested other predictions of the model, as well. The race model framework makes very specific predictions regarding the RTs of the error or the noncompensated trials (EH-initial trials). We found no significant difference between the predicted and observed eye and hand RT distributions (KS test: P = 0.81 and P = 0.80, respectively) of the EH-initial trials for a typical subject (Fig. 7A). Across subjects, the means of the predicted and observed eye and hand RT distributions were similar (predictedeye = 285 ± 47, observedeye = 285 ± 49, t = 0.010, df = 7, P = 0.91; Fig. 7B; predictedhand = 358 ± 66 ms, observedhand = 366 ± 64 ms, t = 1.38, df = 7, P = 0.20, Fig. 7C). Likewise, the observed eye and hand SDs were also similar and well predicted (predictedeye = 72 ± 17 ms, observedeye = 69 ± 16 ms, t = −1.23, df = 7, P = 0.25, Fig. 7B; predictedhand = 72 ± 17 ms, observedhand = 76 ± 14 ms, t = 1.13, df = 7, P = 0.29, Fig. 7C). The model also predicted the probabilities of the three different trial types as a function of TSD. In the model simulations, the frequency of simulated EH-initial trials increased with TSD. We found that the predicted and the observed relationship between the probability of EH-initial trials and TSD was comparable (Fig. 7D). The goodness of fit assessed by r2 was 0.967 ± 0.02, on average, across subjects. Similarly, the model predicted the probability of simulated EH-final trials to decrease with increasing TSD. A similar decreasing trend for EH-final trials was observed (Fig. 7F). For EH-final trials, the average goodness of fit was high (0.956 ± 0.03) across subjects. Interestingly, the dependence of probability of simulated EH-dissociated trials as a function of TSD was predicted to be bell shaped. Contrary to this, however, we did not find any systematic pattern in the probability of EH-dissociated trials with TSD (mean r2 = −0.591 ± 1.30; Fig. 7E). Therefore, other than the relationship between the probability of dissociated trials and TSD, the common command architecture could explain eye-hand behavior in the redirect condition.
Fig. 7.

Testing the common command model. A: comparison between the predicted (dashed red) and observed (magenta) RT distributions of noncompensated trials for the eye in a typical subject (top) and similar comparison between the predicted (dashed green) and observed (cyan) RT for the hand (bottom). B: scatter plot of the means (red circles) and SDs (blue squares) between observed and predicted RT distributions of noncompensated trials for the eye across subjects. The data points are close to the unity line (dashed black), suggesting the validity of the model. C: scatter plot of the means (pink diamonds) and SDs (green triangles) between observed and predicted RT distributions of noncompensated trials for the hand across subjects. The data points are close to the unity line (dashed black), suggesting the validity of the model. D: probability of EH-initial trials as a function of TSD that is observed (red) and predicted (blue) by the model. E: probability of EH-dissociated trials as a function of TSD that is observed (red) from the data and predicted (green) by the model. F: probability of EH-final trials as a function of TSD that is observed (black) from the data and predicted (red) by the model. G and H: comparisons of the observed and predicted means (G) and SDs (H) of the noncompensated RT distributions of eye and hand predicted by the 3 models. I: comparison of the least square error between the predicted and the observed relationship of frequency of trial types with TSDs. *P <0.05; **P < 0.01; ***P < 0.001.
We also performed the same analysis for the independent and the interactive models, as well. The means of the noncompensated eye and the hand RT distributions predicted by the independent model were significantly different from the observed data (Peye = 0.019 and Phand = 0.002, respectively; Fig. 7G). However, the SDs of the predicted eye as well as the hand noncompensated RT distributions were not significantly different from the observed data (Peye = 0.366, Phand = 0.986, respectively; Fig. 7H). The converse was true for the interactive model, i.e., the means of the predicted eye and hand noncompensated RTs were not significantly different from the observed data (Peye = 0.357, Phand = 0.175, respectively; Fig. 7G), whereas the SDs of the eye RT but not the hand RT distribution were significantly different from the observed data (Peye = 0.014, Phand = 0.103, respectively; Fig. 7H). Thus both the independent and the interactive models failed to account for the means (Fig. 7G) and SDs (Fig. 7H) of the noncompensated RT distributions of eye and hand simultaneously, in contrast to the common command model.
Next, as shown previously, we tested for the distribution of the different trial types as a function of TSD, predicted by the independent model and the interactive model. Both models were able to predict qualitatively similar trends in the distribution of trial types as a function of TSD, as shown by the common command model. Mean LSE was computed for each trial type between the predicted and the observed data and was used as an index to quantify the goodness of fit. The comparison of the LSE across models is shown in Fig. 7I and was significantly smaller for the common command model compared with the independent model and interactive model for all trial types. Taken together, our results indicate that the common command model best explains the control of coordinated eye-hand behavior in the redirect task.
Within the framework of a diffusion-based accumulator model, a monotonic relationship is expected between the means and SDs of the RT distributions (Wagenmakers et al. 2005). To test this hypothesis, we analyzed the compensated (EH-final) and noncompensated (EH-initial) eye-hand RT distributions. We found that mean noncompensated RTs (eye = 286 ± 48 ms; hand = 370 ± 62 ms) were significantly greater (Fig. 8A) by 61 ms (t = 4.26, df = 7, P = 0.018) for the eye and by 54 ms (t = 2.93, df = 7, P = 0.02) for the hand compared with the compensated trials (eye = 225 ± 42 ms; hand = 316 ± 66 ms). Consistent with an accumulator model framework in which variance scales with mean RT (Fig. 8B), we also found that the average SDs across population for the noncompensated RT distributions (eye = 71 ± 16 ms; hand = 74 ± 13 ms) were significantly (eye: t = 3.61, df = 7, P = 0.008; hand: t = 6.15, df = 7, P < 0.001) greater than the SDs of the compensated RT distributions (eye = 50 ± 10 ms; hand = 55 ± 14 ms). The change in the means of RT distributions of eye and hand due to the difference in the behavioral context (compensated vs. noncompensated) was associated with a corresponding change in the RT variances. This observation is in compliance with the drift diffusion model, which suggests that an increase in the mean RT should be accompanied by an increase in the variances of the RT distributions.
Fig. 8.

Testing the predictions of the common command model. A and B: means (A) and SDs (B) of the RT distributions of the eye (blue) and hand (orange) during compensated (light colors) and noncompensated trials (dark colors). Data from the same subjects are denoted by connecting black lines. C: scatter plot showing relationship between the means (diamonds) and SDs (squares) of the eye and hand RTs during compensated and noncompensated trials for the eye-hand condition. The unity line (black dashed line) shows that the means of the hand RTs are greater than those of the eye RTs, whereas the SDs are comparable. D: change in mean (green) and SD (violet) of the RT distributions between compensated and noncompensated conditions in the eye plotted against changes in the corresponding mean and SD of hand RT distributions across the same conditions. The data points follow the unity line, indicating that the extent of change in eye and hand effectors is comparable and well correlated for the eye-hand condition. E: in contrast, during the alone condition, the means (diamonds) and SDs (squares) of the hand RTs are greater than those of the eye RTs, and their corresponding changes are not comparable (F). *P <0.05; **P < 0.01; ***P < 0.001.
Within the context of an accumulator model when eye and hand movements are triggered by a common accumulator, the variability in the stochastic accumulation process for both effectors is expected to be comparable despite differences in the mean RT. We tested this prediction, using no-step trials as a behavioral signature of the common command model, in earlier work (Gopal et al. 2015). In the present study, we hypothesized that if step trials of the redirect task are also due to a common command, then a behavioral signature of equivalent RT variances for eye and hand should be also evident despite differences in mean eye and hand RT. As hypothesized, despite an increase of 84 ms between mean RTs of the eye and hand during the noncompensated trials (EH-initial), the SDs (eye = 71 ± 16 ms, hand = 75 ± 13 ms) of the respective distributions remained comparable (t = −1.65, df = 7, P = 0.14; Fig. 8C). Similarly, even though there was an increase of 91 ms, on average, between the means of eye and hand RT distributions during compensated (EH-final) trials, the SDs (eye = 50 ± 10 ms; hand = 55 ± 14 ms) of the respective distributions were not significantly different (t = −1.56, df = 7, P = 0.16; Fig. 8C). These data are again consistent with the common command model. Moreover, it also suggests that the same mechanism is used to generate the coordinated movement despite differences in the behavioral contexts.
We further hypothesized that if a common accumulator framework is used to generate coordinated movements in both compensated as well as noncompensated trials, then the behavioral context should affect both effectors to the same extent. To test this, we quantified the effect of behavioral context on eye and hand movements separately as differences between the means of compensated and the noncompensated RT. We found that on average, across subjects, differences in the mean RTs due to the influence of context on eye (57 ± 41 ms) and hand (50 ± 60 ms) were not significant (t = 0.7242, df = 7, P = 0.49). Across subjects, the change in the means of RT distribution of the eye due to the behavioral context was also highly correlated (r = 0.909, P = 0.002; Fig. 8D) with the change in the mean hand RT. Similarly, change in the SDs of the eye (20 ± 18 ms) and hand (16 ± 17 ms) RT distributions due to the behavioral context were also comparable (t = 1.49, df = 7, P = 0.18) and highly correlated (r = 0.87, P = 0.004; Fig. 8D) across subjects. Taken together, these data suggest that coordinated movements in the compensated and noncompensated conditions are generated by common command architecture.
We also performed the same analysis described above on compensated and noncompensated trials obtained during the “alone” condition, when eye and hand effectors were executed in isolation. As shown above, the differences between the means of eye and hand RT distributions were 135 and 218 ms, respectively, and were significantly different for both compensated (t = −6.573, df = 7, P < 0.001) and noncompensated trials (t = −10.940, df = 7, P < 0.001; Fig. 8E), respectively. However, contrary to the eye-hand condition in which the SDs of the eye and hand were comparable, in the “alone” condition the SDs in the compensated (eye = 50 ± 8 ms, hand = 72 ± 15 ms, t = −3.307, df = 7, P = 0.01) and noncompensated trials were significantly different from each other (eye = 54 ± 10 ms, hand = 100 ± 12 ms, t = −13.710, df = 7, P < 0.001; Fig. 8E). Moreover, the extent of modulation of the mean hand RT (99 ± 64 ms) distribution due to the behavioral contexts was greater (t = −4.524, df = 7, P = 0.002) than the average modulation seen in the eye RT (16 ± 30 ms) and was uncorrelated (P = 0.109; Fig. 8F). Similarly, the modulation in the SDs of the hand RT distribution (27 ± 21 ms) was greater (t = −3.546, df = 7, P = 0.009) than that in the SDs of the eye RT distribution (4 ± 12 ms) and was uncorrelated (P = 0.227; Fig. 8F). These results suggest that a common accumulator framework can account for the compensated and noncompensated trials only in the eye-hand condition, and not in the alone condition. These results indicate that a common command initiation signal operating through a dedicated network may underlie coordinated eye-hand movements.
DISCUSSION
In this study we tested three different architectures proposed to underlie eye-hand coordination. We showed that a common command model best explains the eye-hand coordination and associated eye-hand RT distributions.
Race Model of Redirect Behavior
We used a redirect task that is fundamentally an extension of the countermanding task (Boucher et al. 2007b; Hanes and Carpenter 1999; Logan and Cowan 1984) incorporated in a double-step task (Aslin and Shea 1987; Becker and Jürgens 1979; Lisberger et al. 1975). Classically, this paradigm was used to study different aspects of oculomotor control (Hallett and Lightstone 1976), but more recently, studies have shown that performance in this task can be explained by a similar race model that has been proposed for the oculomotor countermanding task used to study inhibitory control (Camalier et al. 2007; Hanes and Carpenter 1999; Kapoor and Murthy 2008). In the present study we have shown that in addition to eye movements, pointing movements show the same fanning pattern (Fig. 3, A and B) typically observed in oculomotor and reach countermanding (Boucher et al. 2007b; Hanes and Schall 1995; Mirabella et al. 2006), which justifies our use of the independent race model to model eye-hand movement redirection.
Although in the countermanding task it is natural to model inhibitory control as a race between a GO and STOP process, redirect behavior, in principle, also can be explained by assuming a race between two GO processes instantiating planning to the initial and final target. Nevertheless, modeling and empirical data, particularly in the context of saccadic behavior in humans and electrophysiological data in behaving monkeys, favor the GO-STOP model (Camalier et al. 2007; Kapoor and Murthy 2008; Murthy et al. 2009; Ramakrishnan et al. 2012). This also can be verified by a rather simple calculation based on the average RTs to the first and second targets. Since noncompensated responses were generally observed to be only ∼50 ms faster than compensated responses, this implies that at TSDs of 50 ms, the finish times of compensated and noncompensated responses should be the same, producing compensated and noncompensated responses with the same probability (P[error] = P[cancel] = 0.5). However, both the eye and hand compensation functions (Fig. 5, A and C) from subjects in the eye-hand tasks reveal that at such TSDs, the probability of making an error was a lot less than 0.5. Thus a simple direct race between GO1 and GO2 cannot account for the observed data and requires a covert inhibitory process for both eye and hand effectors.
We also used the classical independent race model instead of the interactive race model (Boucher et al. 2007a) for four main reasons. First, stochastic independence between GO and STOP processes has been documented by many studies (Colonius et al. 2001; Hanes and Carpenter 1999; Logan and Cowan 1984), and the violation of independence leading to interaction has negligible effects on the predictions of the race model and is limited to shorter TSDs (Gulberti et al. 2014; Özyurt et al. 2003). Second, the fanning effect conforms to the classical independent race model for both eye and hand effectors (Fig. 3). Third, the interactive race model poses a challenge of estimating accurately greater numbers of parameters from the same observed compensation functions, and its solution space maybe prone to multiple solutions. Finally, and most importantly, the purpose of the redirect condition was to test the nature of programming of the GO process, and not the nature of the control signal per se, which was used primarily as a probe to decouple eye-hand movements.
Independent Model
We used the superposition principle to test independence in the context of redirect task based on the behavior observed in the eye-alone and hand-alone conditions. A similar analysis was used to test the independence between GO processes and STOP process of the eye and hand effectors in a countermanding task (Boucher et al. 2007b). Contrary to our results, the observed frequency of the different trial types was well predicted by the independent model in their study, suggesting that eye and hand processes are independent of each other. There were some critical differences between the two studies that could have produced these contradictory results. The first difference was the use of a countermanding task as opposed to a redirect task. Although we believe that the redirect task is an extension of the countermanding task, the presence of the second response in the redirect task may have interacted in ways that make it different from the countermanding task. The second major difference was the use of a joystick instead of the natural pointing movements, which produced lower RT correlations (0.3–0.5) than reported presently (0.56 ± 0.19). Moreover, the shift in the no-step RT distributions that we observed is not reported in their study. There was no significant difference between the mean RTs of the coordinated eye-hand and the hand-alone conditions in their study compared with the 90-ms shift that we observed in our study, whereas a delay of 20 ms was found, on average, between the eye-alone RT and the eye RT in the eye-hand condition in their study compared with the 44-ms difference that we report. This shift in the RT distributions resulted in the independent model being rejected in our study, whereas it was validated in their study. Thus failure of superposition appears to be a consequence of the independent model not taking into account systematic changes in the mean RT distributions of the eye and the hand when they are executed concurrently as opposed to in isolation (Bekkering et al. 1994; Mather and Fisk 1985; Snyder et al. 2002).
Interactive Model
Interaction between eye and hand effectors during a coordinated movement has been observed in many studies in the form of modulation of different parameters such as amplitudes (van Donkelaar 1997; Van Donkelaar et al. 2000), velocity (Snyder et al. 2002), force (Donkelaar et al. 2004), and spatial errors (Sailer et al. 2000; Vercher et al. 1994), as well as between the RTs of eye and hand effectors, as we report in this study (Bekkering et al. 1994; Mather and Fisk 1985). However, there also are earlier reports of shifts in RTs that are opposite to what we have reported (Lünenburger et al. 2000). These studies have used a task design in which eye-alone, hand-alone, and eye-hand trials were randomly interleaved. Although an interleaved design is typically thought to be superior, compared with the blocked design used in the current study, a caveat is that subjects make an added decision regarding the type of movement they have to perform in the trial. Hence, the subtle change in RT may have been obscured. To deal with problems of a block design, we counterbalanced sessions across subjects in our study but still observed consistent changes in RT patterns between the eye-alone, hand-alone, and eye-hand RTs.
A recent study (Dean et al. 2011) modeled eye-hand coordination as interacting eye and hand accumulators to fit the RT means and their correlations. In previous work (Gopal et al. 2015) we tested a similar interactive architecture using the no-step trials RT distributions and showed that although the mean RT could be predicted, the variances of the same distributions could not. Moreover, the model could generate only low RT correlations, unlike what we observed in our study. Although from the perspective of this study the interactive model could explain the midpoint of the compensation functions, it failed to explain its distribution. As a consequence, the model failed to predict the frequencies of different trials types in the redirect task. We used a sequential fitting procedure in which the inputs to the eye and hand accumulators of the interacting model were estimated from the no-step RT distributions of the eye-alone and hand-alone conditions, respectively. The strength of interaction was optimized to produce the shift of the mean RTs observed between the alone and the eye-hand conditions. This data-driven approach helped us get unique and optimal solutions. It could be argued that this sequential procedure limited the degrees of freedom and hence was unable to account for the data. Whereas a more generous approach of fitting all the parameters of the model simultaneously is expected to give better fits to the data, this approach is also expected to come at a cost of yielding multiple solutions. Even if this approach gave a prediction as close to the common command model, statistical model selection would still favor the common command model because of the lower number of free parameters.
Common Command Model
The motivation to test the common command model was derived from previous work showing a tight temporal coupling between the saccadic eye movement and the electromyographic (EMG) onsets of the hand muscles (Biguer et al. 1982; Gribble et al. 2002). In this study we validated and extended these predictions in the context of the redirect task. Unlike the interactive model, the common command model fitted the eye and hand RT distributions, including their means and variances. As a consequence, it could fit the frequency of trial types in the redirect task better than the interactive model. One major shortcoming of this approach is that it involved use of the no-step RT from the coordinated condition as its starting point, whereas in the other two models we used the RT distributions from the alone conditions. Hence, it may be argued that the better fits in the common command arise from this difference. Nevertheless, it is important to note that in the independent model, our hypothesis constrained us to use the RTs of the alone conditions because it is the only possible way to test linear superposition. In the interactive model, although we started from the eye-alone and hand-alone conditions, interactions were posited that shifted the mean RTs to simulate the means observed in the eye-hand coordinated conditions.
Nevertheless, despite showing the best fits to the data, the common command model slightly underestimated the frequency of EH-initial trials. Moreover, we also found very low instances of EH-dissociated trials consistently across subjects. These occurrences during step trials maybe explained by invoking two separate accumulators that initiate eye and hand movements on these subset of trials. Alternatively, these trials are a consequence of the assumption in all the models that multiple independent effector-specific STOP signals are recruited to inhibit eye and hand movements. However, since fewer than 5% of the total trials, on average, were EH-dissociated trials, it was not possible to test these competing hypotheses in this study. This notwithstanding, the variances in the eye and hand RT distributions for both compensated (EH-final) and noncompensated (EH-initial) responses were comparable even though their mean RTs were significantly different from each other. Equivalent changes in mean RT for eyes and hand between compensated and noncompensated trials were not only correlated, but their SDs scaled accordingly. These two observations together provide strong evidence of the utility of a drift diffusion accumulator model and are a definitive signature of a common command underlying coordinated eye-hand RTs.
GRANTS
This work was supported by grants from the Department of Science and Technology (IRHPA) and the Department of Biotechnology, Government of India, and core funding from the National Brain Research Centre. A. Gopal was supported by a fellowship from the National Brain Research Centre.
DISCLOSURES
No conflicts of interest, financial or otherwise, are declared by the authors.
AUTHOR CONTRIBUTIONS
A.G. and A.M. conception and design of research; A.G. performed experiments; A.G. analyzed data; A.G. and A.M. interpreted results of experiments; A.G. prepared figures; A.G. drafted manuscript; A.G. and A.M. edited and revised manuscript; A.G. and A.M. approved final version of manuscript.
REFERENCES
- Aslin RN, Shea SL. The amplitude and angle of saccades to double-step target displacements. Vision Res 27: 1925–1942, 1987. [DOI] [PubMed] [Google Scholar]
- Becker W, Jürgens R. An analysis of the saccadic system by means of double step stimuli. Vision Res 19: 967–983, 1979. [DOI] [PubMed] [Google Scholar]
- Bekkering H, Adam JJ, Kingma H, Huson A, Whiting H. Reaction time latencies of eye and hand movements in single-and dual-task conditions. Exp Brain Res 97: 471–476, 1994. [DOI] [PubMed] [Google Scholar]
- Biguer B, Jeannerod M, Prablanc C. The coordination of eye, head, and arm movements during reaching at a single visual target. Exp Brain Res 46: 301–304, 1982. [DOI] [PubMed] [Google Scholar]
- Bizzi E, Kalil RE, Tagliasco V. Eye-head coordination in monkeys: evidence for centrally patterned organization. Science 173: 452–454, 1971. [DOI] [PubMed] [Google Scholar]
- Boucher L, Palmeri TJ, Logan GD, Schall JD. Inhibitory control in mind and brain: an interactive race model of countermanding saccades. Psychol Rev 114: 376, 2007a. [DOI] [PubMed] [Google Scholar]
- Boucher L, Stuphorn V, Logan GD, Schall JD, Palmeri TJ. Stopping eye and hand movements: Are the processes independent? Percept Psychophys 69: 785–801, 2007b. [DOI] [PubMed] [Google Scholar]
- Camalier C, Gotler A, Murthy A, Thompson K, Logan G, Palmeri T, Schall J. Dynamics of saccade target selection: Race model analysis of double step and search step saccade production in human and macaque. Vision Res 47: 2187–2211, 2007. [DOI] [PMC free article] [PubMed] [Google Scholar]
- Colonius H, Özyurt J, Arndt PA. Countermanding saccades with auditory stop signals: testing the race model. Vision Res 41: 1951–1968, 2001. [DOI] [PubMed] [Google Scholar]
- Dean HL, Martí D, Tsui E, Rinzel J, Pesaran B. Reaction time correlations during eye-hand coordination: Behavior and modeling. J Neurosci 31: 2399–2412, 2011. [DOI] [PMC free article] [PubMed] [Google Scholar]
- Fischer B, Rogal L. Eye-hand-coordination in man: a reaction time study. Biol Cybern 55: 253–261, 1986. [DOI] [PubMed] [Google Scholar]
- Gopal A, Viswanathan P, Murthy A. A common stochastic accumulator with effector-dependent noise can explain eye-hand coordination. J Neurophysiol 113: 2033–2048, 2015. [DOI] [PMC free article] [PubMed] [Google Scholar]
- Gribble PL, Everling S, Ford K, Mattar A. Hand-eye coordination for rapid pointing movements. Exp Brain Res 145: 372–382, 2002. [DOI] [PubMed] [Google Scholar]
- Gulberti A, Arndt PA, Colonius H. Stopping eyes and hands: evidence for non-independence of stop and go processes and for a separation of central and peripheral inhibition. Front Hum Neurosci 8: 61, 2014.24600371 [Google Scholar]
- Hallett P, Lightstone A. Saccadic eye movements towards stimuli triggered by prior saccades. Vision Res 16: 99–106, 1976. [DOI] [PubMed] [Google Scholar]
- Hanes DP, Carpenter R. Countermanding saccades in humans. Vision Res 39: 2777–2791, 1999. [DOI] [PubMed] [Google Scholar]
- Hanes DP, Schall JD. Countermanding saccades in macaque. Vis Neurosci 12: 929–937, 1995. [DOI] [PubMed] [Google Scholar]
- Hayhoe MM, Shrivastava A, Mruczek R, Pelz JB. Visual memory and motor planning in a natural task. J Vis 3: 6, 2003. [DOI] [PubMed] [Google Scholar]
- Herman R, Herman R, Maulucci R. Visually triggered eye-arm movements in man. Exp Brain Res 42: 392–398, 1981. [DOI] [PubMed] [Google Scholar]
- Hwang EJ, Hauschild M, Wilke M, Andersen RA. Spatial and temporal eye-hand coordination relies on the parietal reach region. J Neurosci 34: 12884–12892, 2014. [DOI] [PMC free article] [PubMed] [Google Scholar]
- Johansson RS, Westling G, Bäckström A, Flanagan JR. Eye-hand coordination in object manipulation. J Neurosci 21: 6917–6932, 2001. [DOI] [PMC free article] [PubMed] [Google Scholar]
- Kapoor V, Murthy A. Covert inhibition potentiates online control in a double-step task. J Vis 8: 20, 2008. [DOI] [PubMed] [Google Scholar]
- Land MF, Hayhoe M. In what ways do eye movements contribute to everyday activities? Vision Res 41: 3559–3565, 2001. [DOI] [PubMed] [Google Scholar]
- Lisberger S, Fuchs A, King W, Evinger L. Effect of mean reaction time on saccadic responses to two-step stimuli with horizontal and vertical components. Vision Res 15: 1021–1025, 1975. [DOI] [PubMed] [Google Scholar]
- Logan GD, Cowan WB. On the ability to inhibit thought and action: a theory of an act of control. Psychol Rev 91: 295, 1984. [DOI] [PubMed] [Google Scholar]
- Lünenburger L, Kutz D, Hoffmann KP. Influence of arm movements on saccades in humans. Eur J Neurosci 12: 4107–4116, 2000. [DOI] [PubMed] [Google Scholar]
- Mather JA, Fisk JD. Orienting to targets by looking and pointing: parallels and interactions in ocular and manual performance. Q J Exp Psychol A 37: 315–338, 1985. [Google Scholar]
- Mirabella G, Pani P, Paré M, Ferraina S. Inhibitory control of reaching movements in humans. Exp Brain Res 174: 240–255, 2006. [DOI] [PubMed] [Google Scholar]
- Murthy A, Ray S, Shorter SM, Schall JD, Thompson KG. Neural control of visual search by frontal eye field: effects of unexpected target displacement on visual selection and saccade preparation. J Neurophysiol 101: 2485–2506, 2009. [DOI] [PMC free article] [PubMed] [Google Scholar]
- Özyurt J, Colonius H, Arndt PA. Countermanding saccades: evidence against independent processing of go and stop signals. Percept Psychophys 65: 420–428, 2003. [DOI] [PubMed] [Google Scholar]
- Ramakrishnan A, Chokhandre S, Murthy A. Voluntary control of multisaccade gaze shifts during movement preparation and execution. J Neurophysiol 103: 2400–2416, 2010. [DOI] [PubMed] [Google Scholar]
- Ramakrishnan A, Sureshbabu R, Murthy A. Understanding how the brain changes its mind: microstimulation in the macaque frontal eye field reveals how saccade plans are changed. J Neurosci 32: 4457–4472, 2012. [DOI] [PMC free article] [PubMed] [Google Scholar]
- Ratcliff R. Modeling response signal and response time data. Cogn Psychol 53: 195–237, 2006. [DOI] [PMC free article] [PubMed] [Google Scholar]
- Ratcliff R, Rouder JN. Modeling response times for two-choice decisions. Psychol Sci 9: 347–356, 1998. [Google Scholar]
- Ratcliff R, Van Dongen HP. Diffusion model for one-choice reaction-time tasks and the cognitive effects of sleep deprivation. Proc Natl Acad Sci USA 108: 11285–11290, 2011. [DOI] [PMC free article] [PubMed] [Google Scholar]
- Sailer U, Eggert T, Ditterich J, Straube A. Spatial and temporal aspects of eye-hand coordination across different tasks. Exp Brain Res 134: 163–173, 2000. [DOI] [PubMed] [Google Scholar]
- Snyder LH, Calton JL, Dickinson AR, Lawrence BM. Eye-hand coordination: saccades are faster when accompanied by a coordinated arm movement. J Neurophysiol 87: 2279–2286, 2002. [DOI] [PubMed] [Google Scholar]
- Song JH, Rafal RD, McPeek RM. Deficits in reach target selection during inactivation of the midbrain superior colliculus. Proc Natl Acad Sci USA 108: E1433–E1440, 2011. [DOI] [PMC free article] [PubMed] [Google Scholar]
- Usher M, McClelland JL. The time course of perceptual choice: the leaky, competing accumulator model. Psychol Rev 108: 550, 2001. [DOI] [PubMed] [Google Scholar]
- van Donkelaar P. Eye-hand interactions during goal-directed pointing movements. Neuroreport 8: 2139–2142, 1997. [DOI] [PubMed] [Google Scholar]
- van Donkelaar P, Lee JH, Drew AS. Transcranial magnetic stimulation disrupts eye-hand interactions in the posterior parietal cortex. J Neurophysiol 84: 1677–1680, 2000. [DOI] [PubMed] [Google Scholar]
- van Donkelaar P, Siu KC, Walterschied J. Saccadic output is influenced by limb kinetics during eye-hand coordination. J Mot Behav 36: 245–252, 2004. [DOI] [PubMed] [Google Scholar]
- Vercher J, Magenes G, Prablanc C, Gauthier G. Eye-head-hand coordination in pointing at visual targets: spatial and temporal analysis. Exp Brain Res 99: 507–523, 1994. [DOI] [PubMed] [Google Scholar]
- Wagenmakers EJ, Grasman RP, Molenaar PC. On the relation between the mean and the variance of a diffusion model response time distribution. J Math Psychol 49: 195–204, 2005. [Google Scholar]
- Yttri EA, Liu Y, Snyder LH. Lesions of cortical area LIP affect reach onset only when the reach is accompanied by a saccade, revealing an active eye-hand coordination circuit. Proc Natl Acad Sci USA 110: 2371–2376, 2013. [DOI] [PMC free article] [PubMed] [Google Scholar]