Abstract
Esophageal axial shortening is caused by longitudinal muscle (LM) contraction, but circular muscle (CM) may also contribute to axial shortening because of its spiral morphology. The goal of our study was to show patterns of contraction of CM and LM layers during peristalsis and transient lower esophageal sphincter (LES) relaxation (TLESR). In rats, esophageal and LES morphology was assessed by histology and immunohistochemistry, and function with the use of piezo-electric crystals and manometry. Electrical stimulation of the vagus nerve was used to induce esophageal contractions. In 18 healthy subjects, manometry and high frequency intraluminal ultrasound imaging during swallow-induced esophageal contractions and TLESR were evaluated. CM and LM thicknesses were measured (40 swallows and 30 TLESRs) as markers of axial shortening, before and at peak contraction, as well as during TLESRs. Animal studies revealed muscular connections between the LM and CM layers of the LES but not in the esophagus. During vagal stimulated esophageal contraction there was relative movement between the LM and CM. Human studies show that LM-to-CM (LM/CM) thickness ratio at baseline was 1. At the peak of swallow-induced contraction LM/CM ratio decreased significantly (<1), whereas the reverse was the case during TLESR (>2). The pattern of contraction of CM and LM suggests sliding of the two muscles. Furthermore, the sliding patterns are in the opposite direction during peristalsis and TLESR.
Keywords: muscularis propria, gastroesophageal reflux, unequal shortening of muscle layers
the esophagus is a relatively straight tube with simple functions, to transfer swallowed contents either from the mouth to the stomach or from the stomach toward the mouth as happens during vomiting, belching, and reflux. Prior studies have shown two distinct motor patterns in the esophagus: peristalsis that transports the swallowed contents aborally and transient lower esophageal sphincter (LES) relaxation (TLESR) that allows gastric contents to move into the esophagus toward the mouth. Inner circular muscle (CM) and outer longitudinal muscle (LM) layers play a key role in both oral and aboral movements of the bolus. Studies show that during peristalsis CM and LM contract together cranial to the bolus (ascending contraction), to propel the bolus in the aboral direction, and they relax together around and caudal to the bolus (descending relaxation) (11), to receive the bolus. On the other hand, during TLESR, a unique LM contraction that starts in the distal esophagus and progresses in the cranial direction is observed (1, 15). There is no significant contraction of the CM during TLESR.
Axial stretch of esophagus in the oral direction activates neurologically mediated LES relaxation and possibly descending relaxation of the esophagus (7). Therefore, it is hypothesized that longitudinal muscle contraction related axial stretch is of fundamental importance in the descending relaxation of the peristaltic reflex. Axial esophageal shortening is generally thought to be caused by contraction of the LM layer. However, Miller and colleagues (3, 16) showed that CM contraction also contributes to axial esophageal shortening because of the spiral morphology of CM in the distal esophagus. Gilbert et al. (4) used diffusion tensor imaging and fiber tracking to show that CM fibers are arranged in spiral rather than circular fashion. Spiral angle of the CM increases from the proximal to distal esophagus. The latter results in greater axial shortening related to CM in the distal than in the proximal esophagus. Differential shortening of the two layers during peristalsis suggests that they must slide relative to each other. Because the pattern of contractions of two muscle layers during peristalsis and TLESR is different, one expects different sliding patterns during these two motor patterns; whether such is indeed the case is unknown. Therefore, the goal of our study was to document a different pattern of contraction of CM and LM during peristalsis and TLESR.
MATERIALS AND METHODS
Experiments were conducted in five rats and 18 healthy human subjects. Animal studies were performed in Sprague Dawley male rats, weighing 250–400 g. The animal safety committee of the San Diego Veterans Affairs Health Care System approved the study protocol. Rats were anesthetized using an intraperitoneal injection of 4 ml/kg of a stock solution containing ketamine (3.75 ml, 100 mg/ml), xylazine (0.4 ml, 100 mg/ml), and acepromazine (0.75 ml, 10 mg/ml), mixed with 15.1 ml distilled water. Vagus nerve was isolated in the neck and electrically stimulated (0.5, 1, 2, 3, 4, and 5 mA; pulse width 10 ms and pulse frequency 20 Hz). A midline laparotomy was performed, and two piezo-electric crystals, crystals 2 and 3, were anchored ∼5 mm apart in the axial direction to the LM layer of the esophageal wall (Fig. 1D). Through a vertical incision in the esophagus, CM layer was exposed and two more piezo-electric crystals—1 and 4, ∼3 mm axially separated—were anchored to the CM (Fig. 1D). Intraluminal esophageal pressure was measured with a 2.5 F solid-state pressure transducer. After physiological recording, the esophagus along with the stomach was harvested and fixed at its original length in the Formal Fixx for 4 h and then transferred to 75% alcohol and embedded in paraffin. Tissue samples were sectioned in 10 μm thickness. Sections were labeled with primary rabbit anti smooth muscle α-actin (abcam, ab5694; Cambridge, MA) and mouse fast myosin skeletal muscle heavy chain (abcam, ab51263; Cambridge, MA) antibodies, each at 1:500 concentrations. Omitting the primary antibodies during the staining process served as negative controls. Secondary antibodies used were goat anti-rabbit DyLightTM 488-conjugated and goat anti-mouse DyLightTM 549-conjugated IgG heavy and light chains, each at 1:500 concentration (Jackson Immuno Research Laboratories, West Grove, PA). Sections were mounted with medium containing DAPI and viewed with a Nikon Ti fluorescent microscope (Nikon, Melville, NY).
Fig. 1.
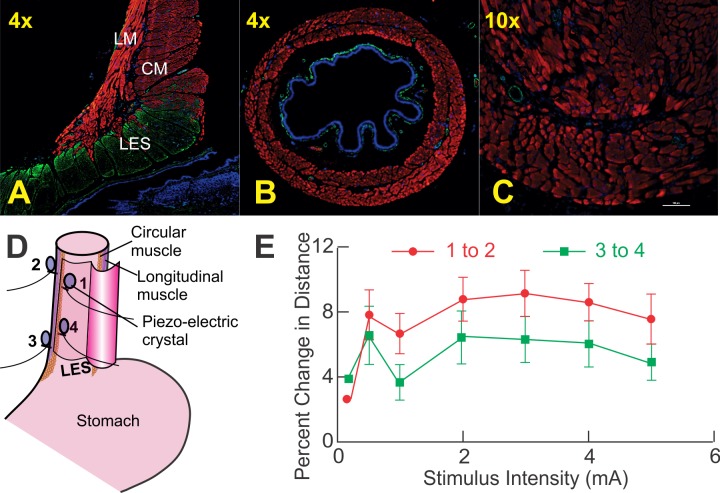
Data from rat studies. A: coronal section of rat esophagus and lower esophageal sphincter (LES). Note muscular connections between the longitudinal muscle (LM) layers in LES but not in esophagus. B and C: 4× and 10× magnification of the esophagus, respectively. Again, note there are no connections between the circular muscle (CM) and LM layers. Immunostaining with rabbit anti-smooth muscle α-actin (green), mouse fast myosin skeletal muscle heavy chain (red), and 4′,6-diamidino-2-phenylindole (DAPI) for nuclei (blue) is shown. In the esophagus, CM and LM fibers traverse in their own compartments without any crossing of fibers from 1 layer to the other. In the distal esophagus, note slips of LM are inserted between the bundles of the CM fibers of the lower esophageal sphincter. CM fibers of the LES become the inner or CM coat of the stomach. Red and green colors in these images represents skeletal and smooth muscles, respectively. D: a schematic of placement of the piezo-electric crystals on the CM and LM layers. E: percent change in distance between the pairs of crystals—1 and 2, and 3 and 4—placed on the 2 muscle layers during electrical stimulation induced esophageal contractions at different current intensities. The change in distance was smaller at a location close to the LES (P < 0.05).
For the human study, the protocol was approved by the University of California San Diego Institutional Review Board for the Protection of Humans, and each subject signed a written consent before enrollment in the study. Subjects fasted and stopped smoking for at least 6 h before the study. Eighteen healthy subjects with a mean age of 32 ± 12 years (SD; 9 males) with no prior history of gastrointestinal disease/surgery participated in the study. Esophageal pressures and high frequency intraluminal ultrasound (HFIUS) imaging of esophagus were performed simultaneously in the right lateral supine position with the head elevated to 30°. For 14 of the 18 subjects, we used data acquired from a previously published study in which pressures were recorded using a water perfused manometry system with a sleeve sensor that recorded LES pressure and 8 side holes that monitored pharyngeal, esophageal, and stomach pressure (4.5 cm catheter diameter) (1). Pressure data were acquired using an analog-to-digital converter, interfaced to a computer using Polygram 98 (Medtronic Synectics, Shoreview, MN) at a sampling rate of 16 Hz. In the remaining four subjects, a 13 F (4.3 mm), 36 channels, high resolution manometry system (Covedien-GIVEN, Duluth, Georgia) was used to record esophageal pressures. For ultrasound imaging, an HFIUS catheter (1.2 mm, 30 MHz; Boston Scientific, Sunnyvale, CA) interfaced to HP Sonos 100 ultrasound machine (Hewlett Packard Sonos Intravascular, Andover, MA) was used. The ultrasound (US) images were acquired on a super video home system videotape (SVHS), and a time encoder (Thalamar Electronics, Ann Arbor, MI) was used to temporally align video images and physiologic signals with an accuracy of one hundredth of a second. Manometry catheter and HFIUS catheter were taped together to acquire US images and pressure recordings at 6 and 12 cm above LES.
Liquid lidocaine spray (2% lidocaine topical solution, USP) and viscous lidocaine (1% lidocaine hydrochloride topical solution, USP) were orally and nasally administered as local anesthesia before the placement of the catheter assembly through the nose into the esophagus. After placement of the catheter assembly in the desired location, it was taped to the nose. Swallows were performed using 5 ml water, at least 30 s apart. The US catheter probe could be moved in its sheath independent of the manometery catheter assembly. After recording 5 swallows at the 6-cm location, US transducer was repositioned 12 cm above LES and an additional 5 swallows with 5 ml water were recorded. Subjects then ate a standardized mixed liquid/solid meal (1,000 kcal). The US transducer was positioned 6 cm above LES for the first hour of the recording period and repositioned at 12 cm above LES for the second postprandial hour.
Image Analysis
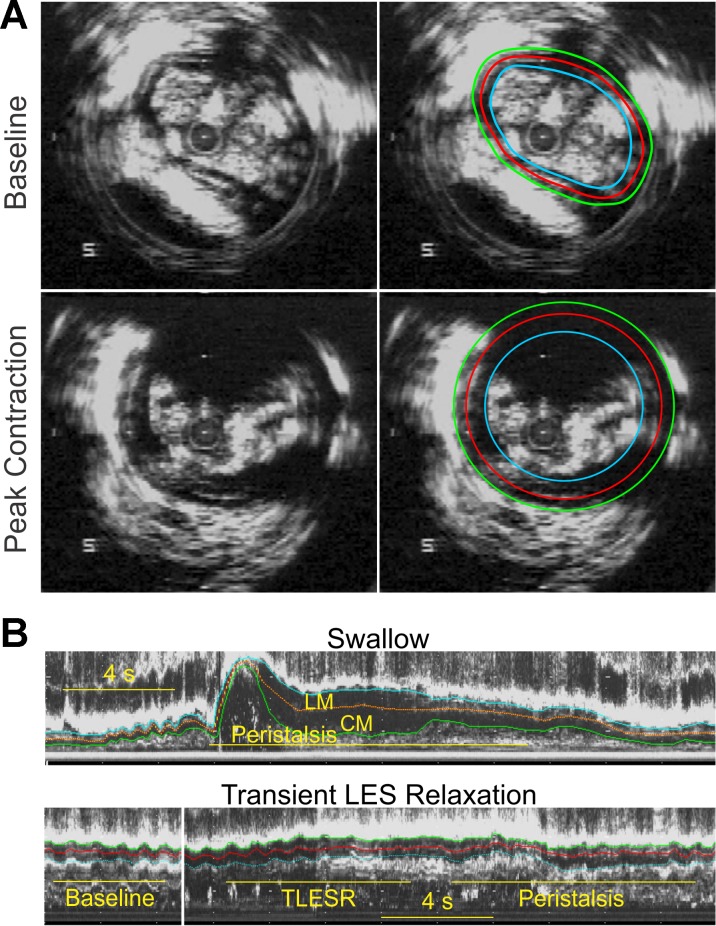
Analyzable analog ultrasound images were digitized using a video frame grabber interfaced to a personal computer and acquired using Adobe Premier 6.0 (Adobe Systems, Mountain View, CA) as an AVI file, which was then converted to BMP tomographic or B-mode images. BMP US images were then converted to 16 equally spaced, M-mode US images (every 22.5° apart) using custom software. An optimal quality M-mode US image orthogonal to the esophageal wall was selected for the data analysis. In the selected M-mode image, edges representing the inner edge of circular muscle layer, the outer edge of longitudinal muscle layer, and inter-muscular septum between them were manually drawn (Fig. 2B) using Sigma Scan Pro 5 (Jandel Scientific, San Rafael, CA). Distance between the outer LM edge and septum represents the LM thickness, and between the septum and inner CM edge represents the CM thickness. Muscle thicknesses were corrected by the magnification factor to estimate the thickness in millimeters. B-mode images before (baseline) and at the peak of swallow-induced contractions (peak) were also analyzed to measure CM and LM cross-sectional area (Fig. 2A).
Fig. 2.
A: B-mode ultrasound (US) image of the esophagus and manually drawn markings to measure cross-sectional area (CSA) of the CM and LM layers. B: esophageal M-mode ultrasound image 6 cm above the LES with manually drawn markings for the CM, LM, and septum during peristalsis and transient LES relaxation (TLESR).
Muscle Cross-sectional Area and Thickness Measurement
B-mode (tomographic) US images were used to measure CM and LM cross-sectional area (CSA) and muscle thickness during 20 swallow-induced contractions in 5 subjects (Fig. 2A). In addition, muscle thickness of each layer during swallow-induced contraction was also measured from the M-mode US images for 30 swallows at 6 cm above the LES and 16 swallows at 12 cm above the LES. CM and LM thicknesses were averaged over a 5-s period before swallow (baseline thickness), and changes relative to baseline values were calculated at the peak of swallow-induced contraction. Muscle thickness during TLESR was measured from the M-mode US images captured at 6 cm and 12 cm above the LES. Pressure recordings were carefully screened to identify TLESRs using published criteria (5). Peak LM and CM thickness during the entire TLESR period was compared with the 5-s average baseline thickness.
These parameters were calculated from the above measurements: 1) For swallow and TLESR, the ratio of change in LM and CM thicknesses at peak of contraction relative to the baseline thickness (normalized LM and CM thickness) and 2) During TLESR, LM-to-CM (LM/CM) ratio at baseline and at the instant of maximal change in the muscle thickness.
Statistical Analysis
Data are presented as means ± SE except where otherwise stated. Mean values for each subject were calculated and used to estimate the overall mean. Unpaired Student's t-test with unequal variance was used to estimate statistical significance between groups. A P value less than 0.05 was considered statistically significant.
RESULTS
Animal Studies
Figure 1, A and B, shows the esophageal histological cross-sectional anatomy 2 cm above LES, and Fig. 1C shows a mid-coronal section of the esophagus and LES. Red and green color in these images represents skeletal and smooth muscles, respectively; CM and LM fibers traverse in their own compartments without crossing of fibers from one layer to the other in the esophagus. There is a potential space between the two layers that is occupied by myenteric plexus and loose connective tissue. On the other hand, in the LES region, which is identifiable by a greater thickness of the CM and green color (smooth muscle), the LM fibers (red color) are inserted in between the bundles of circular muscles. In other words, there are muscular connections between the LM and CM in the LES region but not in the esophagus. This pattern of morphology was seen in all animals studied.
Vagal stimulation induced contractions of the LM and CM at all intensities and reduced distance between the crystals anchored to circular as well as longitudinal muscle layers. With esophageal contraction, there was increase in the distance or axial separation of crystal distance between 1 and 2 as well as 3 and 4 (Fig. 1E). If the two layers of the esophagus moved together the distance between the two points (1 and 2, 3 and 4) of LM and CM would not change. To the contrary, percent change in distance with esophageal contractions, between two crystal anchored on the LM and CM, was different. These data prove that the two layers do not move together in the axial direction during esophageal contractions. Furthermore, axial movement between the two layers is smaller close to the LES compared with the proximal esophagus because the two layers are anchored to each other in the LES.
Human Studies
Changes in muscle CSA and thickness during swallow-induced contractions.
Muscle CSA at baseline and at the peak of swallow-induced contraction were 17.5 ± 1 mm2 and 56.1 ± 1.6 mm2 for CM (a 3.2-fold increase) and 17.6 ± 1 mm2 to 38.9 ± 1.6 mm2 for LM (2.2-fold increase). Muscle thickness was also measured directly from B-mode US images at baseline and at peak contraction. CM thickness increased from 0.70 ± 0.01 mm to 1.86 ± 0.04 mm for the CM (2.7-fold increase) and from 0.66 ± 0.02 to 1.00 ± 0.04 mm (a 1.5-fold increase) for the LM. These data prove that muscle thickness underestimates rather than overestimates axial shortening of the muscle layers.
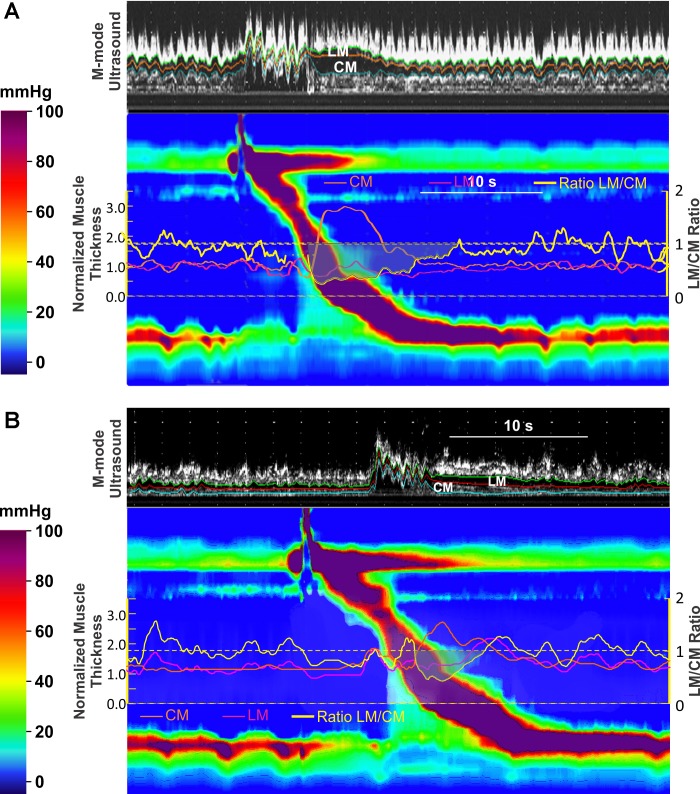
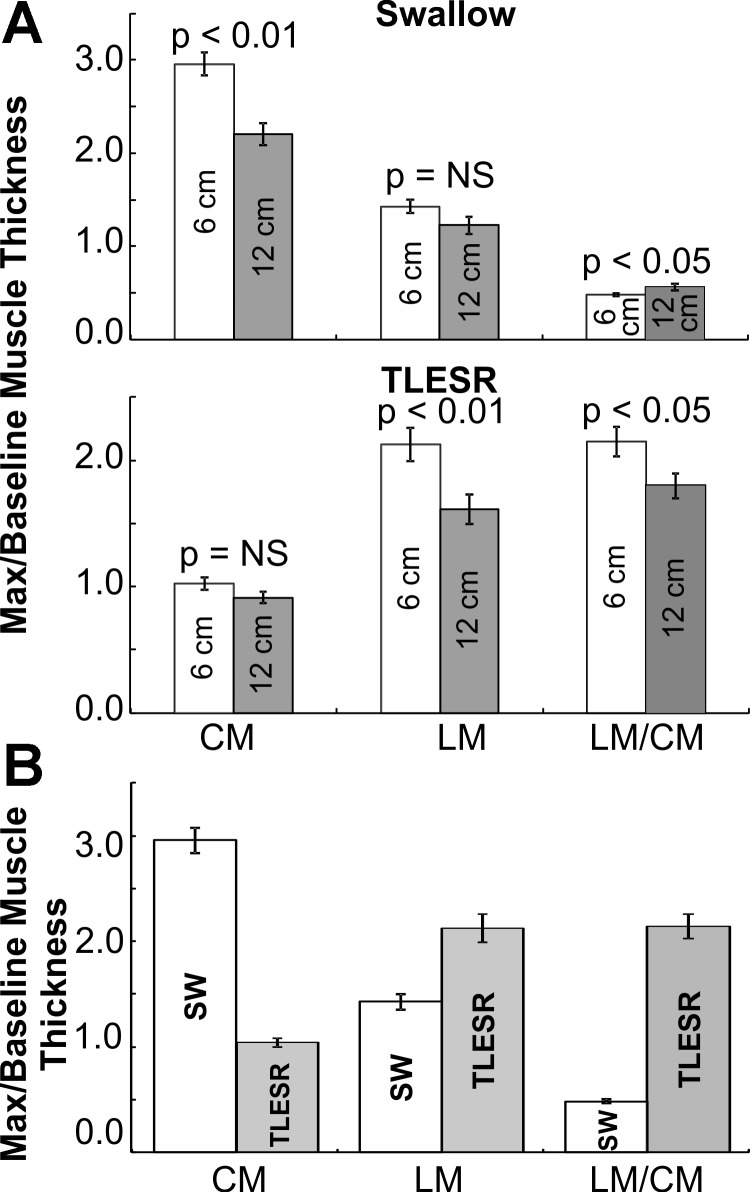
The temporal relationship between CM and LM contraction and changes in the muscle thickness were determined during 30 swallow-induced contractions 6 cm above the LES in 8 subjects and 16 contractions 12 cm above the LES from 6 subjects. Increase in CM and LM thickness started before the onset of pressure wave at each site. Peak pressure and peak muscle thickness were temporally aligned, occurring at the same time, suggesting synchronous contractions of the two muscle layers. At 6 cm above LES, at the peak of swallow-induced contraction, the CM thickness increased 3.0 ± 0.1 times of the baseline value. On the other hand, the increase in LM thickness at the peak of swallow-induced contraction was much smaller, only 1.4 ± 0.1 times. At 12 cm above LES, the increase in CM thickness with swallow-induced contraction was significantly smaller than that at the 6 cm site (2.2 ± 0.1 times); but there was no difference in the increase in the thickness of LM layer between 6 and 12 cm sites. The ratio of LM to CM thickness was less than 1 at both 6 and 12 cm locations. Change in muscle thickness and the ratio (LM/CM) are shown in Table 1 and Fig. 3, A and B.
Table 1.
Mean (± SE) values for muscle thickness during swallow induced contraction and transient relaxation at two levels above LES
| 6 cm Above LES |
12 cm Above LES |
|||||||||||
|---|---|---|---|---|---|---|---|---|---|---|---|---|
| CM |
LM |
CM |
LM |
|||||||||
| B | P | P/B | B | P | P/B | B | P | P/B | B | P | P/B | |
| Swallow | 0.7 ± 0.0 | 2.0 ± 0.1 | 3.0 ± 0.1 | 0.7 ± 0.0 | 0.9 ± 0.1 | 1.4 ± 0.1 | 0.7 ± 0.0 | 1.5 ± 0.1 | 2.2 ± 0.1# | 0.7 ± 0.0 | 0.8 ± 0.1 | 1.2 ± 0.1 |
| TLESR | 0.7 ± 0.0 | 0.8 ± 0.0* | 1.0 ± 0.1 | 0.7 ± 0.0 | 1.4 ± 0.1* | 2.1 ± 0.1 | 0.7 ± 0.0 | 0.6 ± 0.1* | 0.9 ± 0.1 | 0.7 ± 0.0 | 1.0 ± 0.1* | 1.5 ± 0.1# |
Values are means ± SE. LES, lower esophageal sphincter; CM, circular muscle; LM, longitudinal muscle; B, baseline muscle thickness; P, peak muscle thickness; P/B, ratio of muscle thickness.
P < 0.05 for swallow vs. transient lower esophageal sphincter relaxation (TLESR);
P < 0.05 for 6 vs. 12 cm.
Fig. 3.
A and B: M-mode ultrasound and high resolution manometry (HRM) plots during swallow at 6 cm (A) and at 12 cm (B) above LES. Superimposed on the HRM plots are changes (ratio to baseline muscle thickness) in CM (orange) and LM (pink), and ratio of the LM to CM change is also shown (yellow). Note that the increase in CM thickness during peristaltic contraction is significantly greater than that of the LM.
Changes in muscle thickness during TLESR at 6 and 12 cm above LES.
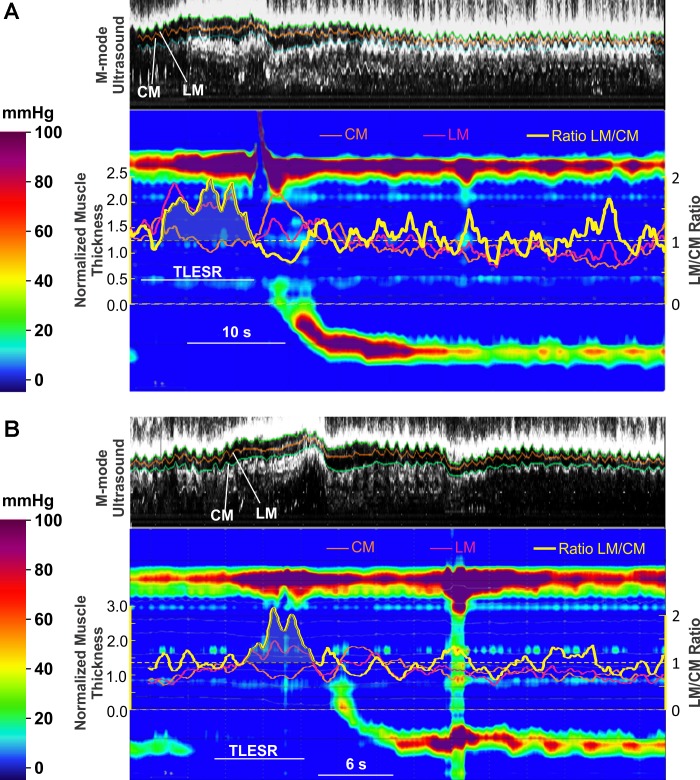
Twenty TLESRs were analyzed at 6 cm above the LES (10 subjects) and 10 TLESRs at 12 cm above the LES (5 subjects). At 6 cm above the LES, LM thickness increased 2.1 ± 0.1 times compared with the baseline. On the other hand, there was no increase in the CM thickness, 1.0 ± 0.05 compared with baseline. At 12 cm above the LES, the increase in LM thickness was smaller (1.5 ± 0.14 times) than at 6-cm site and CM thickness remained similar to baseline. The LM/CM thickness ratio increased during TLESR at the 6- and 12-cm locations; it was greater at 6 cm than 12 cm above the LES (Fig. 4, A and B, and Table 1).
Fig. 4.
A and B: examples of transient LES relaxations. M-mode ultrasound and HRM plots during transient LES relaxation at 6 cm above the LES are shown. Superimposed on HRM plots are changes (ratio to baseline thickness) in CM (orange) and LM (pink), and ratio of the LM to CM change is also shown (yellow). Note the increase in LM thickness is significantly greater than that of the CM during TLESR.
Comparison between changes in muscle thickness during swallow-induced contraction and TLESR.
Changes in CM and LM thickness for swallow-induced contraction and TLESR at 6 and 12 cm above the LES are shown in Fig. 5, A and B, and Table 1. Increase in LM thickness was greater during TLESR as compared with swallow-induced contraction at both 6 and 12 cm above the LES (P < 0.05). In contrast, increase in CM thickness was greater during swallow-induced contraction compared with the increase in LM thickness (P < 0.0001). These differences were present at both 6 and 12 cm above the LES (Table 1).
Fig. 5.
A: plot of means (±SE) CM and LM thickness change [ratio of maximal (max) thickness to the baseline thickness] and the ratio of mean LM to CM during peak swallow-induced contraction (SW; top) and TLESR (bottom) at 6 cm (white bars) and 12 cm (gray bars) above LES. B: plot of means (±SE) CM and LM thickness change (ratio of maximal to baseline thickness) and the ratio of LM to CM during peak swallow-induced contraction (white bars) and TLESR (gray bars). NS, not significant.
DISCUSSION
In summary, our data reveal the following information. First, animal studies show that there are muscular connections between the LM and CM in the LES but not in the body of the esophagus. It is interesting that the drawing by Netter (13) of the human esophagus and LES shows muscular connections between the LM and CM in the LES but not in the esophagus, similar to our finding in rats. Second, during vagus nerve mediated esophageal contraction in the rats, LM and CM slide relative to each other. Third, human studies prove that axial shortening of the CM is greater than LM in the distal esophagus during peristaltic contraction. On the other hand, during TLESR, axial shortening of the LM is greater than that of the CM in the distal esophagus. Fourth, axial shortening of CM and LM in the distal esophagus (6 cm) is greater than that in the proximal esophagus (12 cm) during swallow-induced contraction as well as TLESR. Fifth, relative axial shortening of the CM and LM during peristaltic contraction and TLESR suggests that the two muscle layers slide in different directions relative to each other during these two esophageal motor patterns (Fig. 6).
Fig. 6.
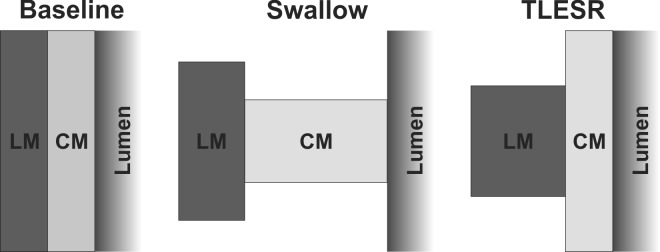
Schematic of axial LM shortening and CM contraction during swallow-induced peristaltic contraction and TLESR. At baseline (left) the thickness of CM and LM is the same, and during swallow there is a greater shortening of CM than LM (middle). On the other hand, during TLESR, LM shortening is greater than CM (right). Differential axial shortening of the 2 layers suggests a sliding of the 2 layers in opposite directions during peristaltic contraction and TLESR.
We measured muscle thickness as a marker of esophageal axial shortening. Increase in muscle CSA measured from the B-mode images rather than muscle thickness is a precise marker of the axial shortening related to CM and LM contractions (12, 14). With swallow-induced contraction, quality of US images allows for demarcation of inner CM, inter-muscular septum, and outer LM layer edges. Therefore, at the peak of swallow-induced contraction, US images lend themselves for CSA measurements of the CM and LM. However, the entire circumference of esophagus is not visualized during TLESR because of partial dropout in the US images due to presence of air and other luminal contents. Therefore, during TLESR, it was only possible to measure muscle thickness in one or more of the M-mode images around the esophagus and not the entire muscle cross section. Studies by Miller et al. (10, 14) and our validation data in this article and previous work show the adequacy of muscle thickness as a marker of the muscle CSA during swallow-induced esophageal contraction. During TLESR, when there is reflux-related esophageal distension, muscle thickness underestimates rather than overestimates axial shortening because passive distension related to luminal expansion will be expected to reduce the thickness of CM and LM layers, and the reduction should be of equal magnitude in two muscle layers. On the other hand, we did not observe a decrease in the muscle thickness during TLESR. We, therefore, feel justified in measuring muscle thickness as a surrogate of muscle CSA for quantitating esophageal axial shortening during peristalsis and TLESR.
Miller et al. (10) were the first to study esophageal contraction using HFIUS. They observed changes in CM and LM thickness during peristaltic esophageal contraction. Changes in the thickness of two muscle layers parallel each other and occur in close temporal correlation with the changes in pressure recorded by manometry. Similar to peristaltic contraction, balloon distension-induced esophageal contraction, proximal to the distension site, is also associated with an increase in LM and CM thicknesses (17). These studies were interpreted as follows. The change in thickness of individual muscle layer represents contraction of each muscle layer separately. Nicosia et al. (14) suggested that the increase in muscle thickness of the two muscle layers represents esophageal axial shortening. Changes in muscle thickness with US imaging and its relationship to changes in intraluminal pressure have also been confirmed in an animal study (2). Because the LM layer was assumed to be directed in the long axis of the esophagus, it was thought to cause axial shortening of the esophagus, resulting in increase in the muscle CSA of two layers, which assumes that the two layers are anchored to each other and if the LM contracts CM will move passively with it. Dai et al. (3) observed that the change in CM thickness during peristaltic contraction was significantly greater than LM in the distal esophagus, which was explained on the basis of spiral morphology of CM (16). Because the spiral angle of CM is greater in the distal esophagus than in the proximal esophagus (measured only up to 10 cm), axial shortening due to CM contraction is greater in the distal than the proximal esophagus (3). Our findings are consistent with those of Miller et al. (10) that axial shortening due to CM is greater than LM during peristalsis, and it is greater in the distal rather than the proximal esophagus. In addition, we report for the first time the axial shortening of both LM and CM during TLESR and swallow-induced peristalsis. Our data show that the patterns of axial shortening related to LM and CM contraction are different during the two major motor esophageal patterns, i.e., peristalsis and TLESR. In TLESR, there is minimal to no axial shortening related to CM, which is consistent with no CM contraction during TLESR. It appears that the entire axial shortening during TLESR is related to the LM contraction. On the other hand, axial shortening during peristalsis, at least in the distal esophagus, is contributed by axial shortening of LM and CM. Our findings also show that the LM contraction during TLESR is significantly stronger than during peristaltic contraction, which is likely the reason for greater overall axial shortening of the esophagus during TLESR than peristalsis.
If CM and LM layers were tightly anchored/attached to each other they would move together, and one would expect identical axial shortening of the CM and LM during different motor patterns. Contrary to the above, findings of Dai et al. (3) and our data show that this is not the case. Differential axial shortening of the CM and LM during peristalsis and TLESR indicates independent movement of the two layers, i.e., the two muscle layers slide relative to each other. Not only do they slide relative to each other, but they move in opposite directions during the two major esophageal motor patterns. CM shortening is greater than LM in the distal esophagus during peristaltic contraction, and the reverse is the case during TLESR. What is the significance of sliding between CM and LM? It is possible that sliding between the two muscle layers may cause activation of neurons located in the myenteric plexus to modulate contraction and relaxation of the two muscles layers, a hypothesis that requires careful investigation.
Our earlier work on the relationship between CM and LM contraction patterns in nutcracker esophagus (8), eosinophilic esophagitis (9), and achalasia esophagus (6) revealed a disassociation between axial shortening of the esophagus and intraluminal pressure. In these studies, we measured combined CM and LM thickness as a marker of axial shortening and interpreted it as a marker of LM contraction. The increase in intraluminal pressure was interpreted as a marker of CM contraction in these studies. Based on the findings of the current study, axial shortening of the LM only should be interpreted as a marker of LM contraction because increase in the CM thickness can be due to the contraction of CM because of its spiral morphology and due to the lumen obliteration. It will be interesting to see if there are differences in axial shortening related to CM and LM in various esophageal motor disorders.
In summary, based on our work and that of Miller et al. (3, 16) it is clear that the two muscle layers generate two unique axial shortening patterns. We propose that these patterns may activate mechanosensitive inhibitory and excitatory motor neurons of the myenteric plexus to modulate relaxation and contraction of the two muscle layers. Future studies should use axial shortening of the LM layer only and not the two layers together as a marker of LM contraction.
GRANTS
This work was supported in part by The National Institute of Diabetes and Digestive and Kidney Diseases (NIDDK) Grant DK-060733 and the Inje Research and Scholarship Foundation in 2012.
DISCLOSURES
No conflicts of interest, financial or otherwise, are declared by the author(s).
AUTHOR CONTRIBUTIONS
Author contributions: N.P., Y.J., T.H.K., and M.L. performed experiments; N.P. and Y.J. analyzed data; N.P., R.K.M., and V.B. interpreted results of experiments; N.P. and V.B. prepared figures; N.P. drafted manuscript; N.P., R.K.M., and V.B. edited and revised manuscript; R.K.M. and V.B. conception and design of research; V.B. approved final version of manuscript.
REFERENCES
- 1.Babaei A, Bhargava V, Korsapati H, Zheng WH, Mittal RK. A unique longitudinal muscle contraction pattern associated with transient lower esophageal sphincter relaxation. Gastroenterology 134: 1322–1331, 2008. [DOI] [PubMed] [Google Scholar]
- 2.Boesmans W, Vanden Berghe P, Farre R, Sifrim D. Oesophageal shortening: in vivo validation of high-frequency ultrasound measurements of oesophageal muscle wall thickness. Gut 59: 433–440, 2010. [DOI] [PubMed] [Google Scholar]
- 3.Dai Q, Korimilli A, Thangada VK, Chung CY, Parkman H, Brasseur J, Miller LS. Muscle shortening along the normal esophagus during swallowing. Dig Dis Sci 51: 105–109, 2006. [DOI] [PubMed] [Google Scholar]
- 4.Gilbert RJ, Gaige TA, Wang R, Benner T, Dai G, Glickman JN, Wedeen VJ. Resolving the three-dimensional myoarchitecture of bovine esophageal wall with diffusion spectrum imaging and tractography. Cell Tissue Res 332: 461–468, 2008. [DOI] [PubMed] [Google Scholar]
- 5.Holloway RH, Penagini R, Ireland AC. Criteria for objective definition of transient lower esophageal sphincter relaxation. Am J Physiol Gastrointest Liver Physiol 268: G128–G133, 1995. [DOI] [PubMed] [Google Scholar]
- 6.Hong SJ, Bhargava V, Jiang Y, Denboer D, Mittal RK. A unique esophageal motor pattern that involves longitudinal muscles is responsible for emptying in achalasia esophagus. Gastroenterology 139: 102–111, 2010. [DOI] [PMC free article] [PubMed] [Google Scholar]
- 7.Jiang Y, Bhargava V, Mittal RK. Mechanism of stretch-activated excitatory and inhibitory responses in the lower esophageal sphincter. Am J Physiol Gastrointest Liver Physiol 297: G397–G405, 2009. [DOI] [PMC free article] [PubMed] [Google Scholar]
- 8.Jung HY, Puckett JL, Bhalla V, Rojas-Feria M, Bhargava V, Liu J, Mittal RK. Asynchrony between the circular and the longitudinal muscle contraction in patients with nutcracker esophagus. Gastroenterology 128: 1179–1186, 2005. [DOI] [PubMed] [Google Scholar]
- 9.Korsapati H, Babaei A, Bhargava V, Dohil R, Quin A, Mittal RK. Dysfunction of the longitudinal muscles of the oesophagus in eosinophilic oesophagitis. Gut 58: 1056–1062, 2009. [DOI] [PubMed] [Google Scholar]
- 10.Miller LS, Liu JB, Colizzo FP, Ter H, Marzano J, Barbarevech C, Helwig K, Leung L, Goldberg BB, Hedwig K. Correlation of high-frequency esophageal ultrasonography and manometry in the study of esophageal motility. Gastroenterology 109: 832–837, 1995. [DOI] [PubMed] [Google Scholar]
- 11.Mittal RK, Liu J, Puckett JL, Bhalla V, Bhargava V, Tipnis N, Kassab G. Sensory and motor function of the esophagus: lessons from ultrasound imaging. Gastroenterology 128: 487–497, 2005. [DOI] [PubMed] [Google Scholar]
- 12.Mittal RK, Padda B, Bhalla V, Bhargava V, Liu J. Synchrony between circular and longitudinal muscle contractions during peristalsis in normal subjects. Am J Physiol Gastrointest Liver Physiol 290: G431–G438, 2006. [DOI] [PubMed] [Google Scholar]
- 13.Netter FH. Atlas of Human Anatomy, Student Edition. Elsevier Health Sciences, 2002. [Google Scholar]
- 14.Nicosia MA, Brasseur JG, Liu JB, Miller LS. Local longitudinal muscle shortening of the human esophagus from high-frequency ultrasonography. Am J Physiol Gastrointest Liver Physiol 281: G1022–G1033, 2001. [DOI] [PubMed] [Google Scholar]
- 15.Pandolfino JE, Zhang QG, Ghosh SK, Han A, Boniquit C, Kahrilas PJ. Transient lower esophageal sphincter relaxations and reflux: mechanistic analysis using concurrent fluoroscopy and high-resolution manometry. Gastroenterology 131: 1725–1733, 2006. [DOI] [PubMed] [Google Scholar]
- 16.Vegesna AK, Chuang KY, Besetty R, Phillips SJ, Braverman AS, Barbe MF, Ruggieri MR, Miller LS. Circular smooth muscle contributes to esophageal shortening during peristalsis. World J Gastroenterol 18: 4317–4322, 2012. [DOI] [PMC free article] [PubMed] [Google Scholar]
- 17.Yamamoto Y, Liu J, Smith TK, Mittal RK. Distension-related responses in circular and longitudinal muscle of the human esophagus: an ultrasonographic study. Am J Physiol Gastrointest Liver Physiol 275: G805–G811, 1998. [DOI] [PubMed] [Google Scholar]


