

Abstract
Background & objectives:
Basti (medicated enema) is a popular Ayurvedic intervention recommended for obesity. However, there are no data to show whether any physiological or biochemical changes occur following this treatment. This study was conducted to identify the immunological and metabolic changes in obese individuals after a therapeutic course of Basti.
Methods:
Thirty two obese individuals (18 and 60 yr) with a body mass index (BMI) ≥30 kg/m2 who received a therapeutic course of 16 enemas (Basti) followed by a specific diet and lifestyle regimen for a period of 32 days as their treatment for obesity, were enrolled in the study. Clinical examination, measurement of immune and metabolic markers were done before (S1), immediately after (S2) and 90 days after the completion of therapy (S3).
Results:
A significant reduction (P<0.001) in weight, BMI, upper arm and abdominal circumference was seen at S3, along with a decrease in serum interferon (IFN)-γ (P<0.02), interleukin (IL)-6 (P<0.02) and ferritin (P<0.05) and increase in IgM levels (P<0.02). Peripheral blood lymphocytes (PBLs) stimulated with anti-CD3 monoclonal antibodies showed significant increase in reactive oxygen species (ROS) generation and calcium flux after Basti. All organ function tests revealed no changes.
Interpretation & conclusions:
Our study documents that a therapeutic course of Basti modulates immune responses by regulating pro-inflammatory cytokines, immunoglobulins and functional properties of T-cells. These changes are associated with a reduction in the body weight which is maintained even after three months of treatment. The study also documents the safety of Basti procedure.
Keywords: Basti, immunological markers, metabolic markers, obesity, Panchakarma
Obesity is defined by the World Health Organization (WHO)1 as a body mass index (BMI) equal to or more than 30 kg/m2. It is associated with an elevated risk of cardiovascular disease2,3 and type 2 diabetes due to co-existing metabolic abnormalities including impaired fasting glucose, hyperinsulinaemia and dyslipidaemia (characterized by low level of HDL and high plasma triglycerides)4. Increasing adiposity is also associated with low micronutrient levels due to inadequate nutrient intake and/or alterations in nutrient metabolism5. One of the hallmarks of obesity is an increase in circulating markers of oxidative stress and low grade inflammation characterized by increased levels of circulating C-reactive protein (CRP) and/or other inflammatory cytokines such as tumour necrosis factor alpha (TNF-α) and interleukin-6 (IL-6)6,7. Adipocytokines such as TNF-α or IL-6 are also reported to be elevated with increasing adiposity8,9 and are closely correlated with CRP, a known inflammatory marker10.
Apart from the definite benefits from change in lifestyle, diet and regular exercise, various pharmacological interventions have been investigated with limited success. For example, orlistat which is approved for use in obesity11 leads to a modest weight loss of 2.9 kg after 1 to 4 yr and its use is associated with many gastrointestinal side effects12. For the extremely obese patient with established complications, surgery may be the most appropriate intervention and may be lifesaving13. However, due to its cost and the risk of complications, the search is still on for other effective and safe treatments. Alternative therapies are also used widely without the necessary evidence of benefit or safety.
Ayurveda, the Indian traditional medicine system has described Basti (medicated enema) as an intervention for many disorders especially lifestyle disorders including obesity14. Ayurvedic texts describe the indications and contraindications for Basti therapy15. However, no study has yet attempted to document its safety and whether this intervention has any effect in obese individuals. In absence of data to show whether any physiological or biochemical changes occur following this treatment, we conducted this study to assess the immunological and metabolic variables in obese individuals after a therapeutic course of Basti.
Material & Methods
Thirty two consecutive patients attending the Internal Medicine Out Patient Department (OPD) of MA Podar Ayurvedic Hospital, Mumbai, India, for treatment of obesity who were prescribed Basti treatment as per Ayurvedic criteria16, were invited to participate in this study. Patients in the age groups of 18 to 60 yr with a BMI ≥ 30 kg/m2 and waist-hip ratio ≥ 1.0 in men and ≥ 0.9 in women were invited to participate in the study after obtaining their written informed consent. Acutely ill patients with severe cardiac, respiratory, hepatic and renal dysfunction and pregnant or lactating women were excluded from the study. The study was carried out during the period from August 2007 to December 2010.
As this was a hypothesis generating proof of concept study where we wished to study whether any changes occurred in metabolic and immune parameters in patients who were receiving Basti as therapy for obesity, a sample size of at least completed 30 patients was considered adequate for analysis.
Following written informed consent to participate, a detailed clinical history was taken from each individual and relevant physical examination including recording of weight and measurement of anthropometric data like waist-hip ratio, upper arm circumference and abdominal circumference was carried out. Blood sample (45 ml) was collected aseptically from the ante-cubital vein and processed for measurement of various metabolic and immunological parameters. The study protocol was approved by the Institutional Ethics Committee of MA Podar Ayurvedic Hospital, Mumbai.
Samples were coded at the clinical site and dispatched to the laboratory. After collection of blood sample at baseline (S1), the prescribed therapeutic course of 16 Bastis in a regular pattern as described in Charak Samhita (known as kala basti15 ) was initiated.
On day 1, Anuvasan Basti (oil enema) with sesame oil of 240 ml was administered through the anal canal with the help of syringe and a rubber catheter. The next day Asthapana Basti (enema with decoction) consisting of til tail 120 ml, Triphala kwatha (decoction of Terminalia belerica, Terminalia chebula & Phyllanthus emblica)-700 ml, cow's urine -150 ml, honey 10 g and Black salt 10 g was administered. This course of alternate Anuvasana and Asthapana Basti was administered six times and then Anuvasan Basti four times on consecutive days. During the course, each participant was observed for symptoms of proper, inadequate or over effects of Anuvasana Basti and Asthapana Basti daily.
After completion of this course of 16 days, the participants were advised a diet of food items that are easy to digest like khichadi, moong dal, roti and requested to avoid fried and carbohydrate rich foods, cold drinks, etc. during the course of Basti. They were also asked to alter their lifestyle regimen (e.g. to avoid sitting and standing for the prolonged period, excessive/loud speaking, strenuous travelling/walking for long distance, day time sleep, suppression of natural urges, sex, overexposure to breeze, sunlight, smoke, dust, use of pillow of unsuitable thickness, etc.) for a period of 32 days as per the recommendations of Ayurveda15. At the end of this period the course of Basti was considered complete. Clinical examination and blood investigations were repeated (S2) at this point as in the baseline visit.
The final blood sample (S3) was collected 90 days after S2 along with clinical examination to assess whether the effect of Basti was maintained. During this period, no dietary or lifestyle modifications or medications for weight control were recommended. Thus, the participant was under observation for a total of 138 days after being recruited in the study. The day Sample 1 (S1) was collected was designated as day 0, S2 was collected on day 48 (16 Basti days and 32 days of lifestyle and diet restrictions) and S3 on day 138. Anthropometric parameters such as weight, BMI, waist- hip ratio, upper arm and abdomen circumference were measured at the time of S1, S2 and S3 collections.
Isolation of peripheral blood lymphocytes (PBLs) was done from the heparinized peripheral venous blood by Ficoll-Hypaque (Sigma-Aldrich, USA) centrifugation method17.
Immunophenotyping of peripheral blood lymphocytes (PBLs): PBLs were incubated with phycoerythrin (PE) labelled mouse anti-human monoclonal antibodies (MAb) targeted against CD3, CD4, CD8, CD14, CD19, CD56, CD80, CD86, CD209, CD11c, αβ-T cell receptor (TCR) and γδ-TCR (BD Pharmingen, USA) for surface staining as per manufacturer's instructions. Activation markers were assessed by using dual colour flow cytometry. PBLs were stained with fluorochrome conjugated monoclonal antibodies against activation markers such as fluorescein 5-isothiocyanate (FITC) conjugated CD25, CD69, CD71 and PE-conjugated HLA-DR (BD Pharmingen, USA) and further incubated with FITC or PE conjugated mouse anti-human monoclonal antibody targeted against CD3. Appropriate isotype controls were used in all experiments. PBLs were acquired on FACSCalibur flow cytometer (Becton Dickinson, USA). The data were analyzed with CellQuest software (Becton Dickinson, USA).
Estimation of intracellular calcium release: PBLs (1x10⁶/ml 0.01M PBS) were loaded with 5 µM Fluo-3-AM for 30 min at 37°C. One µg of anti-CD3 MAb was added as stimulant and fluorescence intensity was measured immediately on the FACSCalibur flow cytometer for the determination intracellular calcium release at different time points as previously described18.
Measurement of intracellular reactive oxygen species in lymphocytes: Reactive oxygen species (ROS) level in PBL was measured using 2’, 7’ dichlorofluorescein diacetate (DCFH-DA) dye (Sigma, USA). PBLs were loaded with 4 μM dye and incubated for 30 min at 37°C. Anti-CD3 MAb (1 μg) was added as stimulant and increase in mean fluorescence intensity was measured from 0 to 45 min, as described earlier19. Analysis was performed using Cell Quest software and results were expressed as mean fluorescence intensity (MFI).
Lymphocyte turnover by Annexin FITC staining: PBLs were incubated with PE labelled mouse anti-human monoclonal antibodies targeted against CD3 and CD19 (BD Pharmingen, USA) for surface staining. Lymphocyte turnover (apoptosis) was further monitored by Annexin V FITC (BD Pharmingen, USA) staining method as per manufacturer's guidelines and the data analyzed using the Cell Quest software.
Lymphocyte-proliferation assay: Proliferative responses in PBLs were analyzed using tritiated thymidine incorporation assay, according to standard protocol20. Anti-CD3 MAb (1µg) was used as a stimulant. Tritiated thymidine incorporation was measured in a liquid beta scintillation counter (Model 1900, Packard, USA) as counts per minute (cpm). Stimulation index (S.I.) was calculated as the ratio of mean cpm of cultures stimulated with anti-CD3 MAb and unstimulated cultures.
Cytokine and immunoglobulin ELISA: PBLs (1.5x10⁵/200 µl cRPMI/well) were stimulated with 1 µg anti-CD3 MAb for 48 h at 37°C. Cell-free supernatants were collected and analyzed for secreted cytokines interferon gamma (IFN-γ), interleukin (IL)-10, IL-4, IL-8, TNF-α, IL-6 and IL-1α using Opt-EIA sandwich ELISA kit (BD, Biosciences, USA) as per the manufacturer's instructions. Serum samples were also analyzed for the above mentioned cytokines using the same kits.
Immunoglobulins, IgG and IgM levels in serum samples from obese individuals were measured using the IgG and IgM detection kit (Bethyl Laboratories Inc., Montgomery, TX, USA) as per the manufacturer's recommendations.
Cytotoxicity assay: The cytotoxicity of lymphocytes was monitored by 51Cr-release assay. PBLs (effectors) were co-cultured with 51Cr-labelled K562 targets (5000 cells per well) in effector to target E:T cell ratios 40:1, for 4 h at 37°C, according to standard protocol21. The percentage of cytotoxic activity was calculated using the following formula: % specific lysis = (sample cpm - spontaneous cpm)/ (maximal cpm - spontaneous cpm) × 100.
Complete blood count (CBC) was done on haematology analyzer SYSMEX KX-21 (Sysmex Corporation, Kobe, Japan) and erythrocyte sedimentation rate (ESR) was done by the Westergren method22.
Fasting blood sugar, liver function tests [serum bilirubin, serum alanine transaminase (ALT), aspartate transaminase (AST) alkaline phosphatase (ALP), γ-glutamyl transferase GGT], renal function tests (blood urea nitrogen, serum creatinine, protein, albumin and uric acid), minerals (serum calcium, phosphorus, iron and copper), lipid profile (serum cholesterol, triglycerides, HDL-cholesterol and LDL-cholesterol) were analyzed using standard biochemical kits (AMP Diagnostics, Austria) on a fully automated biochemical analyzer (Biochemical Systems International SRL, Italy). Fasting insulin, vitamin B12 and endocrine markers (T3, T4, TSH, cortisol) were measured using standard radioimmunoassay kits (Shinjin Medics Inc., South Korea). Homeostatic model assessment-insulin resistance (HOMA-IR) index was calculated using the formula [Sugar (mmol/l) x Insulin]/22.5. Glycosylated haemoglobin and high sensitive (hs)-CRP were measured using Nycocard Reader (Axis Shield, Norway). Vitamin A levels were measured using standard HPLC kit (Recipe Chemicals, + Instruments, GmBH Germany). Ferritin levels were measured using standard ELISA kits (Calabasas, CA, USA).
For assurance of quality, both internal and external quality control (obtained from Christian Medical College, Vellore, India and BIO RAD, USA) samples were processed. For maintaining the integrity of metabolic data all the kits procured for analyzing the parameters were kept constant throughout the study.
Statistical analysis
Immunologic variables - The results were analyzed using SPSS software (Version 15.0, SPSS Inc., USA) or GraphPad Prism software (version 5.01), (GraphPad Software, Inc., USA). Overall significance was assessed by using one-way ANOVA or Friedman test; Wilcoxon signed rank test was applied for multiple comparisons at P<0.02 (after applying the Bonferroni correction). Analysis of serial measurements (viz., intracellular Ca2+ flux and ROS) was done using MedCalc software (version 11.4.4), (MedCalc Software bypa, Belgium). The Spearman's rank correlation between various parameters was analyzed at P<0.05.
Clinical and metabolic variables - All results were analyzed using GraphPad Instat software (version 3.5) and GraphPad Prism software (version 5.01). The normally distributed data were expressed as mean ± SD (95% confidence interval) and analysed using paired ‘t’ test. The data not normally distributed were expressed as median (IQR) and statistical analysis was done by Wilcoxon signed rank test.
Results
Of the 74 participants who were prescribed Basti treatment during the study period, 48 were included. Of these, 15 participants did not come for S2 and S3 collections and were excluded from the analysis. One of the participants withdrew due to adverse events.
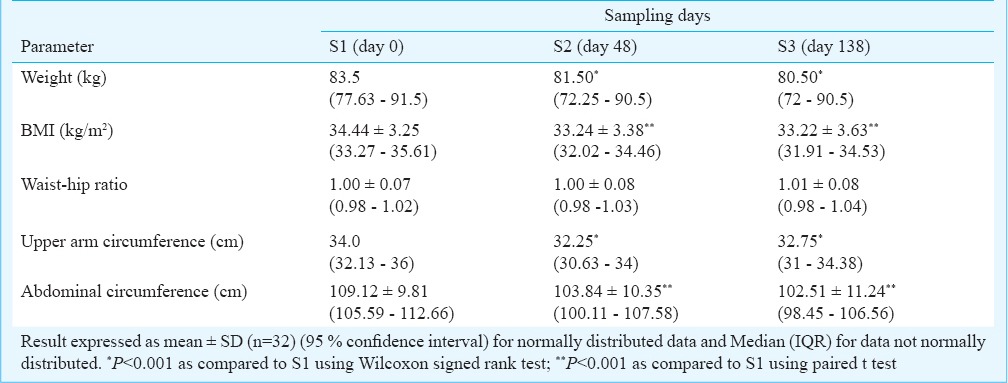
Of the 32 patients who completed the study, 25 were women. The mean age (± SD, range) of the participants was 42.5 (± 8.44, 22.00 - 58.00) yr. A significant (P<0.001) decrease occurred in weight, BMI, upper arm and abdominal circumference immediately after the course of Basti (at S2) and this was maintained at S3. The waist hip ratio remained unaltered throughout the course (Table I).
Table I.
Effect of a course of Basti on anthropometric data
As shown in Fig. 1, a marked decrease in levels of IFN-γ (3.771 ± 4.63 to 1.54 ± 2.23 pg/ml; P<0.02) and IL-6 (111.2±152.05 to 52.85 ± 111.24 pg/ml; P<0.02) was observed at S2 as compared to S1. IL-6 levels remained significantly low in serum even at S3 compared to S1 (27.79 ± 79.29 pg/ml; P<0.002). A reduction in IL-1 β levels was observed at S3 and a gradual decrease in IL-8 levels was noted, although not significant. No significant changes in levels of TNF-α, IL-4 and IL-10 were noted.
Fig. 1.
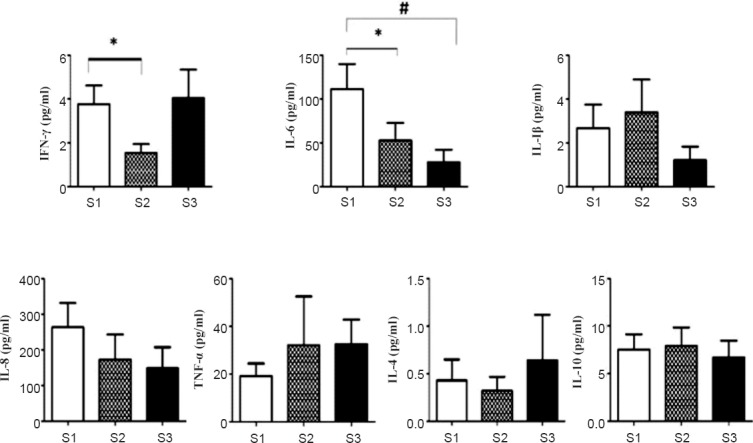
Effect of various cytokines in serum of obese individuals. Values represented in pg/ml ± SD (n=32). *P<0.02, #P<0.002.
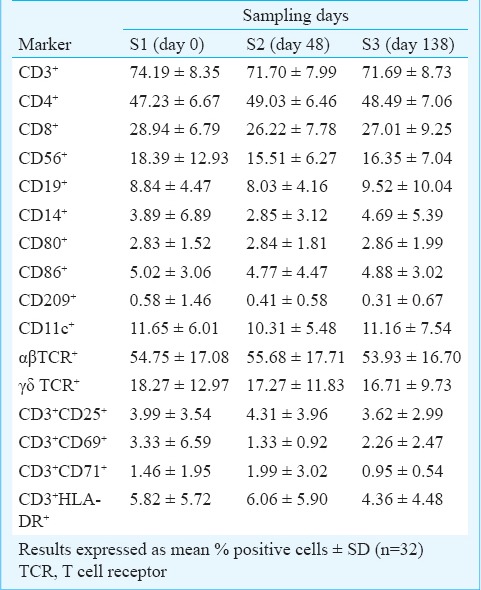
During the course of Basti therapy (S1, S2, S3), no significant alterations were observed in the percentages of T cell subsets (CD3, CD4, CD8, αβ-TCR and γδ-TCR), natural killer (NK, CD56), B cells (CD 19), macrophages (CD14), dendritic cells (CD209), and regulatory T cells (CD4 CD25). The activation status of T lymphocytes as measured by the expression of early (CD3 CD69) and late (CD3 CD25) activation markers was also not altered (Table II).
Table II.
Expression of immunophenotypic markers and activation status of lymphocytes
A marked increase in production of IFN-γ (P <0.02) was observed in culture supernatants of PBLs stimulated with anti-CD3 MAb at S2, which further increased (P<0.002) at S3 as compared to that noted at S1. In contrast, a gradual reduction in IL-8 production was noted in PBL-culture supernatants upon anti-CD3 MAb stimulation (P<0.02) (Fig. 2a). There was a positive correlation between IL-6 and IL-8 levels at S1 (r= 0.87), S2 (r= 0.57) and S3 (r= 0.87). No significant changes in levels of cytokines IL-6, IL-1 β, TNF- α, IL-4 and IL-10 were observed in PBL-culture supernatants before and after stimulation with anti-CD3 MAb.
Fig. 2.
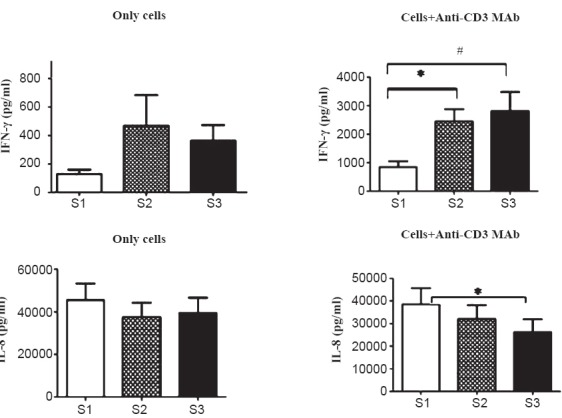
Functional responses of lymphocytes from obese individuals. 2(a). Measurement of cytokine production in cell-free culture supernatants of unstimulated peripheral blood lymphocytes (PBLs) and after stimulation with anti-CD3 MAb (1 μg) [IFN-γ and IL-8]. Figures represent mean values in pg/ml ± SD (n=32) (*P<0.02, #P<0.002).
A significant increase in generation of ROS was observed over a time-period of 45 min at S2 compared to that at S1. When ROS-generation was measured at S3, levels returned to values observed at S1. Also, a rapid increase in calcium flux was noted at 20 seconds after stimulation with anti-CD3 MAb in PBLs at S2, while peak in calcium release was noted at 30 seconds after addition of stimulus (anti-CD3 MAb) at S3. No significant modulations in NK-cytotoxicity were observed in obese individuals undergoing Basti therapy (i.e. at S2 and S3). Following Basti therapy, PBLs exhibited higher proliferative response to TCR-agonist at S2 compared to S1 but the difference was not significant (Fig. 2b). There was a gradual increase in turnover of T-cells with slight reduction in B-cells at S2 (Fig. 2c).
Fig. 2(b).
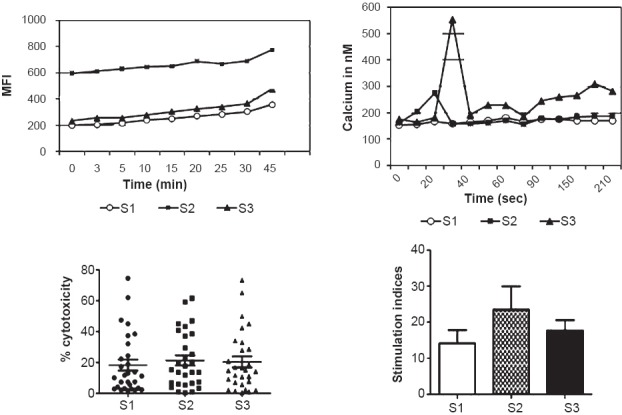
Generation of ROS, intracellular Ca2+ release, NK-cytotoxicity and proliferative response of PBLs upon stimulation with anti-CD3 MAb at different time points. MFI, mean fluorescence intensity.
Fig. 2c.
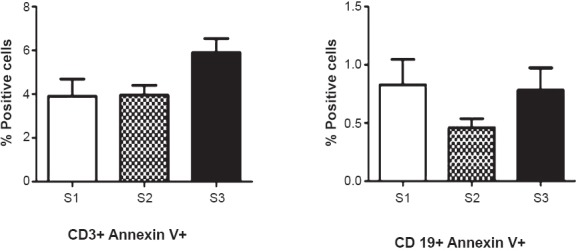
Measurement of apoptosis of PBLs using Annexin V FITC staining. Figure represents mean of per cent positive cells ± SD (n=32).
As seen in Fig. 3, the levels of IgM were markedly elevated from 1.06 ± 0.68 mg/ml at S1 to 3.76 ± 4.08 mg/ml at S2 (P<0.02) with a significant reduction at S3 (1.67±1.10 mg/ml; P<0.02) as compared with S1. A marginal decrease in levels of IgG was at S2 with significant drop (P<0.02) at S3. A positive correlation between IgG and IL-6 levels was observed at S2 (r=0.39) and S3 (0.66).
Fig. 3.
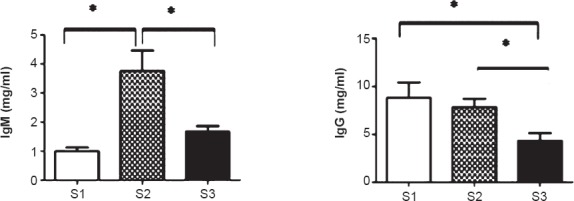
Effect of IgM and IgG immunoglobulin levels in serum of obese individuals. Figures represent mean values of IgM and IgG in mg/ml ± SD (n=32) (*P<0.02).
No significant change was observed on the metabolic parameters like fasting blood sugar, HbA1 C, HOMA-IR, liver function, renal function, serum phosphorus, iron, sodium, potassium, copper, vitamin B12, T3, T4, thyroid stimulating hormone (TSH) and any of the variables of lipid metabolism after the course of Basti.
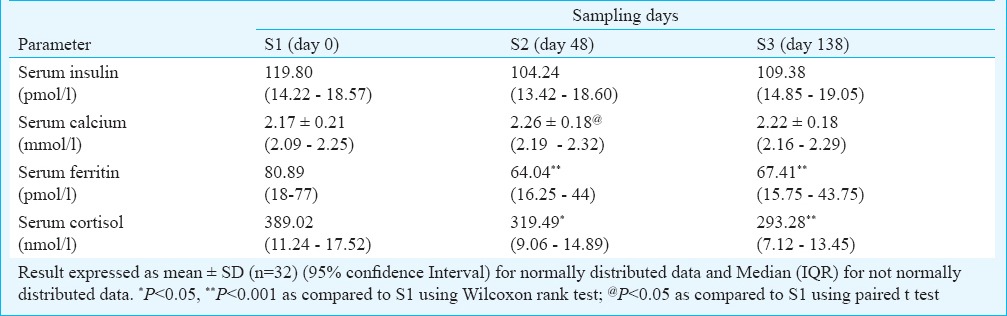
A decrease was observed in serum insulin at S2 compared to S1 and this reduction was maintained at S3. A significant increase was observed in serum calcium at S2 as compared to S1. However, this effect was not sustained over time. There was a significant decrease in serum ferritin at S2 and S3. A significant decrease was observed in serum cortisol levels at S2 and S3 as compared to S1 (Table III).
Table III.
Effect of a course of Basti on metabolic parameters
Discussion
This was a systematic study carried out to assess certain immunological or metabolic changes in obese individuals after a therapeutic course of Basti. A significant decrease was observed in weight, BMI, upper arm and abdominal circumference in obese individuals and this decrease was maintained over a period of three months. The mean weight loss of 3.09 kg at the end of Basti treatment (day 48 from baseline) was comparable to the various pharmacological interventions like sibutramine, orlistat, phentermine, diethylpropion or bupropion and fluoxetine in obesity23. Further, no side effects were observed during our study over a period of three months indicating the safety of the procedure.
The Basti treatment lasted 16 days followed by a 32 period of diet and lifestyle change which was common to all patients. It appeared that the whole package of Basti and diet in the prescribed package led to a sustained weight loss associated with changes in upper arm and abdominal circumference.
According to Ayurveda, the ingredients of Basti reach up to the small intestine and get absorbed through the gut wall, are distributed in the body and thus exert systemic effects24. Our study confirmed that the therapeutic procedure brought about a weight loss that was sustainable. However, one cannot comment on its mechanism of action at this point of time. Perhaps as an indicator toward the mechanism of action, was the observation that the elevated serum levels of IL-6 and IFN-γ of these obese patients reduced significantly after Basti. The low grade chronic inflammation in obesity is characterized by accumulation of macrophages and other activated immune cells (T cells, B cells, eosinophils, neutrophils, mast cells and natural killer cells) in the adipose tissue. M1 macrophages are characterized by enhanced pro-inflammatory cytokine production (TNF-α, Il-6 and IL-1). On the other hand, M2 macrophages are characterized by the production of anti-inflammatory cytokines such as IL10. Adipokines/cytokines released from activated immune cells contribute to insulin resistance that is associated with obesity25. In obese individuals, increased production of adipokines influences multiple functions such as appetite and energy balance, immunity, insulin sensitivity, angiogenesis, blood pressure and lipid metabolism including production of high amount of TNF-α and IL-626. Enhanced activity of TNF and IL-6 are involved in the development of obesity-related insulin resistance27. Macrophages and dendritic cells infiltrate into expanding adipose tissue28, where they produce IFN-γ. Basti therapy downregulated levels of IL-6 and IFN-γ at S2. The effect was sustained in case of IL-6 even 90 days after the therapy. A gradual reduction in IL-8 level was also observed following Basti therapy. IL-8 has been shown to be produced and released from human adipose tissue and/or adipocytes suggesting IL-8 involvement in obesity29. Our data showed that serum insulin fell significantly as did HOMA-IR. Thus, the results demonstrate that Basti treatment ameliorates Th1 type inflammatory cytokine response in obese individuals that may attenuate adipose tissue inflammation and insulin resistance without disrupting other immune functions.
It was interesting to note that functional properties of T-cells such as proliferative response, intracellular calcium flux and generation of ROS were modulated in obese individuals after undergoing Basti therapy. Fat accumulation is known to increase systemic oxidative stress independent of hyperglycaemia and may relate to the dysregulated production of adipocytokines30. Moreover, regulation of intracellular Ca2+ ([Ca2+]i) plays a key role in obesity, insulin resistance and hypertension. Our results demonstrated increased generation of ROS and higher levels of intracellular calcium in PBLs of obese individuals at S2, which returned to baseline at S3.
A significant increase in serum calcium was seen after the course of Basti. Though serum calcium decreased after 90 days, it was still higher than baseline level. There have been several isolated reports of an inverse relationship between dietary and serum calcium and indices of obesity31. Our results confirm these findings.
No clinically significant changes were observed in haematological parameters, as well as liver and renal function tests over the three month study period in any of the patients indicating safety of the intervention.
Serum ferritin reduced significantly after the Basti treatment and this decrease was maintained up to 90 days. Serum ferritin is generally considered as reflective of iron storage, but it is also increased in response to inflammation and is considered as a measure of chronic inflammation32. There is increasing evidence indicating that higher ferritin levels are observed in obesity (which is associated with increase in multiple markers of low grade inflammation)33 which further contribute to insulin resistance. The reduction seen in ferritin levels, therefore, indicates the beneficial effects of Basti in obesity.
Serum cortisol levels decreased after the 48 days treatment period, which further decreased after 90 days. The primary reason for endocrine malfunction in human obesity is hypersensitivity and/or hyper-responsiveness of the hypothalamo-pituitary-adrenal (HPA) axis. The decrease in cortisol levels observed in our study suggests normalizing of the HPA axis. The Basti treatment, however, did not demonstrate significant change in levels of any other hormone.
In conclusion, our findings showed that in obese individuals, the Ayurvedic Basti (enema) treatment modulated immune responses by regulating pro-inflammatory cytokines, immunoglobulins and functional properties of T-cells. These changes were associated with a reduction in the body weight which was maintained even after three months. Additionally, the study documented the safety of Basti procedure adequately.
References
- 1.World Health Organization (WHO). Obesity and overweight. Fact sheet No. 311, Updated March 2013. [accessed on December 28, 2013]. Available from: http://www.who.int/mediacentre/factsheets/fs311/en/
- 2.Wang Y, Beydoun MA. The obesity epidemic in the United States - gender, age, socioeconomic, racial/ethnic, and geographic characteristics: a systematic review and meta-regression analysis. Epidemiol Rev. 2007;29:6–28. doi: 10.1093/epirev/mxm007. [DOI] [PubMed] [Google Scholar]
- 3.Berghofer A, Pischon T, Reinhold T, Apovian CM, Sharma AM, Willich SN. Obesity prevalence from a European perspective: a systematic review. BMC public health. 2008;8:200. doi: 10.1186/1471-2458-8-200. [DOI] [PMC free article] [PubMed] [Google Scholar]
- 4.Carr MC, Brunzell JD. Abdominal obesity and dyslipidemia in the metabolic syndrome: importance of type 2 diabetes and familial combined hyperlipidemia in coronary artery disease risk. J clin endocrinol metab. 2004;89:2601–7. doi: 10.1210/jc.2004-0432. [DOI] [PubMed] [Google Scholar]
- 5.Kimmons JE, Blanck HM, Tohill BC, Zhang J, Khan LK. Associations between body mass index and the prevalence of low micronutrient levels among us adults. [accessed on December 28, 2013]. Available from: http://www.medscape.com/viewarticle/548615_2 . [PMC free article] [PubMed]
- 6.Dandona P, Aljada A, Chaudhuri A, Mohanty P. Endothelial dysfunction, inflammation and diabetes. Rev endocr metab disord. 2004;5:189–97. doi: 10.1023/B:REMD.0000032407.88070.0a. [DOI] [PubMed] [Google Scholar]
- 7.Lyon CJ, Law RE, Hsueh WA. Adiposity, inflammation, and atherogenesis. Endocrinology. 2003;144:2195–200. doi: 10.1210/en.2003-0285. [DOI] [PubMed] [Google Scholar]
- 8.Kern PA, Ranganathan S, Li C, Wood L, Ranganathan G. Adipose tissue tumor necrosis factor and interleukin-6 expression in human obesity and insulin resistance. Am J Physiol Endocrinol Metab. 2001;280:E745–51. doi: 10.1152/ajpendo.2001.280.5.E745. [DOI] [PubMed] [Google Scholar]
- 9.Cartier A, Lemieux I, Alméras N, Tremblay A, Bergeron J, Després JP. Visceral obesity and plasma glucose-insulin homeostasis: contributions of interleukin-6 and tumor necrosis factor-alpha in men. J Clin Endocrinol Metab. 2008;93:1931–8. doi: 10.1210/jc.2007-2191. [DOI] [PubMed] [Google Scholar]
- 10.Cartier A, Côté M, Lemieux I, Pérusse L, Tremblay A, Bouchard C, et al. Sex differences in inflammatory markers: what is the contribution of visceral adiposity? Am J Clin Nutr. 2009;89:1307–14. doi: 10.3945/ajcn.2008.27030. [DOI] [PubMed] [Google Scholar]
- 11.Kaplan LM. Pharmacological therapies for obesity. Gastroenterol Clin North Am. 2005;34:91–104. doi: 10.1016/j.gtc.2004.12.002. [DOI] [PubMed] [Google Scholar]
- 12.Rucker D, Padwal RS, Li SK, Curioni C, Lau DC. Long term pharmacotherapy for obesity and overweight: updated meta-analysis. BMJ. 2007;335:1194–9. doi: 10.1136/bmj.39385.413113.25. [DOI] [PMC free article] [PubMed] [Google Scholar]
- 13.Bult MJ, van Dalen T, Muller AF. Surgical treatment of obesity. Eur J Endocrinol. 2008;158:135–45. doi: 10.1530/EJE-07-0145. [DOI] [PubMed] [Google Scholar]
- 14.Trikamaji AJ, editor. 5th ed. Varanasi: Chaukhamba Sanskrit Sansthan; 2001. Sutrasthana Charak Samhita, 21st Adhyaya: Astauninditiya; Shlok No.21; p. 117. [Google Scholar]
- 15.Trikamaji AJ, editor. 5th ed. Varanasi: Chaukhamba Sanskrit Sansthan; 2001. Siddhishana Charak Samhita. 1st Adhyaya: Kalpanasiddhi, Shlok no.27-34; p. 682. [Google Scholar]
- 16.Trikamaji AJ, editor. 5th ed. Varanasi: Chaukhamba Sanskrit Sansthan; 2001. Siddhi Sthana Charak Samhita. 2nd Adhyaya: Panchakarmiya siddhi, Shlok no.14-19; p. 688. [Google Scholar]
- 17.Boyum A. Isolation of mononuclear cells and granulocytes from human blood. Isolation of monuclear cells by one centrifugation, and of granulocytes by combining centrifugation and sedimentation at 1 g. Scand J Clin Lab Invest. 1968;97(Suppl):77–89. [PubMed] [Google Scholar]
- 18.Vandenberghe PA, Ceuppens JL. Flow cytometric measurement of cytoplasmic free calcium in human peripheral blood T lymphocytes with fluo-3, a new fluorescent calcium indicator. J Immunol Methods. 1990;127:197–205. doi: 10.1016/0022-1759(90)90069-8. [DOI] [PubMed] [Google Scholar]
- 19.Walrand S, Valeix S, Rodriguez C, Ligot P, Chassagne J, Vasson MP. Flow cytometry study of polymorphonuclear neutrophil oxidative burst: a comparison of three fluorescent probes. Clin Chim Acta. 2003;331:103–10. doi: 10.1016/s0009-8981(03)00086-x. [DOI] [PubMed] [Google Scholar]
- 20.Wadia P, Atre N, Pradhan T, Mistry R, Chiplunkar S. Heat shock protein induced TCR gammadelta gene rearrangements in patients with oral cancer. Oral oncol. 2005;41:175–82. doi: 10.1016/j.oraloncology.2004.08.007. [DOI] [PubMed] [Google Scholar]
- 21.Dhar S, Chiplunkar SV. Lysis of aminobisphosphonate-sensitized MCF-7 breast tumor cells by Vräv92 T cells. Cancer Immun. 2010;10:10. [PMC free article] [PubMed] [Google Scholar]
- 22.International Council for Standardization in Haematology Expert Panel on Blood Rheology. ICSH recommendations for measurement of erythrocyte sedimentation rate. J Clin Pathol. 1993;46:198–203. doi: 10.1136/jcp.46.3.198. [DOI] [PMC free article] [PubMed] [Google Scholar]
- 23.Li Z, Maglione M, Tu W, Mojica W, Arterburn D, Shugarman LR, et al. Meta-analysis: pharmacologic treatment of obesity. Ann Intern Med. 2005;142:532–46. doi: 10.7326/0003-4819-142-7-200504050-00012. [DOI] [PubMed] [Google Scholar]
- 24.Trikamaji AJ, editor. 5th ed. Varanasi: Chaukhamba Sanskrit Sansthan; 2001. Siddhi Sthana Charak Samhita. 1st Adhyaya: Kalpanasiddhi, Shlok no.40; p. 684. [Google Scholar]
- 25.Sell H, Habich C, Eckel J. Adaptive immunity in obesity and insulin resistance. Nat Rev Endocrinol. 2012;8:709–16. doi: 10.1038/nrendo.2012.114. [DOI] [PubMed] [Google Scholar]
- 26.Clément K, Vignes S. Inflammation, adipokines and obesity. Rev Med Interne. 2009;30:824–32. doi: 10.1016/j.revmed.2009.03.363. [DOI] [PubMed] [Google Scholar]
- 27.Ronti T, Lupattelli G, Mannarino E. The endocrine function of adipose tissue: an update. Clin Endocrinol (Oxf) 2006;64:355–65. doi: 10.1111/j.1365-2265.2006.02474.x. [DOI] [PubMed] [Google Scholar]
- 28.Lumeng CN, Deyoung SM, Bodzin JL, Saltiel AR. Increased inflammatory properties of adipose tissue macrophages recruited during diet-induced obesity. Diabetes. 2007;56:16–23. doi: 10.2337/db06-1076. [DOI] [PubMed] [Google Scholar]
- 29.Kobashi C, Asamizu S, Ishiki M, Iwata M, Usui I, Yamazaki K, et al. Inhibitory effect of IL-8 on insulin action in human adipocytes via MAP kinase pathway. J Inflamm (Lond) 2009;6:25. doi: 10.1186/1476-9255-6-25. [DOI] [PMC free article] [PubMed] [Google Scholar]
- 30.Furukawa S, Fujita T, Shimabukuro M, Iwaki M, Yamada Y, Nakajima Y, et al. Increased oxidative stress in obesity and its impact on metabolic syndrome. J Clin Investi. 2004;114:752–61. doi: 10.1172/JCI21625. [DOI] [PMC free article] [PubMed] [Google Scholar]
- 31.Zemel MB. Regulation of adiposity and obesity risk by dietary calcium: mechanisms and implications. J Am Coll Nutr. 2002;21:146S–51S. doi: 10.1080/07315724.2002.10719212. [DOI] [PubMed] [Google Scholar]
- 32.Ausk KJ, Ioannou GN. Is obesity associated with anemia of chronic disease?. A population-based study. Obesity (Silver Spring) 2008;16:2356–61. doi: 10.1038/oby.2008.353. [DOI] [PubMed] [Google Scholar]
- 33.Lecube A, Hernandez C, Pelegri D, Simo R. Factors accounting for high ferritin levels n obesity. Int J Obes (Lond) 2008;32:1665–9. doi: 10.1038/ijo.2008.154. [DOI] [PubMed] [Google Scholar]