Abstract
PURPOSE
We aimed to assess the relation between basic clinical parameters and evolution of solitary pure ground-glass nodules (pGGN) in the lungs.
METHODS
Baseline and follow-up computed tomography (CT) of patients with solitary pGGN were selected and two radiologists independently reviewed CTs for nodule characterization. CT features of solitary pGGN were manually measured maximum diameter (D1) and its orthogonal diameter (D2), mean diameter (mD), D1 to D2 ratio as surrogate of roundness, and location according to lobar anatomy. Longitudinal changes were assessed and solitary pGGNs were classified as resolved or persisting. Persisting nodules were further classified as stable or grown according to an increase in mD of ≥2 mm or appearance of solid component. Baseline CT features of solitary pGGNs and clinical metrics of patients were compared between resolved and persisting nodules and, thereafter, between stable and grown lesions.
RESULTS
A total of 95 subjects with solitary pGGN were included. After a median 16-month follow-up, 20 nodules resolved, while 75 persisted. Among persisting nodules, 18 were grown and 57 were stable. Grown nodules showed larger D1 and mD compared with stable pGGNs (P < 0.001). Subjects with grown nodules were older (P = 0.021). Logistic regression analyses showed higher likelihood of growth for nodules ≥10 mm (odds ratio [OR], 8.355; P = 0.001) and subjects older than 67 years (OR, 3.656; P = 0.034).
CONCLUSION
Nodules ≥10 mm in subjects older than 67 years showed higher likelihood of growth. These data could contribute to a more individual approach to the management of solitary pGGN.
Pure ground-glass nodules (pGGN) are a common finding on computed tomography (CT) of the chest (1). Although often benign, they can also represent adenocarcinoma, notably adenocarcinoma in situ or minimally invasive adenocarcinoma (2). Current guidelines for the management of incidentally found pGGN are based on size and recommend follow-up of lesions bigger than 5 mm for at least three years (3, 4). The radiation and patient anxiety of such long follow-up period could be considered as problematic (5).
Unlike recommendations for solid nodules, follow-up of pGGN does not take smoking history into account (6). Moreover, they do not take into account age and other basic clinical parameters. However, previous publications have shown an association between lung nodule evolution and these parameters (7).
The purpose of our study was to assess the relation between basic clinical parameters and the evolution of solitary pGGNs.
Methods
Data selection
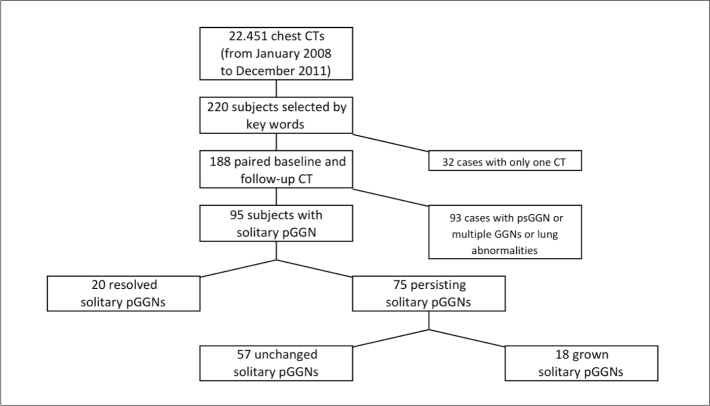
The institutional review board approved this retrospective study and individual consent was waived. The goal of our data search was to identify all patients who had an incidental solitary pGGN on a CT examination of the chest and a follow-up CT examination because of this nodule. Using the computerized radiology information system of our tertiary care hospital, reports of chest CTs performed between January 2008 and December 2011 were searched for the terms “ground-glass nodule” or “subsolid nodule” (Fig. 1) (8). A radiologist (MS with four-year experience in clinical chest CT and two-year experience in lung cancer screening CT) reviewed the CTs and selected subjects with solitary pGGN with maximum diameter 5–30 mm. All cases with part-solid nodule or multiple GGNs were excluded. Moreover, subjects with CT signs of pneumonia, pulmonary embolism, and inhalational or interstitial lung disease were excluded because the abnormalities seen in these patients could mask potential GGNs.
Figure 1.
STARD chart showing the selection and classification of solitary pGGNs. CT, computed tomography; pGGN, pure ground-glass nodule; psGGN, part-solid ground-glass nodule.
Age, gender, and oncologic history were collected from the clinical database of the hospital and recorded for each patient. Included patients were categorized according to the history of neoplasm. Patients in their radiologic follow-up for treated malignancy were selected, whereas subjects undergoing CT for preoperative cancer staging were excluded from this study.
CT technique
Several CT scanners were used for the acquisition in clinical activity: Somatom Emotion 6, Somatom Emotion 16, Soma-tom Sensation Cardiac 64, Somatom Definition Flash 128×2 (Siemens Medical System). Acquisition and reconstruction parameters were set according to subject biometrics and clinical inquiry: 100–140 kV, 30–120 mAs, pitch 0.2–3.4, rotation time 280–500 ms, slice thickness 0.7–2.5 mm, reconstruction interval 0.7–2.5 mm, high-spatial-frequency algorithm (b70 kernel), and lung parenchyma window (width 1600, level −600). All chest CTs included in this study were unenhanced examinations.
CT features of pGGN
At baseline CT, the following features of pGGN were assessed: a) maximum diameter measured by electronic caliper (D1); b) diameter orthogonal to D1 (D2); c) mean diameter (mD) as the mathematical mean of D1 and D2; d) the ratio of D1 and D2, as a surrogate for spherical shape; e) location, according to lung lobar anatomy.
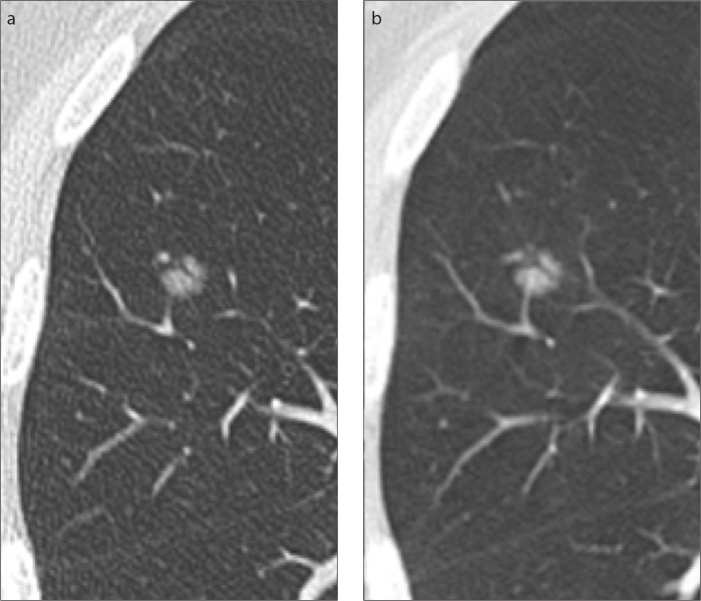
At follow-up CT, persistency of the nodule was assessed and each pGGN was classified as resolved (Fig. 2) or persisting. Resolved pGGNs were those that disappeared completely. Persisting pGGNs were further classified as stable (Fig. 3) or grown (Fig. 4). In particular, signs of growth were defined as: a) mD increase ≥2 mm (9, 10) ; b) appearance of solid component.
Figure 2.
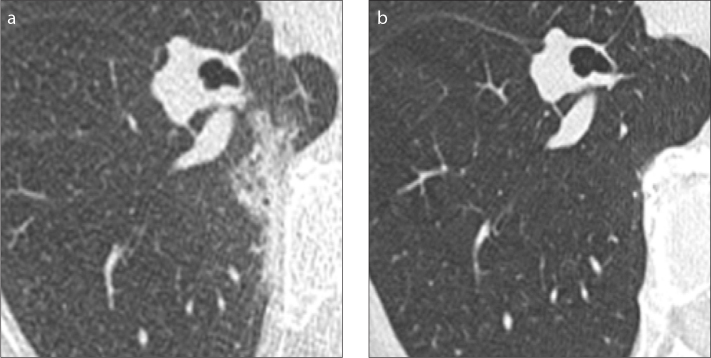
a, b. Resolved solitary pure ground-glass nodule. Subpleural lesion is seen on baseline CT (a), but it disappeared at follow-up CT (b), three months later.
Figure 3.
a, b. Persisting stable solitary pure ground-glass nodule (pGGN). Solitary pGGN of the right middle lobe showed same CT features at baseline (a) and at follow-up (b), 19 months later.
Figure 4.
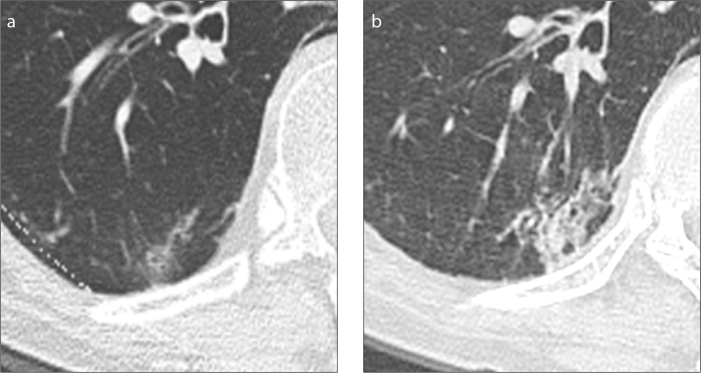
a, b. Persisting grown solitary pure ground-glass nodule. Subsolid lesion is displayed at baseline CT (a). The lesion increased in size and solid component appeared at follow-up CT (b), 17 months later.
Two radiologists with 12-year experience in clinical chest CT and eight-year experience in lung cancer screening CT measured all nodules independently. The mathematical means of D1, D2, mD, and D1/D2 between the two radiologists were used to describe the nodules. Differences in growth classification were resolved by consensus.
Statistical analysis
The Kolmogorov-Smirnov normality test was used to assess the distribution of data. Because part of the data was not normally distributed, the results were shown as median and interquartile range (IQR, 25%–75%), and nonparametric tests were used.
The Mann-Whitney U test was used to assess differences in continuous baseline CT features and clinical data between pGGNs with different longitudinal evolution. The dependence of pGGN behavior on categorical baseline CT features and clinical data was tested by the Fisher’s exact test or Chi-squared test. Relationship of pGGN behavior with respect to baseline CT features and clinical data was tested by logistic regression analysis. The odds ratio (OR) and its 95% confidence interval (95% CI) were reported. The optimal cutoff values of lesion size and subject age were calculated by the analysis of receiver operating characteristic (ROC) curve. The area under the curve (AUC) was calculated for this model.
The interobserver variability was assessed by the intraclass correlation coefficient (ICC) for continuous variables, and the Cohen κ was used to describe the inter-rater agreement on categorical variables.
Statistical analysis was performed by Prism 5 (GraphPad Software, Inc.) and Med-Calc 12 (MedCalc Software). P value < 0.05 was considered significant.
Results
A total of 95 subjects with solitary pGGN were selected from the database. CT features of pGGN at baseline and clinical data are reported in Table 1. After a median CT surveillance of 16.6 months, 20 pGGNs resolved (21.1%; median follow-up time 14.3 months) whereas 75 persisted (78.9%; median follow-up time 18.3 months; P = 0.201). Baseline CT features and clinical data of resolved and persisting nodules are reported in Table 2. In particular, resolved pGGNs had significantly bigger D1 and mD compared with persisting lesions (D1: 11.5 vs. 7.9 mm, P = 0.015; mD: 9.9 vs. 7.3 mm, P = 0.027). Also D2 showed a tendency for larger values in resolved nodules compared with persisting ones (median [IQR]: 7.5 mm [6.0–11.5 mm] vs. 7.0 mm [5.5–9.0 mm], P = 0.066). Age, oncologic anamnesis, spherical shape, and lobar distribution were similar between resolved and persisting pGGNs.
Table 1.
Baseline CT features and clinical data for all pGGNs
| Gender | Female | 40 (42.1) |
| Male | 55 (57.9) | |
|
| ||
| Oncologic anamnesis | Negative | 35 (36.8) |
| Positive | 60 (63.2) | |
|
| ||
| Age (years) | 66.3 (56.9–74.7) | |
|
| ||
| D1 (mm) | 9.0 (7.0–13.0) | |
|
| ||
| D2 (mm) | 7.0 (5.5–9.5) | |
|
| ||
| mD (mm) | 8.0 (6.5–10.9) | |
|
| ||
| Round shape (D1/D2) | 1.25 (1.14–1.44) | |
|
| ||
| Lobar location | RUL | 39 |
| RML | 1 | |
| RLL | 19 | |
| LUL | 23 | |
| LLL | 13 | |
Categorical data are reported as absolute number and numeric data are reported as median (interquartile range).
CT, computed tomography; pGGNs, pure ground-glass nodules; D1, maximum diameter; D2, orthogonal diameter; mD, mean diameter; RUL, right upper lobe; RML, right middle lobe; RLL, right lower lobe; LUL, left upper lobe; LLL, left lower lobe.
Table 2.
Baseline CT features and clinical data are reported for resolved or persisting pGGNs
| Resolved n=20 |
Persisting n=75 |
P | ||
|---|---|---|---|---|
| Gender | Female | 7 | 34 | 0.407 |
| Male | 13 | 41 | ||
|
| ||||
| Oncologic anamnesis | Negative | 6 | 29 | 0.500 |
| Positive | 14 | 47 | ||
|
| ||||
| Age (years) | 63.1 (55.4–75.9) | 68.2 (57.3–74.6) | 0.414 | |
|
| ||||
| D1 (mm) | 11.5 (8.1–17.3) | 7.9 (7.1–11.9) | 0.015 | |
|
| ||||
| mD (mm) | 9.9 (7.1–14.3) | 7.3 (5.9–10.5) | 0.027 | |
|
| ||||
| Round shape (D1/D2) | 1.43 (1.17–1.51) | 1.25 (1.14–1.39) | 0.103 | |
|
| ||||
| Lobar location | RUL | 9 | 30 | 0.688 |
| RML | 0 | 1 | ||
| RLL | 4 | 15 | ||
| LUL | 3 | 20 | ||
| LLL | 4 | 9 | ||
Categorical data are reported as absolute number and numeric data are reported as median (interquartile range).
CT, computed tomography; pGGNs, pure ground-glass nodules; D1, maximum diameter; mD, mean diameter; D2, orthogonal diameter; RUL, right upper lobe; RML, right middle lobe; RLL, right lower lobe; LUL, left upper lobe; LLL, left lower lobe.
Among the persisting 75 pGGNs, 57 (76%) remained stable and 18 (24%) grew (median follow-up time, 15.4 vs. 20.8 months; P = 0.374). Among grown pGGNs, nine (50%) showed only mD increase (median, 2.5 mm; IQR, 2.0–3.6 mm) whereas nine (50%) displayed appearance of solid component and various mD change (median, 1.0 mm; IQR, −3.0 mm to 6.8 mm). Baseline CT features and clinical data of stable and grown nodules are reported in Table 3. Gender, oncologic anamnesis, spherical shape at baseline, and lobar location were similar between stable and grown nodules. Subjects with grown pGGN were older than those with stable nodules (P = 0.021), however, the difference in age was not clinically substantial. Grown nodules showed bigger D1 (13.0 vs. 7.5 mm; P < 0.01) and mD at baseline (11.3 vs. 6.8 mm; P < 0.001) (Table 3 and Fig. 5).
Table 3.
Baseline CT features and clinical data are reported for stable and grown solitary pGGNs
| Stable n=57 |
Grown n=18 |
P | ||
|---|---|---|---|---|
| Gender | Female | 27 | 7 | 0.529 |
| Male | 30 | 11 | ||
|
| ||||
| Oncologic anamnesis | Negative | 20 | 9 | 0.257 |
| Positive | 37 | 9 | ||
|
| ||||
| Age (years) | 66.2 (51.7–73.4) | 70.4 (66.8–75.9) | 0.021 | |
|
| ||||
| D1 (mm) | 7.5 (6.0–9.1) | 13.0 (12.0–22.5) | <0.001 | |
|
| ||||
| mD (mm) | 6.8 (5.7–8.3) | 11.3 (10.3–18.8) | <0.001 | |
|
| ||||
| Round shape (D1/D2) | 1.25 (1.14–1.37) | 1.31 (1.11–1.63) | 0.216 | |
|
| ||||
| Lobar location | RUL | 22 | 8 | 0.453 |
| RML | 1 | 0 | ||
| RLL | 11 | 4 | ||
| LUL | 14 | 6 | ||
| LLL | 9 | 0 | ||
Categorical data are reported as absolute number and numeric data are reported as median (interquartile range).
CT, computed tomography; pGGNs, pure ground-glass nodules; D1, maximum diameter; mD, mean diameter; D2, orthogonal diameter; RUL, right upper lobe; RML, right middle lobe; RLL, right lower lobe; LUL, left upper lobe; LLL, left lower lobe.
Figure 5.
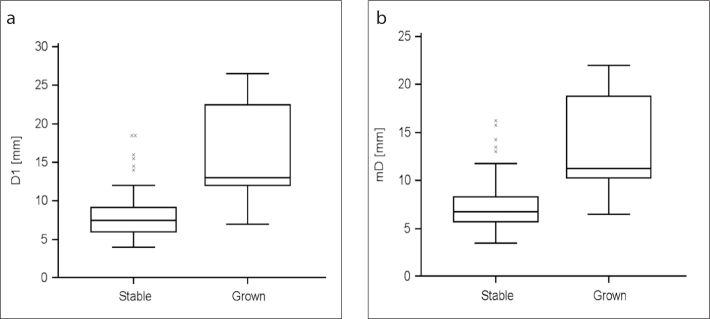
a, b. Median (95% CI) values of baseline D1 (a) and mD (b) of persisting pure ground-glass nodule (pGGN) according to nodule growth. As displayed by the graphs, grown pGGN were significantly larger than stable nodules (D1, P < 0.001; mD, P < 0.001).
The logistic regression analysis of baseline CT features and clinical data of persisting solitary pGGNs showed increased likelihood of growth for nodules with mD ≥10 mm (OR, 8.355; 95%CI, 1.674–41.691; P = 0.001) and subjects older than 67 years (OR, 3.656; 95% CI, 1.185–11.28; P = 0.034). Specifically, for any 1 mm of increase in baseline mD the likelihood of growth proportionally increased (OR, 1.496; 95%CI, 1.226–1.824; P < 0.001). The likelihood of growth was not related to gender (P = 0.191), oncologic anamnesis (P = 0.241), spherical shape (P = 0.694), or lobar localtion (P = 0.984). The ROC curve analysis showed an AUC of 0.824±0.05 (95%CI, 0.719–0.902; P = 0.015) for nodules with mD ≥10 mm at baseline in subjects older than 67 years.
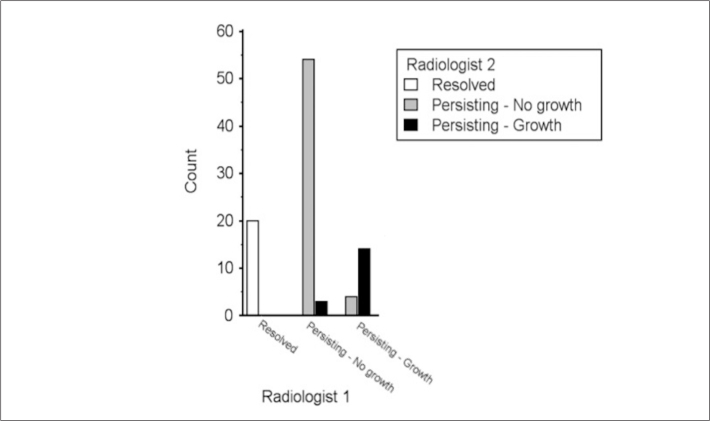
The comparison of nodule characteristics between the two radiologists is reported in Table 4. In particular, the best ICC was observed for D1 (ICC=0.937) and mD (ICC=0.972), as well as for the change of these two parameters along the follow-up period (ICC=0.949 and ICC=0.953, respectively). The agreement on the appearance of solid component was very good (κ=0.946). Notably, radiologist 2 rated one appearance of solid component that was not reported by radiologist 1. For this case, consensus was established for appearance of solid component. Moreover, the agreement on the evolution of nodules was very good (κ=0.884; Fig. 6). In particular, complete agreement was observed for resolved nodules; there was agreement about growth classification in 68 of 75 persisting solitary pGGNs, whereas different growth classification was assigned by the radiologists in seven persisting nodules. These seven solitary pGGNs tended to have bigger D1 and mD at baseline and smaller change in D1 during the follow-up period (although the differences were not statistically significant: P = 0.057, P = 0.053, and P = 0.150, respectively); also, these seven nodules had significantly smaller change of mD during the follow-up period compared with the 68 persisting nodules that were agreed upon (P = 0.004).
Table 4.
Interobserver agreement between the two radiologists
| D1a | Baseline | 0.937 (0.906–0.958) |
| Follow-up | 0.972 (0.958–0.981) | |
| Delta | 0.949 (0.925–0.966) | |
| D2a | Baseline | 0.925 (0.886–0.951) |
| Follow-up | 0.930 (0.896–0.953) | |
| mDa | Baseline | 0.950 (0.922–0.967) |
| Follow-up | 0.967 (0.951–0.978) | |
| Delta | 0.953 (0.930–0.968) | |
| Solid component at follow-upb | 0.946 (0.842–0.99) | |
| Growthb | 0.884 (0.800–0.968) | |
D1, maximum diameter; D2, diameter orthogonal to D1; mD, mean diameter.
Results are reported as intraclass correlation coefficient (95% confidence interval [CI]).
Results are reported as κ (95% CI).
Figure 6.
Differences in classification of nodule evolution. The graph shows pure ground-glass nodule (pGGN) classification by both radiologists: classification by radiologist 1 is displayed on the x-axis as the sum of the two bars; classification of radiologist 2 is displayed on the x-axis by specific bar colors (legend in right-upper corner box). No difference was seen in classification of resolved pGGN. The evolution of seven persisting nodules was different between the two radiologists: radiologist 1 classified as “no growth” a total of 57 persisting pGGNs, of which three were classified as “growth” by radiologist 2; radiologist 1 classified as “growth” a total of 18 persisting pGGNs, of which four were classified as “no growth” by radiologist 2.
Discussion
Our study showed that incidentally detected solitary pGGN on CT may resolve, be stable or grow, with a likelihood of growth that is directly related to the size of the nodule and age of the subject, but not to gender and oncologic history. Indeed, incidentally detected pGGN grew faster when they were bigger and in older subjects, as opposed to small nodules in younger subjects.
One fifth of incidentally detected solitary pGGNs resolved at follow-up CT. This rate of nodule resolution is similar to that reported in the literature (11, 12). In particular, authors reported resolution of subsolid nodules to be associated to bigger size (12, 13). Our results confirm this association in the specific subset of solitary pGGN.
Persisting nodules showed different evolution according to CT features. The likelihood of growth was directly related to nodule size and patient age. Notably, increased likelihood of growth was observed for nodules bigger than 10 mm. This report is in keeping with data from the literature (14–16). Furthermore, nodule growth was related to age older than 67 years. The proportion of growth observed in our study was slightly higher as compared with previous reports (17, 18). Notably, patient age in those previous reports was smaller than those of our population, thus confirming the positive relation between likelihood of growth and age. Otherwise, epidemiologic factors such as gender and oncologic history were not related to specific evolution of solitary pGGN. The independence of nodule evolution from oncologic history has been reported in a previous study from Takahashi et al. (16). The importance of investigating this relation comes with the frequent detection of subsolid nodules in asymptomatic patients undergoing their follow-up for treated malignancy. This relation is a current subject of debate in the literature. Notably, different relations were reported between nodule evolution and oncologic history, with long-term evolution of GGN being related to history of tumor (19–21). Nevertheless, the short-term evolution was not related to oncologic history in any of these studies. Therefore, our data and the reports from the literature suggest that the likelihood of short-term growth (e.g., within the one-year follow-up interval recommended for persisting solitary pGGN) is not influenced by oncologic history (3, 16, 19, 20).
It is well known that the measurement of lesions on CT has high variability (22). In this study the interoperator agreement was very good, although bigger differences were seen for larger lesions. This was reflected also for the classification between stable and grown nodules. Therefore, this observation suggests that interobserver agreement was inversely related to nodule size. Dedicated software has been proposed for the segmentation and quantification of GGN nodules with high interoperator agreement (18, 23). Semiautomatic segmentation fosters more accurate and comprehensive evaluation of nodule behavior, as reported from the experience in lung cancer screening trial (24). The performance of such software depends on nodule attenuation and segmentation thresholds. In particular, longitudinal change in volume and mass can be detected in the setting of fully standardized CT parameters, thus allowing long-term follow-up with low incidence of clinically manifest malignancy (24). However, it cannot be overemphasized that full standardization of CT parameters is hardly achievable in clinical practice, where the radiologist plays a pivotal role in the management of GGN nodules. In particular, it has been reported that experienced radiologist minimizes unnecessary work-up and intervention in the management of pulmonary lesions, especially for GGN where overdiagnosis and overtreatment are among the main issues (25). Therefore, dedicated training and acknowledgment of clinical parameters is mandatory for optimization of clinical management of these typically slow-growing lesions.
This study has several limitations. First, this is a retrospective study; therefore, CT technique and follow-up intervals are heterogeneous. Second, the subgroups of patients are small, thus studies with larger population are needed to confirm these data. Third, manual measurement of nodule is recognized as less accurate than automatic segmentation; however, this is the current standard to assess subsolid nodules. In order to increase the accuracy of our manual measurements, mean diameter was used to define changes in nodule size. Fourth, slice thickness ≤2.5 mm is beneath the current standard of quality for assessment of pulmonary nodules, which should be evaluated on ≤1 mm thick sections. Finally, pathologic correlation to solitary pGGN could not be described due to the lack of histologic assessment of the nodules.
In conclusion, the highest likelihood of growth was present in nodules larger than 10 mm and subjects older than 67 years. Also, no relation between longitudinal evolution and oncologic history was observed. Despite the preliminary nature of these data, they could contribute to a more individual approach in the management of these lesions, if confirmed in later studies.
Main points.
There is a positive association between the size of pure ground-glass nodule (pGGN) at baseline (>10 mm) and the likelihood of nodule growth.
Oncologic history was not related to CT evolution of pGGN, whereas there was a positive association between age (>67 years) and the likelihood of nodule growth.
Longer follow-up intervals could be considered for smaller pGGNs in younger patients to reduce radiation exposure.
Footnotes
Conflict of interest disclosure
The authors declared no conflicts of interest.
References
- 1.Godoy MC, Naidich DP. Overview and strategic management of subsolid pulmonary nodules. J Thorac Imaging. 2012;27:240–248. doi: 10.1097/RTI.0b013e31825d515b. http://dx.doi.org/10.1097/RTI.0b013e31825d515b. [DOI] [PubMed] [Google Scholar]
- 2.Austin JH, Garg K, Aberle D, et al. Radiologic implications of the 2011 classification of adenocarcinoma of the lung. Radiology. 2013;266:62–71. doi: 10.1148/radiol.12120240. http://dx.doi.org/10.1148/radiol.12120240. [DOI] [PubMed] [Google Scholar]
- 3.Naidich DP, Bankier AA, Macmahon H, et al. Recommendations for the management of subsolid pulmonary nodules detected at CT: a statement from the Fleischner Society. Radiology. 2013;266:304–317. doi: 10.1148/radiol.12120628. http://dx.doi.org/10.1148/radiol.12120628. [DOI] [PubMed] [Google Scholar]
- 4.Kim H, Park CM, Koh JM, Lee SM, Goo JM. Pulmonary subsolid nodules: what radiologists need to know about the imaging features and management strategy. Diagn Interv Radiol. 2014;20:47–57. doi: 10.5152/dir.2013.13223. [DOI] [PMC free article] [PubMed] [Google Scholar]
- 5.Galvin JR, Franks TJ. Lung cancer diagnosis: radiologic imaging, histology, and genetics. Radiology. 2013;268:9–11. doi: 10.1148/radiol.13130558. http://dx.doi.org/10.1148/radiol.13130558. [DOI] [PubMed] [Google Scholar]
- 6.MacMahon H, Austin JH, Gamsu G, et al. Guidelines for management of small pulmonary nodules detected on CT scans: a statement from the Fleischner Society. Radiology. 2005;237:395–400. doi: 10.1148/radiol.2372041887. http://dx.doi.org/10.1148/radiol.2372041887. [DOI] [PubMed] [Google Scholar]
- 7.McWilliams A, Tammemagi MC, Mayo JR, et al. Probability of cancer in pulmonary nodules detected on first screening CT. N Engl J Med. 2013;369:910–919. doi: 10.1056/NEJMoa1214726. http://dx.doi.org/10.1056/NEJMoa1214726. [DOI] [PMC free article] [PubMed] [Google Scholar]
- 8.Smidt N, Rutjes AW, van der Windt DA, et al. Quality of reporting of diagnostic accuracy studies. Radiology. 2005;235:347–353. doi: 10.1148/radiol.2352040507. http://dx.doi.org/10.1148/radiol.2352040507. [DOI] [PubMed] [Google Scholar]
- 9.Revel MP, Bissery A, Bienvenu M, Aycard L, Lefort C, Frija G. Are two-dimensional CT measurements of small noncalcified pulmonary nodules reliable? Radiology. 2004;231:453–458. doi: 10.1148/radiol.2312030167. http://dx.doi.org/10.1148/radiol.2312030167. [DOI] [PubMed] [Google Scholar]
- 10.Tamura M, Shimizu Y, Yamamoto T, Yoshikawa J, Hashizume Y. Predictive value of one-dimensional mean computed tomography value of ground-glass opacity on high-resolution images for the possibility of future change. J Thorac Oncol. 2014;9:469–472. doi: 10.1097/JTO.0000000000000117. http://dx.doi.org/10.1097/JTO.0000000000000117. [DOI] [PubMed] [Google Scholar]
- 11.CT screening for lung cancer: diagnoses resulting from the New York Early Lung Cancer Action Project. Radiology. 2007;243:239–249. doi: 10.1148/radiol.2431060467. http://dx.doi.org/10.1148/radiol.2431060467. [DOI] [PubMed] [Google Scholar]
- 12.Felix L, Serra-Tosio G, Lantuejoul S, et al. CT characteristics of resolving ground-glass opacities in a lung cancer screening programme. Eur J Radiol. 2011;77:410–416. doi: 10.1016/j.ejrad.2009.09.008. http://dx.doi.org/10.1016/j.ejrad.2009.09.008. [DOI] [PubMed] [Google Scholar]
- 13.Choi WS, Park CM, Song YS, Lee SM, Wi JY, Goo JM. Transient subsolid nodules in patients with extrapulmonary malignancies: their frequency and differential features. Acta Radiol. 2015;56:428–437. doi: 10.1177/0284185114528325. http://dx.doi.org/10.1177/0284185114528325. [DOI] [PubMed] [Google Scholar]
- 14.Lee HJ, Kim YT, Kang CH, et al. Epidermal growth factor receptor mutation in lung adenocarcinomas: relationship with CT characteristics and histologic subtypes. Radiology. 2013;268:254–264. doi: 10.1148/radiol.13112553. http://dx.doi.org/10.1148/radiol.13112553. [DOI] [PubMed] [Google Scholar]
- 15.Matsuguma H, Mori K, Nakahara R, et al. Characteristics of subsolid pulmonary nodules showing growth during follow-up with CT scanning. Chest. 2013;143:436–443. doi: 10.1378/chest.11-3306. http://dx.doi.org/10.1378/chest.11-3306. [DOI] [PubMed] [Google Scholar]
- 16.Takahashi S, Tanaka N, Okimoto T, et al. Long-term follow-up for small pure ground-glass nodules: implications of determining an optimum follow-up period and high-resolution CT findings to predict the growth of nodules. Jpn J Radiol. 2012;30:206–217. doi: 10.1007/s11604-011-0033-8. http://dx.doi.org/10.1007/s11604-011-0033-8. [DOI] [PubMed] [Google Scholar]
- 17.Chang B, Hwang JH, Choi YH, et al. Natural history of pure ground-glass opacity lung nodules detected by low-dose CT scan. Chest. 2013;143:172–178. doi: 10.1378/chest.11-2501. http://dx.doi.org/10.1378/chest.11-2501. [DOI] [PubMed] [Google Scholar]
- 18.Song YS, Park CM, Park SJ, Lee SM, Jeon YK, Goo JM. Volume and mass doubling times of persistent pulmonary subsolid nodules detected in patients without known malignancy. Radiology. 2014;273:276–284. doi: 10.1148/radiol.14132324. http://dx.doi.org/10.1148/radiol.14132324. [DOI] [PubMed] [Google Scholar]
- 19.Park CM, Goo JM, Kim TJ, et al. Pulmonary nodular ground-glass opacities in patients with extrapulmonary cancers: what is their clinical significance and how can we determine whether they are malignant or benign lesions? Chest. 2008;133:1402–1409. doi: 10.1378/chest.07-2568. http://dx.doi.org/10.1378/chest.07-2568. [DOI] [PubMed] [Google Scholar]
- 20.Hiramatsu M, Inagaki T, Matsui Y, et al. Pulmonary ground-glass opacity (GGO) lesions-large size and a history of lung cancer are risk factors for growth. J Thorac Oncol. 2008;3:1245–1250. doi: 10.1097/JTO.0b013e318189f526. http://dx.doi.org/10.1097/JTO.0b013e318189f526. [DOI] [PubMed] [Google Scholar]
- 21.Attina D, Niro F, Stellino M, et al. Evolution of the subsolid pulmonary nodule: a retrospective study in patients with different neoplastic diseases in a nonscreening clinical context. Radiol Med. 2013;118:1269–1280. doi: 10.1007/s11547-013-0926-y. http://dx.doi.org/10.1007/s11547-013-0926-y. [DOI] [PubMed] [Google Scholar]
- 22.Kim H, Park CM, Woo S, et al. Pure and part-solid pulmonary ground-glass nodules: measurement variability of volume and mass in nodules with a solid portion less than or equal to 5 mm. Radiology. 2013;269:585–593. doi: 10.1148/radiology.13121849. http://dx.doi.org/10.1148/radiol.13121849. [DOI] [PubMed] [Google Scholar]
- 23.Scholten ET, de Jong PA, Jacobs C, et al. Inter-scan variation of semi-automated volumetry of subsolid pulmonary nodules. Eur Radiol. 2014;25:1040–1047. doi: 10.1007/s00330-014-3478-1. http://dx.doi.org/10.1007/s00330-014-3478-1. [DOI] [PubMed] [Google Scholar]
- 24.Scholten ET, de Jong PA, de Hoop B, et al. Towards a close computed tomography monitoring approach for screen detected subsolid pulmonary nodules? Eur Respir J. 2015;45:765–773. doi: 10.1183/09031936.00005914. http://dx.doi.org/10.1183/09031936.00005914. [DOI] [PubMed] [Google Scholar]
- 25.Xu DM, Lee IJ, Zhao S, et al. CT Screening for lung cancer: value of expert review of initial baseline screenings. AJR Am J Roentgenol. 2014;28:1–6. doi: 10.2214/AJR.14.12526. [DOI] [PubMed] [Google Scholar]


