

The ability of dual- and multi-energy CT to differentiate materials of different effective atomic numbers makes possible several new and clinically relevant CT applications.
Abstract
In x-ray computed tomography (CT), materials having different elemental compositions can be represented by identical pixel values on a CT image (ie, CT numbers), depending on the mass density of the material. Thus, the differentiation and classification of different tissue types and contrast agents can be extremely challenging. In dual-energy CT, an additional attenuation measurement is obtained with a second x-ray spectrum (ie, a second “energy”), allowing the differentiation of multiple materials. Alternatively, this allows quantification of the mass density of two or three materials in a mixture with known elemental composition. Recent advances in the use of energy-resolving, photon-counting detectors for CT imaging suggest the ability to acquire data in multiple energy bins, which is expected to further improve the signal-to-noise ratio for material-specific imaging. In this review, the underlying motivation and physical principles of dual- or multi-energy CT are reviewed and each of the current technical approaches is described. In addition, current and evolving clinical applications are introduced.
© RSNA, 2015
Introduction
In computed tomographic (CT) imaging, materials having different elemental compositions can be represented by the same, or very similar, CT numbers, making the differentiation and classification of different types of tissues extremely challenging. A classic example is the difficulty in differentiating between calcified plaques and iodine-containing blood. Although these materials differ considerably in atomic number, depending on the respective mass density or iodine concentration, calcified plaque or adjacent bone may appear identical to iodinated blood on a CT scan. In addition to the difficulty in differentiating and classifying tissue types, the accuracy with which material concentration can be measured is degraded by the presence of multiple tissue types. For example, when measuring the amount of iodine enhancement of a soft-tissue lesion, the measured mean CT number over the lesion reflects not only the enhancement due to iodine, but also the CT number of the underlying tissue.
The reason for these difficulties in differentiating and quantifying different tissue types is that the measured CT number of a voxel is related to its linear attenuation coefficient μ(E), which is not unique for any given material, but is a function of the material composition, the photon energies interacting with the material, and the mass density of the material. As can be seen in Figure 1, the same linear attenuation coefficient values can be measured for two different materials (eg, iodine and bone) at a given energy, depending on the mass density.
Figure 1:

Graph of linear attenuation coefficients for bone (assuming ρ = 1 g/cm3), iodine (assuming ρ = 1 g/cm3), and iodine with lower density (assuming ρ = 0.1 g/cm3) as a function of energy (in kiloelectron volts). The plotted linear attenuation coefficients (in reciprocal centimeters) were generated by using the energy-dependent mass attenuation coefficients from the National Institute of Standards, which were multiplied by the assigned density values. The result is that the same linear attenuation value (μ[E]) can be attained although the materials (iodine and bone) are different (arrow). Measuring attenuation at a second energy allows the two materials to be differentiated (arrowhead).
In dual-energy CT, an additional attenuation measurement is obtained at a second energy, allowing the differentiation of the two materials (Fig 1). Assuming the use of monoenergetic x-rays, at approximately 100 keV the same linear attenuation coefficients can be measured for bone and iodine. Data acquired at approximately 50 keV would allow the differentiation of the two materials. Although medical x-ray tubes generate a polyenergetic spectrum, the general principle remains valid. Thus, dual-energy CT can be defined as the use of attenuation measurements acquired with different energy spectra, along with use of the known changes in attenuation between the two spectra, to differentiate and quantify material composition. It was initially explored and described by Godfrey Hounsfield, who stated in 1973, “Two pictures are taken of the same slice, one at 100 kV and the other at 140 kV… so that areas of high atomic numbers can be enhanced. Tests carried out to date have shown that iodine (z = 53) can be readily differentiated from calcium (z = 20)” (1).
Technical Approaches to Dual-Energy CT
Dual-energy methods for CT were subsequently investigated by Alvarez and Macovski in 1976 (2,3). They demonstrated that even with polyenergetic x-ray spectra, one could still separate the measured attenuation coefficients into their contributions from the photoelectric effect and Compton scattering processes. Since this early work, a number of technical approaches have been developed for acquiring the dual-energy data set (Table).
Technical Approaches for Acquiring Dual-Energy Data Set

Two Temporally Sequential Scans
Initial applications focused primarily on the characterization of lung, liver, and soft-tissue composition (2,3). Two temporally sequential scans were performed to acquire the data at each of the two tube potentials (Fig 2a). Because the data were not acquired simultaneously, patient motion occurring between the two scans caused severe degradation of the resultant images and material composition information.
Figure 2a:

Slow kilovoltage (kV) switching: (a) Consecutive scans of the entire scan volume are obtained by using back-to-back scans at low and high tube potentials. Scans can be acquired in axial or spiral modes. The interscan delay is relatively long (several seconds) and is composed of the time to scan the complete volume of interest, as well as the time to reposition the table to the beginning of the scan volume. (b) Consecutive scans of one anatomic section are obtained with decreased interscan delay by switching the tube potential between axial scans at each anatomic section level. The interscan delay is reduced to one rotation time plus the small delay to switch tube potential and increment the table.
To minimize the time delay inherent in two consecutive scans of the entire anatomic volume of interest, a modified approach has been suggested, where one axial scan (ie, one tube rotation) is performed at each tube potential prior to table incrementation (Fig 2b). This reduces the interscan delay between the low- and high-energy images. The best temporal resolution can be obtained for this scenario with use of partial scan reconstruction techniques. In this approach, 180° plus the fan angle of projection data are acquired at each tube potential, with a small delay between acquisitions to allow for switching of the tube potential and table incrementation. This approach may be appropriate for relatively static organs or tissues. However, because the time delay between the two scans is still relatively long, the susceptibility to motion misregistration between the low- and high-energy data sets may limit the value of this approach for dual-energy imaging of vascular processes, or tissues and organs susceptible to motion. For scanners having relatively narrow z-axis coverage, the increase in total scan time may also be a limiting factor.
Figure 2b:

Slow kilovoltage (kV) switching: (a) Consecutive scans of the entire scan volume are obtained by using back-to-back scans at low and high tube potentials. Scans can be acquired in axial or spiral modes. The interscan delay is relatively long (several seconds) and is composed of the time to scan the complete volume of interest, as well as the time to reposition the table to the beginning of the scan volume. (b) Consecutive scans of one anatomic section are obtained with decreased interscan delay by switching the tube potential between axial scans at each anatomic section level. The interscan delay is reduced to one rotation time plus the small delay to switch tube potential and increment the table.
Rapid Switching of X-Ray Tube Potential
In the 1980s, a modified commercial CT system (Somatom DR; Siemens Healthcare, Erlangen, Germany) used fast tube potential switching to allow alternate projection measurements to be acquired at low and high tube potentials (Fig 3) (4,5). Clinical application of this technique focused primarily on bone densitometry measurements. However, the tube current could not be increased quickly enough for the low tube potential measurements to achieve comparable noise levels in both the low and high tube potential data sets. This difference in noise limited extension of the technique beyond bone densitometry applications.
Figure 3:

Fast kilovoltage (kV) switching: The x-ray tube potential is switched between successive views in either axial or spiral mode. Dual-energy processing can be performed by using projection or image data, and the temporal resolution of each image and the entire examination remains essentially unchanged. For successful technical implementation and to maintain current levels of image quality and temporal resolution, very fast detector materials and electronics are needed. Additionally, the x-ray generator must be capable of very rapid transitions between the low and high tube potentials.
Switching the tube potential between consecutive views requires that the transition time from low to high tube potential be less than a millisecond. In addition, the transition must be as abrupt as possible to maximize the energy separation of the measured data, although difficulty in rapidly modulating the x-ray tube current may cause high noise levels in the low-energy data or excessive dose from the high-energy projections. This problem can be addressed, however, by using asymmetric sampling for the low- and high-energy projections. In this manner, without rapidly changing the tube current, the needed increase in tube current-time product for the low-energy projections is obtained by using a longer sampling interval for the low-energy data. This approach has been successfully implemented (HD 750; GE Healthcare, Waukesha, Wis). However, because the same x-ray tube is used for both the low- and high-energy data set, it is technically difficult to optimize the spectral filtration for both the low- and high-energy images. Finally, very fast data sampling is needed to avoid decreasing the in-plane spatial resolution subsequent to allocating a fraction of the acquired samples to each energy’s data set. The very short time interval between the low- and high-energy views (less than 1 msec) provides near-simultaneous data acquisition of the low- and high-energy data set. The one-view misregistration requires a correction to be applied to avoid streak artifacts; however, this allows dual-energy material decomposition algorithms to be implemented by using either projection data or reconstructed images. The ability to use projection data assists in reducing beam-hardening artifacts in calculated “virtual monoenergetic” images.
Multilayer Detector
A third mechanism for acquiring dual-energy CT projection data uses a single high tube potential beam and layered or “sandwich” scintillation detectors (Fig 4). The low-energy data are collected from the front or innermost detector layer and the high-energy data are collected from the back or outermost detector layer (Fig 5). This is analogous to the use of multilayer detectors for dual-energy radiography (6–8). To achieve comparable noise in the low- and high-energy images, different detector thicknesses are used. Preliminary clinical work using a prototype multilayer detector system and a 64–detector row CT scanner (Brilliance-64; Philips Medical Systems, Bothell, Wash) has been reported to be capable of successfully differentiating iodine from bone. An advantage to this approach is that the low- and high-energy data sets are acquired simultaneously, and the data from the inner and outer detector layers are recorded at all times (9). This allows dual-energy analysis to be performed on every data set acquired. That is, the system is always operating in a “dual-energy mode.”
Figure 4:

A single x-ray source and single tube potential value are used in combination with a dual-layer scintillating detector. kV = kilovoltage.
Figure 5:

In a dual-layer detector, low-energy quanta are predominantly collected in the front layer. X-rays capable of passing through the front layer are predominantly of higher energy and are collected in the back detector layer. keV = kiloelectron volt.
Dual X-Ray Sources
Dual-source CT is a CT system where two x-ray sources and two data acquisition systems are mounted on the same gantry, positioned orthogonally to one another (Fig 6) (10,11). The first dual-source scanner was introduced in 2006 (Somatom Definition DS); the second, in 2009 (Somatom Definition Flash); and a third, in 2013 (Somatom Force), all from Siemens Healthcare (Forchheim, Germany). Each x-ray source is equipped with its own high-voltage generator, allowing independent control of both the x-ray tube potential and the tube current. The projection data are approximately 90° out of phase. Images reconstructed from each of the tube-detector pairs are used to perform material decomposition analyses in the image domain.
Figure 6:

Dual-x-ray-source geometry: Independent x-ray tubes, detectors, and generators allow simultaneous collection of dual-energy data. Each tube can be operated by using the optimal tube current setting and with optimum spectral filtration. Due to the 90° offset between the low- and high-energy views, dual-energy processing is implemented by using already reconstructed image data. Both axial and spiral acquisition modes are possible, and the temporal resolution remains unchanged. Scatter originating from one tube can be detected by the orthogonal detector, which can reduce spectral separation. The field of view over which dual energy data are acquired is currently limited to 26, 33 or 35 cm, depending on the specific scanner model. kV = kilovoltage.
Because each tube is operated at different tube potentials and different tube current values, the noise levels in the respective images are adjustable. Because both tubes are simultaneously energized, scattered radiation whose original primary photon came from one tube may be detected by the detector for the other tube, and vice versa. This degrades spectral separation and requires the implementation of an appropriate scatter-correction algorithm (12). An advantage of the dual-source approach is the ability to independently optimize the spectral filtration for each tube-detector pair, which enables increased spectral separation and an increased signal-to-noise ratio in the material-specific images (13,14).
Technical Approaches to Multi-Energy CT
Photon-counting Detectors
The use of energy-resolving photon-counting detectors may offer the most robust solution to dual-energy, or multi-energy, data acquisition. Such detectors, which are capable of counting discrete photon interactions, are the subject of ongoing research and development and are not commercially available in CT systems, although they are used in nuclear medicine and spectral mammography. Based on the choice of energy thresholds and the associated energy of each photon, counts are placed into specific energy threshold data sets (Fig 7) (15–17). Data associated with specific energy windows are created by subtracting different energy threshold data. For the special case with n = 2 energy windows, photon-counting detectors can be used for dual-energy imaging.
Figure 7:

Schematic diagram of a photon-counting (energy-resolving) x-ray detector and signal-processing components. The semiconductor detector (eg, CdTe) directly converts the absorbed x-ray energy into electrical charge, which is accelerated across a potential difference and collected by discreet signal electrodes. Unlike current scintillating CT detectors, there are no septa within the semiconductor material; this maximizes geometric efficiency. The signal collected is proportional to the absorbed photon energy, and pulse height analysis is used to bin the signal from discreet photon interactions into two or more energy windows, depending on the capability of the application-specific integrated circuit coupled to the semiconductor detector. keV = kiloelectron-voltage.
By using pulse-height discrimination, the transmitted x-ray spectrum is divided into a number of different energy bins (Fig 8), the number of which depends on the design of the application-specific integrated circuit that is bonded to the energy-resolving detector. Cadmium telluride (CdTe) and cadmium zinc telluride are considered the most likely candidates for the material used to convert the energy of an absorbed x-ray into an electrical signal, the magnitude of which is proportional to the incident photon’s energy (18). Although such detectors are currently available and used in other disciplines, challenges exist in dealing with the exposure rates used in CT imaging. At the high peak x-ray flux used in CT imaging (approximately 109 counts/sec/mm2) (19), currently available detectors experience a loss of counts due to pulse pile-up effects and can eventually become fully paralyzed (20,21). The accuracy of the recorded energy can be degraded due to the distribution of a photon’s energy across multiple detector pixels (known as charge sharing [22–24]) or the reemission of a characteristic x-ray (known as K-escape). To reduce the effects of charge sharing, a charge-summing mode has been proposed in which communication between nearby detector pixels is established with use of hardware circuits. Charges from the neighboring pixels of coincident events are summed up and the total charge is assigned to the pixel that collects the most charge. Substantial improvement of spectral performance has been observed using this technique (25,26).
Figure 8:

Illustration of the binning of detected x-rays into six energy windows (w1–w6). This illustration neglects nonideal properties such as pulse pile-up, which occurs when the count rate is too high, and charge sharing or K-escape phenomena, which occur when the discrete spacing of the signal electrodes is too small. To achieve both an accurate photon count and spectral measurement in CT, both hardware and software advances are necessary. keV = kiloelectron volt.
A number of potential advantages, including improved spectral separation and increased dose efficiency (27), are driving significant research and development in this field. In particular, photon-counting detectors have a higher geometric efficiency than do energy-integrating detectors (by approximately 30%), and the application of an energy threshold enables the rejection of counts due only to measured electronic noise. Electronic noise measured above the threshold will affect only the measured energy of each photon; it will not change photon counts. This detector technology also provides the ability to perform K-edge imaging.
Material Decomposition Algorithms
The ability of dual- or multi-energy CT to decompose a material into its constituent elements relies on the energy- and element-dependent nature of x-ray attenuation. In the diagnostic energy range (E < 150 keV), the attenuation of x-rays by matter is primarily due to the photoelectric effect and Compton scattering processes. This is a monotonic and smoothly varying function for elements without K- or L-edges within the energy range that is useful for diagnostic x-ray imaging (2). In the absence of a K- or L-edges, the attenuation coefficient of a given material can be modeled as a linear combination of the photoelectric and Compton interactions.
By modeling the dependence of the photoelectric and Compton interaction processes on material mass density (ρ) and atomic number (Z), a ρZ map can be generated and material-specific information obtained (2). Since the x-ray attenuation depends primarily on these two interaction mechanisms, any material’s attenuation coefficient can be expressed as a linear combination of the attenuation coefficients of two underlying basis materials (28).
Early investigations into dual-energy CT material decomposition focused on methods implemented in prereconstruction (projection) space, creating either ρZ image pairs (2) or basis material image pairs (5). The use of projection data has the theoretical advantage of eliminating beam-hardening artifacts in the reconstructed images. In practice, however, beam-hardening artifacts may not be completely removed due to imperfect system calibrations (29). This demonstrates that regardless of the algorithm domain (projection or image space), accurate system calibrations, which establish the relationship between the projection measurements and known densities of basis materials, or CT numbers and known thicknesses of basis materials, are essential.
Material decomposition can also be performed in postreconstruction (image) space, by using either ρZ decomposition (30) or basis material decomposition (31). Image space decomposition is relatively easy to implement and is used in systems where spatial or temporal inconsistency exists between the projection data acquired at the two beam energies, for example, in dual-source CT (10,11). Iterative beam hardening correction in image space can be used in this scenario to minimize the dependence of quantitative measurements on patient size or composition (32).
The use of photo- counting detectors in CT may provide more spectral information than is available from dual-energy CT systems. The energy-discriminating capability of photon-counting detectors enables binning of the detected photons into N energy bins, where N depends on the number of energy thresholds allowed by the application-specific integrated circuit design. The choice of N is affected by the energy resolution since a better energy resolution allows more accurate spectral information to be recorded in each energy bin. Energy resolution on the order of several kiloelectron volts is currently typical. The additional number of energy measurements (ie, bins) provides more discrete information about the transmitted spectra and enables new approaches for material decomposition, such as K-edge imaging, to detect specific, or even multiple, contrast agents (15,33–37). The optimal configuration of energy bins, that is, the number of bins and their upper and lower thresholds, has a critical impact on the material decomposition of spectral imaging, and a number of reports have focused on optimization strategies (2,38–40). Also, material decomposition algorithms for photon-counting detector-based CT have been investigated for both projection- and image-space approaches (35,36,41,42).
With use of material decomposition techniques, one can obtain mass density, effective atomic number, or other material-specific information. Clinical applications that make use of these capabilities can be classified into two main categories, the first of which is to quantify the concentration of a certain component of a mixture. The mixture usually involves two or more materials with known elemental compositions, such as iodine, soft tissue, and fat. This could be applied, for example, to quantify contrast material uptake in the liver. The second type of clinical application is to classify materials into predefined groups, such as uric acid versus non–uric acid urinary stones. The classification can be based on the effective atomic number information from the material decomposition or on density-independent measurements, such as the ratio of the CT number measured in the low-energy image to that measured in the high-energy image. This ratio is referred to in various publications as either the dual-energy ratio, or DER, or the CT number ratio, or CTR (14,43).
A three-material decomposition algorithm can also be used to quantify the concentration of three materials with known elemental compositions in a mixture (11,13,14). In the absence of the ability to perform K-edge imaging, the ability to quantify three materials from only two unique measurements relies on the introduction of a third piece of information, which is usually the assumption of volume or mass conservation (31). Conceptually, the CT numbers of three materials of known composition and density are plotted on a graph, where the y-axis is the CT number at low energy (eg, 80 kV) and the x-axis is the CT number at the high energy (eg, 140 kV) (Fig 9). Ideally, the three basis materials should be sufficiently different as to create a broad triangle in this plot. Thereafter, corresponding CT number pairs from the low- and high-energy images are mapped onto the calibration diagram. Depending on their position in the diagram, the material or percent composition of a certain material is estimated. The voxels can be color coded according to material type or the percent composition of the basis materials reported. Alternatively, one or more of the basis materials can be either suppressed or enhanced, depending on the desired clinical application. The noise level in the low- and high-energy images and the magnitude of difference in effective atomic number between basis materials each affect the accuracy of the material discrimination (13,14).
Figure 9:

The CT numbers of three known materials in the low- and high-energy images can be plotted on the y- and x-axis, respectively. Unknown materials are then mapped onto this plot to determine the percent composition of each of the three basis materials.
Energy Domain Noise Reduction
Whether in dual- or multi-energy CT, the number of photons in any given energy bin is less than the total number exiting the patient. This has important consequences for multi-energy CT, where the appropriate selection of energy bins (ie, the number of energy bins and the width of each energy bin) has a critical impact on the outcome of spectral imaging. A narrow energy bin has better energy resolution compared with a wider energy bin, and hence enables better material differentiation. For example, referring to the spectra in Figure 8, use of bins w2 and w5 would result in improved material discrimination than would use of wider bins (w2 + w3) and (w4 + w5). However, an obvious limitation of using narrow bins is that the number of photons available in each energy bin is much smaller than the total number of photons detected, and noise levels within each bin are dramatically increased. Thus, a critical problem occurs–to maximize material separation, energy bins should be narrow and widely separated; however, for narrow energy bins, the noise may be so high as to make it impossible to detect small differences in material composition. Moreover, when only narrow energy bins are used, a large portion of the dose delivered to the patient in other energy bins is unutilized. Thus, the requirements for increasing the differences in material-specific attenuation are in direct conflict with the requirements for decreasing noise in the energy-specific data and in any material decomposition images derived from them.
Similar observations exist for the selection of the total number of energy bins. For a given x-ray spectrum, more energy bins provide more measurements of energy-dependent information. With multiple data points available along the attenuation-energy curve, better curve fitting and consequently better material differentiation is achieved. However, more bins imply narrower bin widths and fewer photons in each bin. For example, for a system with six energy bins of equal width, the number of photons in each energy bin is only one-sixth of the total photons delivered (Fig 8). Noise in each energy bin is then substantially increased relative to the situation using fewer energy bins.
Therefore, an intrinsic trade-off exists in the selection of energy bins (number, width, and placement) for multi-energy CT, resulting in the described trade-off between energy-specific signal (material differentiation information) and noise. To address this constraint, Leng et al (44) developed an energy-domain noise-reduction technique to reduce image noise in spectral CT. Simulations, phantom experiments, and patient studies demonstrated the ability to achieve noise levels in each energy-selective image similar to that of the composite (nonenergy-selective) image that makes use of all detected photons, both for clinical dual-energy CT systems and photon-counting detector-based spectral CT systems (44). This was achieved without any loss of spatial resolution. This approach allows flexible selection of energy bin width and number to maximize material decomposition capabilities, without incurring increased image noise or requiring increased patient dose.
Energy domain noise reduction has been successfully applied to the full range of dual- or multi-energy processing techniques, including the generation of blended images (linear or nonlinear combination of the low- and high-energy images), virtual monoenergetic images, or material-specific images (44–48). It can be applied before material decomposition on the individual energy-specific images and after material decomposition on the material-specific or virtual monoenergetic images. As noise reduction is applied in the energy domain, it offers additive benefit to spatial- or temporal-domain noise reduction techniques, such as image- or projection-based denoising or iterative reconstruction.
Several other dual-energy noise-reduction techniques have been previously investigated to reduce noise in material-specific images. Macovski et al proposed a method using measurement-dependent filtering, which essentially combines low-frequency information from the material-specific image and high-frequency information from the nonmaterial-specific image (49,50). Kalender et al (51) developed a method to reduce noise using the negative correlation in material-specific images from dual-energy CT. McCollough et al (52) developed a correlated noise-reduction technique in dual-energy digital subtraction angiography. Compressed sensing-based methods, such as prior image constrained compressed sensing (PICCS) by Chen et al and nonconvex PICCS by Ramírez-Giraldo et al can also be used to reduce image noise in dual- and multi-energy CT (53,54). Finally, Gao et al have described a compressive sensing approach based on a prior rank, intensity and sparsity model, or PRISM (55).
Current and Emerging Clinical Applications of Dual- and Multi-Energy CT
Although each of the major CT manufacturers is investigating dual-energy acquisition and reconstruction techniques, at present, a greater range of clinical applications and software tools has been developed for use with the dual-source system. In the remaining sections, examples from a dual-source CT system will be used to introduce several clinical applications of dual-energy CT. Patient examinations shown in this section were acquired under institutional review board approval.
Virtual Monoenergetic Imaging
In dual-energy CT, besides the material-specific information, one may also synthesize monoenergetic images at different energies, which can be used for routine diagnosis similar to conventional polyenergetic images acquired at a single x-ray tube potential (56–61). These images decrease beam-hardening artifacts, even when image-based methods are used. Because of the abrupt increase in iodine attenuation above 33 keV, iodine signal increases for photon energies that are just above 33 keV. The optimal energy at which to synthesize the virtual monoenergetic image depends on several factors, including patient size and the use of energy-domain noise reduction methods to address the increase in noise that would otherwise occur at lower energy settings. In practice, the optimal contrast-to-noise ratio for iodine occurs at virtual monoenergetic energies of 40–70 keV.
Automated Bone Removal in CT Angiography
One of the most appealing applications of dual-energy CT is direct CT angiography (62–65). In this approach, the dual-energy algorithm identifies and removes bone, allowing direct visualization of iodinated vessels (Fig 10). On the most current dual-source CT system, the field of view of the second x-ray source limits dual-energy bone removal to a 35-cm field of view; single-energy bone removal algorithms are used outside the 35-cm field of view on that system. As Hounsfield predicted in 1973, the differences in atomic number do indeed make calcium and iodine readily separable with use of dual-energy techniques.
Figure 10:

Coronal CT angiogram in a 62-year-old woman. With dual-energy techniques, bone anatomy can be automatically separated from the vascular anatomy and highly enhancing kidneys.
Perfused Blood Volume (Blood Pool Imaging)
In addition to removing bone to see iodine, the identification of iodine voxels allows for color enhancement of iodinated areas. One clinical use is visualization of the perfused blood volume, also referred to as blood pool imaging. Applications have been developed to detect perfusion deficits in the lung secondary to a pulmonary embolism (66–70) (Fig 11) and to detect areas of ischemia in the myocardium (71–75).
Figure 11:

Contrast-enhanced, dual-energy axial CT image in a 31-year-old man with a pulmonary embolism in the right lower lobe. Iodine signal is identified and color coded in red within the segmented lung. The iodine overlay image is superimposed on a gray-scale mixed image. The dark regions show a perfusion defect secondary to the embolism. Blue circle marks the diameter of the second tube on the dual-source CT scanner. Dual-energy data are acquired only within this circle.
Virtual Noncontrast–enhanced Images
Another potential application for dual-energy CT is, after identifying iodine voxels, to remove the iodine component of the CT number to create a virtual noncontrast image, that is, an image without contrast material enhancement (76–82). If the virtual noncontrast images are of sufficient quality to be a viable substitute for true noncontrast images, the noncontrast scan of multiphase examinations may be able to be omitted. An example of a clinical application where this possibility is desirable is in the CT evaluation of the kidney, ureters, and bladder, where a complete examination includes both a noncontrast and a contrast-enhanced scan. The noncontrast scan is required only for stone detection, because the presence of iodinated contrast material can obscure visualization of urinary stones. However, at present, urinary stones smaller than approximately 2 mm are not routinely visible in the virtual noncontrast images (81,83).
In examinations where only a contrast-enhanced scan was performed and a subtle increased attenuation is observed, it would be helpful to have a noncontrast examination to determine if the increased attenuation is due to contrast enhancement or simply due to the presence of a slightly more attenuating tissue type (77,78). The mixed image is not a material-specific image; it includes signal from soft tissue, bone, and iodinated contrast media. The “tissue-only” virtual noncontrast image suppresses the iodine signal, and the iodine information is shown as a color-coded map, which is overlaid on top of the mixed or virtual noncontrast image. These iodine maps are helpful in assessing whether lesions represent a malignant or benign process (Fig 12).
Figure 12a:

Axial contrast-enhanced, dual-energy scan in a 67-year-old man. (a, b) Mixed images show subcapsular hematoma of the liver (*) and two similar-appearing low-attenuation liver lesions (arrow). (c, d) Iodine overlay images demonstrate iodine within one lesion (c), indicating it is a metastasis (arrow), while the other image (d) contains no iodine, indicating it is a hematoma (arrow) associated with prior wedge resection.
Figure 12b:

Axial contrast-enhanced, dual-energy scan in a 67-year-old man. (a, b) Mixed images show subcapsular hematoma of the liver (*) and two similar-appearing low-attenuation liver lesions (arrow). (c, d) Iodine overlay images demonstrate iodine within one lesion (c), indicating it is a metastasis (arrow), while the other image (d) contains no iodine, indicating it is a hematoma (arrow) associated with prior wedge resection.
Figure 12c:

Axial contrast-enhanced, dual-energy scan in a 67-year-old man. (a, b) Mixed images show subcapsular hematoma of the liver (*) and two similar-appearing low-attenuation liver lesions (arrow). (c, d) Iodine overlay images demonstrate iodine within one lesion (c), indicating it is a metastasis (arrow), while the other image (d) contains no iodine, indicating it is a hematoma (arrow) associated with prior wedge resection.
Figure 12d:

Axial contrast-enhanced, dual-energy scan in a 67-year-old man. (a, b) Mixed images show subcapsular hematoma of the liver (*) and two similar-appearing low-attenuation liver lesions (arrow). (c, d) Iodine overlay images demonstrate iodine within one lesion (c), indicating it is a metastasis (arrow), while the other image (d) contains no iodine, indicating it is a hematoma (arrow) associated with prior wedge resection.
Conversely, iodine identification can be helpful when only a noncontrast-enhanced scan is performed and a subtle increase in attenuation is observed. For example, after thrombolytic therapy for stroke or after complicated intracranial neurologic procedures, iodine classification can be helpful in differentiating between blood, tumor, or retained iodinated contrast material (76,80).
Atherosclerotic Plaque Removal
An extension of automated bone removal is to remove not just large bone anatomy, but also discrete hard plaques, potentially allowing clearer visualization of patent lumens in maximum intensity projections (Fig 13) (84–86).
Figure 13a:
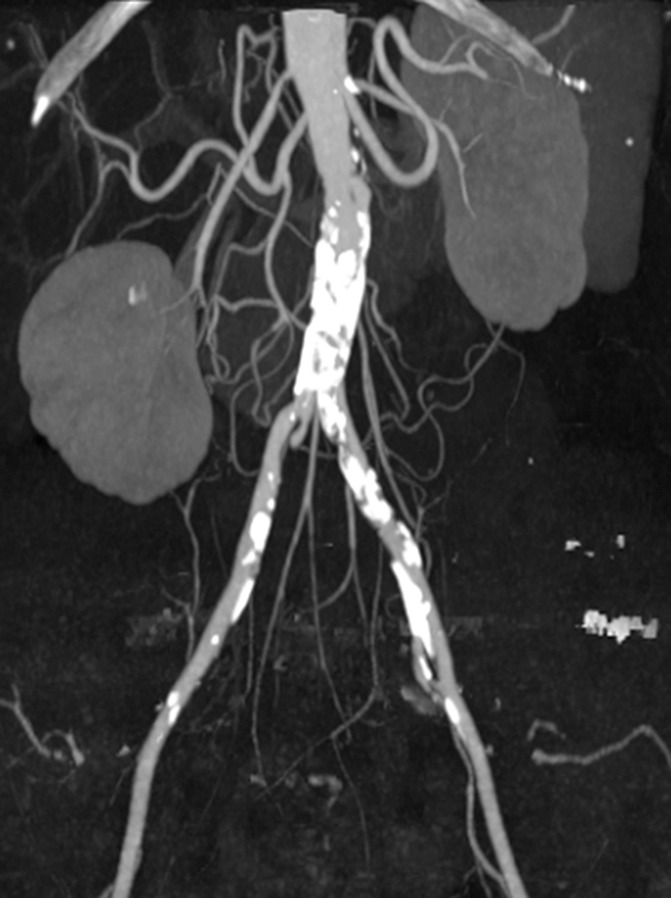
Coronal maximum intensity projection images from CT angiographic study of the aortic bifurcation in a 70-year-old man. (a) Calcified plaque obscures the vessel lumen. (b) By using dual-energy material decomposition, the calcified plaque is identified and subtracted, giving a clear indication of vessel patency and areas of stenoses (arrows).
Figure 13b:
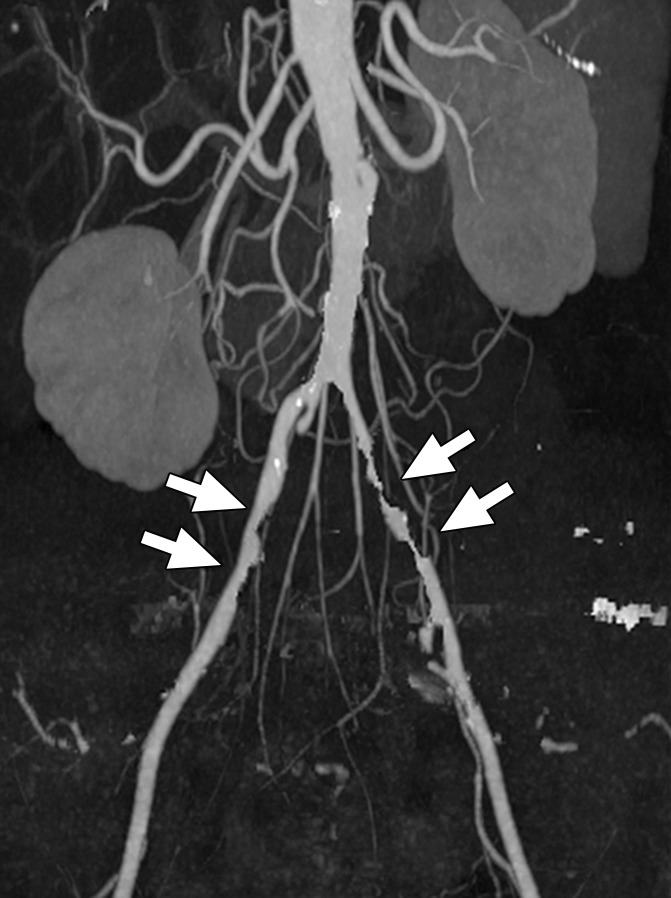
Coronal maximum intensity projection images from CT angiographic study of the aortic bifurcation in a 70-year-old man. (a) Calcified plaque obscures the vessel lumen. (b) By using dual-energy material decomposition, the calcified plaque is identified and subtracted, giving a clear indication of vessel patency and areas of stenoses (arrows).
Virtual Noncalcium Images
Similar to the virtual noncontrast application, where iodine is identified and removed to more clearly appreciate the underlying soft tissues, the same can be done with calcium (87). This increases the ability to detect bone marrow edema, which would otherwise be difficult to appreciate in the presence of the much larger calcium signal (Fig 14).
Figure 14a:

Dual-energy CT virtual noncalcium images acquired 11 days after injury demonstrate bone bruises in the lateral femoral condyle of a 29-year-old male soccer player. (a) Coronal and (d) axial views of the virtual noncalcium images demonstrate increased signal intensity due to edema subsequent to a knee injury (ie, bone bruises, arrow). (b, e) Corresponding T2-weighted MR images show high signal intensity in the same region (arrow). (c) Coronal and (f) axial views of the mixed images, where calcium signal has not been removed, show no evidence of bone injury.
Figure 14b:

Dual-energy CT virtual noncalcium images acquired 11 days after injury demonstrate bone bruises in the lateral femoral condyle of a 29-year-old male soccer player. (a) Coronal and (d) axial views of the virtual noncalcium images demonstrate increased signal intensity due to edema subsequent to a knee injury (ie, bone bruises, arrow). (b, e) Corresponding T2-weighted MR images show high signal intensity in the same region (arrow). (c) Coronal and (f) axial views of the mixed images, where calcium signal has not been removed, show no evidence of bone injury.
Figure 14c:

Dual-energy CT virtual noncalcium images acquired 11 days after injury demonstrate bone bruises in the lateral femoral condyle of a 29-year-old male soccer player. (a) Coronal and (d) axial views of the virtual noncalcium images demonstrate increased signal intensity due to edema subsequent to a knee injury (ie, bone bruises, arrow). (b, e) Corresponding T2-weighted MR images show high signal intensity in the same region (arrow). (c) Coronal and (f) axial views of the mixed images, where calcium signal has not been removed, show no evidence of bone injury.
Figure 14d:

Dual-energy CT virtual noncalcium images acquired 11 days after injury demonstrate bone bruises in the lateral femoral condyle of a 29-year-old male soccer player. (a) Coronal and (d) axial views of the virtual noncalcium images demonstrate increased signal intensity due to edema subsequent to a knee injury (ie, bone bruises, arrow). (b, e) Corresponding T2-weighted MR images show high signal intensity in the same region (arrow). (c) Coronal and (f) axial views of the mixed images, where calcium signal has not been removed, show no evidence of bone injury.
Figure 14e:

Dual-energy CT virtual noncalcium images acquired 11 days after injury demonstrate bone bruises in the lateral femoral condyle of a 29-year-old male soccer player. (a) Coronal and (d) axial views of the virtual noncalcium images demonstrate increased signal intensity due to edema subsequent to a knee injury (ie, bone bruises, arrow). (b, e) Corresponding T2-weighted MR images show high signal intensity in the same region (arrow). (c) Coronal and (f) axial views of the mixed images, where calcium signal has not been removed, show no evidence of bone injury.
Figure 14f:

Dual-energy CT virtual noncalcium images acquired 11 days after injury demonstrate bone bruises in the lateral femoral condyle of a 29-year-old male soccer player. (a) Coronal and (d) axial views of the virtual noncalcium images demonstrate increased signal intensity due to edema subsequent to a knee injury (ie, bone bruises, arrow). (b, e) Corresponding T2-weighted MR images show high signal intensity in the same region (arrow). (c) Coronal and (f) axial views of the mixed images, where calcium signal has not been removed, show no evidence of bone injury.
Urinary Stone Characterization
In vitro and in vivo experiments have demonstrated the ability of dual-energy material decomposition to accurately discriminate between uric acid and non–uric acid stones (43,88). Clinically, this is an important application since in vivo determination that a stone is made of uric acid would allow immediate initiation of urinary alkalization, potentially avoiding the need for further medical testing or stone removal procedures. The accuracy of this approach has been validated in phantom models and approaches 100% (88). Figure 15 demonstrates the results of one commercial software application, which color codes uric acid stones in red and non–uric acid stones in blue. The various types of non–uric acid stones (cystine, hydroxyapatite, calcium oxalate, etc) contain higher atomic number elements and so distinguish themselves from the uric acid stones, which do not. By using the increased spectral separation that results from filtering the high-energy beam of a dual-source scanner with a high-Z material, such as tin, differentiation between several non–uric acid stone types is also possible (14,89–92) (Fig 16).
Figure 15a:

Axial images in (a) 20-year-old man and (b) 32-year-old man. A commercially available software application can be used to discriminate between uric acid and non–uric acid renal stones.
Figure 16a:

Axial CT images. By using custom software that takes advantage of the increased in-spectral separation provided by a tin filter on the high-energy beam of a dual-source CT system, uric acid stones (red) can be distinguished from three groups of non–uric acid stones: cystine (yellow), calcium oxalate/brushite/struvite (green), and apatite (blue). (a) Uric acid stone in a 71-year-old man. (b) Cystine stone in a 63-year-old man. (c) Calcium oxalate stone in a 21-year-old woman. (d) Apatite stone in a 34-year-old woman.
Figure 15b:

Axial images in (a) 20-year-old man and (b) 32-year-old man. A commercially available software application can be used to discriminate between uric acid and non–uric acid renal stones.
Figure 16b:

Axial CT images. By using custom software that takes advantage of the increased in-spectral separation provided by a tin filter on the high-energy beam of a dual-source CT system, uric acid stones (red) can be distinguished from three groups of non–uric acid stones: cystine (yellow), calcium oxalate/brushite/struvite (green), and apatite (blue). (a) Uric acid stone in a 71-year-old man. (b) Cystine stone in a 63-year-old man. (c) Calcium oxalate stone in a 21-year-old woman. (d) Apatite stone in a 34-year-old woman.
Figure 16c:

Axial CT images. By using custom software that takes advantage of the increased in-spectral separation provided by a tin filter on the high-energy beam of a dual-source CT system, uric acid stones (red) can be distinguished from three groups of non–uric acid stones: cystine (yellow), calcium oxalate/brushite/struvite (green), and apatite (blue). (a) Uric acid stone in a 71-year-old man. (b) Cystine stone in a 63-year-old man. (c) Calcium oxalate stone in a 21-year-old woman. (d) Apatite stone in a 34-year-old woman.
Figure 16d:

Axial CT images. By using custom software that takes advantage of the increased in-spectral separation provided by a tin filter on the high-energy beam of a dual-source CT system, uric acid stones (red) can be distinguished from three groups of non–uric acid stones: cystine (yellow), calcium oxalate/brushite/struvite (green), and apatite (blue). (a) Uric acid stone in a 71-year-old man. (b) Cystine stone in a 63-year-old man. (c) Calcium oxalate stone in a 21-year-old woman. (d) Apatite stone in a 34-year-old woman.
Sequential scanning techniques have also been shown to successfully identify uric acid and non–uric acid stone types after application of a nonrigid registration technique, which aligns identified stones in the low- and high-energy data sets that otherwise were misaligned by several millimeters. Use of such registration techniques is critical if there is any motion present; even a 1-mm offset can alter the results in a small (approximately 2-mm) stone (93).
Crystalline Arthropathies
The ability of dual-energy CT to differentiate uric acid from calcium can be used to differentiate gout from pseudogout (calcium pyrophosphate deposition disease). Examples from two patients are shown in Figure 17 (94).
Figure 17a:

Three-dimensional volume-rendered CT images of (a) gout (green) in a 56-year-old man and (b) calcium pyrophosphate crystals (purple) in the triangular fibrocartilage (arrow) in a 78-year-old woman, where composition of intra- and peri-articular crystals was automatically determined by using dual-energy CT.
Figure 17b:

Three-dimensional volume-rendered CT images of (a) gout (green) in a 56-year-old man and (b) calcium pyrophosphate crystals (purple) in the triangular fibrocartilage (arrow) in a 78-year-old woman, where composition of intra- and peri-articular crystals was automatically determined by using dual-energy CT.
Detection of Silicone from Breast Implant Leaks
When the integrity of a silicone breast implant is compromised, small amounts of silicone can leak into the surrounding tissue and may travel to the surrounding lymph nodes, causing inflammatory or immune responses. Occasionally, the silicone is adjacent to similarly attenuating anatomy and difficult to detect. Dual-energy CT can be used to clearly differentiate these regions of silicone from the surrounding soft tissue (Fig 18) (95).
Figure 18a:

Evaluation of the integrity of silicone breast implants by using unenhanced dual-energy CT in a 65-year-old woman with silicone implants placed in the right breast in 1976 and replaced in the left breast in 1989. (a, b) Axial and (c, d) coronal views demonstrate that silicone and soft tissue have very similar CT numbers in the mixed images (a, c), making it potentially difficult to differentiate a small extracapsular silicone leak from fibroglandular breast tissue. In the material-specific images (b, d), silicone is color coded in red, making it easy to differentiate silicone from soft tissue. Dense or high-atomic-number materials also take on a red tint (eg, cartilage and ribs) in the color-coded image.
Figure 18b:

Evaluation of the integrity of silicone breast implants by using unenhanced dual-energy CT in a 65-year-old woman with silicone implants placed in the right breast in 1976 and replaced in the left breast in 1989. (a, b) Axial and (c, d) coronal views demonstrate that silicone and soft tissue have very similar CT numbers in the mixed images (a, c), making it potentially difficult to differentiate a small extracapsular silicone leak from fibroglandular breast tissue. In the material-specific images (b, d), silicone is color coded in red, making it easy to differentiate silicone from soft tissue. Dense or high-atomic-number materials also take on a red tint (eg, cartilage and ribs) in the color-coded image.
Figure 18c:

Evaluation of the integrity of silicone breast implants by using unenhanced dual-energy CT in a 65-year-old woman with silicone implants placed in the right breast in 1976 and replaced in the left breast in 1989. (a, b) Axial and (c, d) coronal views demonstrate that silicone and soft tissue have very similar CT numbers in the mixed images (a, c), making it potentially difficult to differentiate a small extracapsular silicone leak from fibroglandular breast tissue. In the material-specific images (b, d), silicone is color coded in red, making it easy to differentiate silicone from soft tissue. Dense or high-atomic-number materials also take on a red tint (eg, cartilage and ribs) in the color-coded image.
Figure 18d:

Evaluation of the integrity of silicone breast implants by using unenhanced dual-energy CT in a 65-year-old woman with silicone implants placed in the right breast in 1976 and replaced in the left breast in 1989. (a, b) Axial and (c, d) coronal views demonstrate that silicone and soft tissue have very similar CT numbers in the mixed images (a, c), making it potentially difficult to differentiate a small extracapsular silicone leak from fibroglandular breast tissue. In the material-specific images (b, d), silicone is color coded in red, making it easy to differentiate silicone from soft tissue. Dense or high-atomic-number materials also take on a red tint (eg, cartilage and ribs) in the color-coded image.
Conclusion
In summary, dual-energy and multi-energy CT represent an emerging field of clinical CT imaging. The ability of dual-energy and multi-energy CT to differentiate materials of different effective atomic numbers makes possible several new and clinically relevant CT applications. In approximately 2006–2009, these were limited primarily to automated bone and plaque removal in CT angiography, removal of iodine signal from contrast-enhanced scans, single-phase imaging of perfused blood volume, and identification of tissues having specific elemental compositions (11,96–98). Since that time, additional applications have been developed and prospective clinical trials performed to evaluate the clinical efficacy of these techniques (99). Active research and development in the field is ongoing and is yielding additional or improved clinical applications. The result is that dual- or multi-energy CT is moving firmly into the mainstream of CT imaging. Dual-energy CT may have disappeared from clinical consideration in the 1980s, but with the tremendous technical advances that have taken place since that time, modern CT technology is now capable of taking full advantage of the fundamental physics–and clinical promise–that Godfrey Hounsfield envisioned in 1973.
Essentials
■ Materials having different elemental compositions can be represented by the same CT numbers, making the differentiation and classification of different types of tissues extremely challenging.
■ In dual-energy CT, attenuation measurements obtained at a second energy allow the decomposition of a mixture of two or three materials into its constituent materials.
■ A number of technical approaches exist for acquiring dual-energy data, including sequential acquisition of two different scans, rapid tube potential switching, multilayer detectors, and dual x-ray sources.
■ Energy-resolving, photon-counting detectors represent an emerging approach to acquiring more than two energy measurements; this may provide new applications such as K-edge energy subtraction techniques.
■ A range of current and emerging clinical applications of dual-energy CT exist, including virtual monoenergetic imaging, automated bone removal in CT angiography, perfused blood volume imaging, virtual noncontrast material–enhanced imaging, plaque removal, virtual noncalcium imaging, urinary stone characterization, imaging of crystalline arthropathies, and detection of silicone from breast implants.
Acknowledgments
Acknowledgments
The authors are grateful to Sally J. Reinhart, Xinhui Duan, PhD, and Zhoubo Li, MS, for their assistance in manuscript preparation. The authors are grateful to the many radiologists and physicians at the Mayo Clinic who have contributed to advancing the field of dual-energy CT through their clinical collaborations, and to Terri Vrtiska, MD, Amy Kotsenas, MD, and Katrina Glazebrook, MD, for providing images used in this article.
Footnotes
Received November 12, 2014; revision requested January 2, 2015; revision received February 3; accepted February 19; final version accepted February 24.
Funding: This research was supported by the National Institutes of Health (grants DK083007, DK100227, and EB016966).
The content is solely the responsibility of the authors and does not necessarily represent the official views of the National Institutes of Health.
Disclosures of Conflicts of Interest: C.H.M. Activities related to the present article: disclosed no relevant relationships. Activities not related to the present article: reports grants from Siemens Healthcare. Other relationships: has a patent pending related to noise reduction in spectral CT. S.L. Activities related to the present article: disclosed no relevant relationships. Activities not related to the present article: disclosed no relevant relationships. Other relationships: has a patent pending related to noise reduction in spectral CT. L.Y. Activities related to the present article: disclosed no relevant relationships. Activities not related to the present article: disclosed no relevant relationships. Other relationships: has a patent pending related to noise reduction in spectral CT. J.G.F. Activities related to the present article: disclosed no relevant relationships. Activities not related to the present article: received grants from Siemens Healthcare. Other relationships: has a patent pending related to noise reduction in spectral CT.
References
- 1.Hounsfield GN. Computerized transverse axial scanning (tomography). I. Description of system. Br J Radiol 1973;46(552):1016–1022. [DOI] [PubMed] [Google Scholar]
- 2.Alvarez RE, Macovski A. Energy-selective reconstructions in x-ray computerized tomography. Phys Med Biol 1976;21(5):733–744. [DOI] [PubMed] [Google Scholar]
- 3.Macovski A, Alvarez RE, Chan JL, Stonestrom JP, Zatz LM. Energy dependent reconstruction in x-ray computerized tomography. Comput Biol Med 1976;6(4):325–336. [DOI] [PubMed] [Google Scholar]
- 4.Kalender WA, Klotz E, Suess C. Vertebral bone mineral analysis: an integrated approach with CT. Radiology 1987;164(2):419–423. [DOI] [PubMed] [Google Scholar]
- 5.Kalender WA, Perman WH, Vetter JR, Klotz E. Evaluation of a prototype dual-energy computed tomographic apparatus. I. Phantom studies. Med Phys 1986;13(3):334–339. [DOI] [PubMed] [Google Scholar]
- 6.Ergun DL, Mistretta CA, Brown DE, et al. Single-exposure dual-energy computed radiography: improved detection and processing. Radiology 1990;174(1):243–249. [DOI] [PubMed] [Google Scholar]
- 7.Ishigaki T, Sakuma S, Ikeda M. One-shot dual-energy subtraction chest imaging with computed radiography: clinical evaluation of film images. Radiology 1988;168(1):67–72. [DOI] [PubMed] [Google Scholar]
- 8.Stewart BK, Huang HK. Single-exposure dual-energy computed radiography. Med Phys 1990;17(5):866–875. [DOI] [PubMed] [Google Scholar]
- 9.Carmi R, Naveh G, Altman A. Material separation with dual-layer CT. IEEE Nuclear Science Symposium Conference Record 2005;4:1876–1878. [Google Scholar]
- 10.Flohr TG, McCollough CH, Bruder H, et al. First performance evaluation of a dual-source CT (DSCT) system. Eur Radiol 2006;16(2):256–268. [DOI] [PubMed] [Google Scholar]
- 11.Johnson TR, Krauss B, Sedlmair M, et al. Material differentiation by dual energy CT: initial experience. Eur Radiol 2007;17(6):1510–1517. [DOI] [PubMed] [Google Scholar]
- 12.Petersilka M, Stierstorfer K, Bruder H, Flohr T. Strategies for scatter correction in dual source CT. Med Phys 2010;37(11):5971–5992. [DOI] [PubMed] [Google Scholar]
- 13.Kelcz F, Joseph PM, Hilal SK. Noise considerations in dual energy CT scanning. Med Phys 1979;6(5):418–425. [DOI] [PubMed] [Google Scholar]
- 14.Primak AN, Ramirez Giraldo JC, Liu X, Yu L, McCollough CH. Improved dual-energy material discrimination for dual-source CT by means of additional spectral filtration. Med Phys 2009;36(4):1359–1369. [DOI] [PMC free article] [PubMed] [Google Scholar]
- 15.Schlomka JP, Roessl E, Dorscheid R, et al. Experimental feasibility of multi-energy photon-counting K-edge imaging in pre-clinical computed tomography. Phys Med Biol 2008;53(15):4031–4047. [DOI] [PubMed] [Google Scholar]
- 16.Shikhaliev PM. Energy-resolved computed tomography: first experimental results. Phys Med Biol 2008;53(20):5595–5613. [DOI] [PubMed] [Google Scholar]
- 17.Taguchi K, Iwanczyk JS. Vision 20/20: single photon counting x-ray detectors in medical imaging. Med Phys 2013;40(10):100901. [DOI] [PMC free article] [PubMed] [Google Scholar]
- 18.Szeles C, Soldner SA, Vydrin S, Graves J, Bale DS. CdZnTe semiconductor detectors for spectroscopic x-ray imaging. IEEE Trans Nucl Sci 2008;55(1):572–582. [Google Scholar]
- 19.Kappler S, Glasser F, Janssen S, Kraft E, Reinwand M. A research prototype system for quantum-counting clinical CT. In: Samei E, Pelc NJ, eds. Proceedings of SPIE: medical imaging 2010—physics of medical imaging. Vol 7622. Bellingham, Wash: International Society for Optics and Photonics, 2010; 76221Z. [Google Scholar]
- 20.Taguchi K, Frey EC, Wang X, Iwanczyk JS, Barber WC. An analytical model of the effects of pulse pileup on the energy spectrum recorded by energy resolved photon counting x-ray detectors. Med Phys 2010;37(8):3957–3969. [DOI] [PMC free article] [PubMed] [Google Scholar]
- 21.Wielopolski L, Gardner RP. Prediction of the pulse-height spectral distortion caused by the peak pile-up effect. Nucl Instrum Methods 1976;133(2):303–309. [Google Scholar]
- 22.Koenig T, Schulze J, Zuber M, et al. Imaging properties of small-pixel spectroscopic x-ray detectors based on cadmium telluride sensors. Phys Med Biol 2012;57(21):6743–6759. [DOI] [PubMed] [Google Scholar]
- 23.Ponchut C. Correction of the charge sharing in photon-counting pixel detector data. Nucl Instrum Methods Phys Res A 2008;591(1):311–313. [Google Scholar]
- 24.Shikhaliev PM, Fritz SG, Chapman JW. Photon counting multienergy x-ray imaging: effect of the characteristic x rays on detector performance. Med Phys 2009;36(11):5107–5119. [DOI] [PubMed] [Google Scholar]
- 25.Ballabriga R, Alozy J, Blaj G, et al. The Medipix3RX: a high resolution, zero dead-time pixel detector readout chip allowing spectroscopic imaging. J Instrum 2013;8(02):C02016. [Google Scholar]
- 26.Koenig T, Hamann E, Procz S, et al. Charge summing in spectroscopic x-ray detectors with high-Z sensors. IEEE Trans Nucl Sci 2013;60(6):4713–4718. [Google Scholar]
- 27.McCollough CH, Chen GH, Kalender W, et al. Achieving routine submillisievert CT scanning: report from the summit on management of radiation dose in CT. Radiology 2012;264(2):567–580. [DOI] [PMC free article] [PubMed] [Google Scholar]
- 28.Lehmann LA, Alvarez RE, Macovski A, et al. Generalized image combinations in dual KVP digital radiography. Med Phys 1981;8(5):659–667. [DOI] [PubMed] [Google Scholar]
- 29.Goodsitt MM, Christodoulou EG, Larson SC. Accuracies of the synthesized monochromatic CT numbers and effective atomic numbers obtained with a rapid kVp switching dual energy CT scanner. Med Phys 2011;38(4):2222–2232. [DOI] [PubMed] [Google Scholar]
- 30.Heismann BJ, Leppert J, Stierstorfer K. Density and atomic number measurements with spectral x-ray attenuation method. J Appl Phys 2003;94(3):2073–2079. [Google Scholar]
- 31.Liu X, Yu L, Primak AN, McCollough CH. Quantitative imaging of element composition and mass fraction using dual-energy CT: three-material decomposition. Med Phys 2009;36(5):1602–1609. [DOI] [PMC free article] [PubMed] [Google Scholar]
- 32.Kyriakou Y, Meyer E, Prell D, Kachelriess M. Empirical beam hardening correction (EBHC) for CT. Med Phys 2010;37(10):5179–5187. [DOI] [PubMed] [Google Scholar]
- 33.Feuerlein S, Roessl E, Proksa R, et al. Multienergy photon-counting K-edge imaging: potential for improved luminal depiction in vascular imaging. Radiology 2008;249(3):1010–1016. [DOI] [PubMed] [Google Scholar]
- 34.Firsching M, Butler AP, Scott N, Anderson NG, Michel T, Anton G. Contrast agent recognition in small animal CT using the Medipix2 detector. Nucl Instrum Methods Phys Res A 2009;607(1):179–182. [Google Scholar]
- 35.Firsching M, Giersch J, Niederlohner D, Anton G. A method for stoichiometric material reconstruction with spectroscopic X-ray pixel detectors. IEEE Nuclear Science Symposium. Rome, 2004; 4116–4119. [Google Scholar]
- 36.Roessl E, Proksa R. K-edge imaging in x-ray computed tomography using multi-bin photon counting detectors. Phys Med Biol 2007;52(15):4679–4696. [DOI] [PubMed] [Google Scholar]
- 37.Cormode DP, Roessl E, Thran A, et al. Atherosclerotic plaque composition: analysis with multicolor CT and targeted gold nanoparticles. Radiology 2010;256(3):774–782. [DOI] [PMC free article] [PubMed] [Google Scholar]
- 38.Roessl E, Herrmann C. Cramér-Rao lower bound of basis image noise in multiple-energy x-ray imaging. Phys Med Biol 2009;54(5):1307–1318. [DOI] [PubMed] [Google Scholar]
- 39.Wang AS, Pelc NJ. Optimal energy thresholds and weights for separating materials using photon counting x-ray detectors with energy discriminating capabilities. In: Samei E, Hsieh J, eds. Proceedings of SPIE: medical imaging 2009—physics of medical imaging. Vol 7258. Bellingham, Wash: International Society for Optics and Photonics, 2009; 725821. [Google Scholar]
- 40.Wang AS, Pelc NJ. Sufficient statistics as a generalization of binning in spectral x-ray imaging. IEEE Trans Med Imaging 2011;30(1):84–93. [DOI] [PubMed] [Google Scholar]
- 41.Le HQ, Molloi S. Segmentation and quantification of materials with energy discriminating computed tomography: a phantom study. Med Phys 2011;38(1):228–237. [DOI] [PMC free article] [PubMed] [Google Scholar]
- 42.Le Huy Q, Molloi S. Least squares parameter estimation methods for material decomposition with energy discriminating detectors. Med Phys 2011;38(1):245–255. [DOI] [PMC free article] [PubMed] [Google Scholar]
- 43.Qu M, Jaramillo-Alvarez G, Ramirez-Giraldo JC, et al. Urinary stone differentiation in patients with large body size using dual-energy dual-source computed tomography. Eur Radiol 2013;23(5):1408–1414. [DOI] [PMC free article] [PubMed] [Google Scholar]
- 44.Leng S, Yu L, Wang J, Fletcher JG, Mistretta CA, McCollough CH. Noise reduction in spectral CT: reducing dose and breaking the trade-off between image noise and energy bin selection. Med Phys 2011;38(9):4946–4957. [DOI] [PubMed] [Google Scholar]
- 45.Leng S. Energy domain noise reduction: techniques and applications in spectral CT. South Korea: IEEE NSS/MIC Seoul, 2013. [Google Scholar]
- 46.Leng S, Christner J, Yu L, McCollough C. Application of an energy domain noise reduction technique to virtual monoenergetic images: image quality assessment and comparison with single energy CT. [abstr]. In: Radiological Society of North America Scientific Assembly and Annual Meeting Program. Oak Brook, Ill: Radiological Society of North America, 2012; 201. [Google Scholar]
- 47.McCollough C, Leng S, Wang J, Yu L, Fletcher J, Mistretta C. Noise reduction in spectral CT: reducing dose and breaking the trade-off between image noise and energy bin selection. Workshop on Medical Applications of Spectroscopic X-ray Detectors. Geneva, Switzerland: European Council for Nuclear Research, 2011. [DOI] [PubMed] [Google Scholar]
- 48.Wang J, Leng S, Duan X, Yu L, McCollough C. Noise reduction on basis material images with HYPR-LR in photon counting x-ray imaging. [abstr]. In: Radiological Society of North America Scientific Assembly and Annual Meeting Program. Oak Brook, Ill: Radiological Society of North America, 2011; 155. [Google Scholar]
- 49.Cao Q, Brosnan T, Macovski A, Nishimura D. Least squares approach in measurement-dependent filtering for selective medical images. IEEE Trans Med Imaging 1988;7(2):154–160. [DOI] [PubMed] [Google Scholar]
- 50.Macovski A. Physical problems of computerized-tomography. Proc IEEE 1983;71(3):373–378. [Google Scholar]
- 51.Kalender WA, Klotz E, Kostaridou L. An algorithm for noise suppression in dual energy CT material density images. IEEE Trans Med Imaging 1988;7(3):218–224. [DOI] [PubMed] [Google Scholar]
- 52.McCollough CH, Van Lysel MS, Peppler WW, Mistretta CA. A correlated noise reduction algorithm for dual-energy digital subtraction angiography. Med Phys 1989;16(6):873–880. [DOI] [PubMed] [Google Scholar]
- 53.Chen GH, Tang J, Leng S. Prior image constrained compressed sensing (PICCS): a method to accurately reconstruct dynamic CT images from highly undersampled projection data sets. Med Phys 2008;35(2):660–663. [DOI] [PMC free article] [PubMed] [Google Scholar]
- 54.Ramírez-Giraldo J, Trzasko J, Leng S, McCollough C, Manduca A. Non-convex prior image constrained compressed sensing (NC-PICCS). In: Samei E, Pelc NJ, eds. Proceedings of SPIE: medical imaging 2010—physics of medical imaging. Vol 7622. Bellingham, Wash: International Society for Optics and Photonics, 2010; 76222C. [Google Scholar]
- 55.Gao H, Yu H, Osher S, Wang G. Multi-energy CT based on a prior rank, intensity and sparsity model (PRISM). Inverse Probl 2011;27(11). [DOI] [PMC free article] [PubMed] [Google Scholar]
- 56.Pomerantz SR, Kamalian S, Zhang D, et al. Virtual monochromatic reconstruction of dual-energy unenhanced head CT at 65-75 keV maximizes image quality compared with conventional polychromatic CT. Radiology 2013;266(1):318–325. [DOI] [PubMed] [Google Scholar]
- 57.Srinivasan A, Hoeffner E, Ibrahim M, Shah GV, LaMarca F, Mukherji SK. Utility of dual-energy CT virtual keV monochromatic series for the assessment of spinal transpedicular hardware-bone interface. AJR Am J Roentgenol 2013;201(4):878–883. [DOI] [PubMed] [Google Scholar]
- 58.Yamada Y, Jinzaki M, Tanami Y, Abe T, Kuribayashi S. Virtual monochromatic spectral imaging for the evaluation of hypovascular hepatic metastases: the optimal monochromatic level with fast kilovoltage switching dual-energy computed tomography. Invest Radiol 2012;47(5):292–298. [DOI] [PubMed] [Google Scholar]
- 59.Yu L, Christner JA, Leng S, Wang J, Fletcher JG, McCollough CH. Virtual monochromatic imaging in dual-source dual-energy CT: radiation dose and image quality. Med Phys 2011;38(12):6371–6379. [DOI] [PMC free article] [PubMed] [Google Scholar]
- 60.Yu L, Leng S, McCollough CH. Dual-energy CT-based monochromatic imaging. AJR Am J Roentgenol 2012;199(5 Suppl):S9–S15. [DOI] [PubMed] [Google Scholar]
- 61.Yuan R, Shuman WP, Earls JP, et al. Reduced iodine load at CT pulmonary angiography with dual-energy monochromatic imaging: comparison with standard CT pulmonary angiography—a prospective randomized trial. Radiology 2012;262(1):290–297. [DOI] [PubMed] [Google Scholar]
- 62.Buerke B, Wittkamp G, Seifarth H, Heindel W, Kloska SP. Dual-energy CTA with bone removal for transcranial arteries: intraindividual comparison with standard CTA without bone removal and TOF-MRA. Acad Radiol 2009;16(11):1348–1355. [DOI] [PubMed] [Google Scholar]
- 63.Morhard D, Fink C, Graser A, Reiser MF, Becker C, Johnson TR. Cervical and cranial computed tomographic angiography with automated bone removal: dual energy computed tomography versus standard computed tomography. Invest Radiol 2009;44(5):293–297. [DOI] [PubMed] [Google Scholar]
- 64.Schulz B, Kuehling K, Kromen W, et al. Automatic bone removal technique in whole-body dual-energy CT angiography: performance and image quality. AJR Am J Roentgenol 2012;199(5):W646–W650. [DOI] [PubMed] [Google Scholar]
- 65.Sommer WH, Johnson TR, Becker CR, et al. The value of dual-energy bone removal in maximum intensity projections of lower extremity computed tomography angiography. Invest Radiol 2009;44(5):285–292. [DOI] [PubMed] [Google Scholar]
- 66.Goo HW. Initial experience of dual-energy lung perfusion CT using a dual-source CT system in children. Pediatr Radiol 2010;40(9):1536–1544. [DOI] [PubMed] [Google Scholar]
- 67.Pontana F, Faivre JB, Remy-Jardin M, et al. Lung perfusion with dual-energy multidetector-row CT (MDCT): feasibility for the evaluation of acute pulmonary embolism in 117 consecutive patients. Acad Radiol 2008;15(12):1494–1504. [DOI] [PubMed] [Google Scholar]
- 68.Thieme SF, Becker CR, Hacker M, Nikolaou K, Reiser MF, Johnson TR. Dual energy CT for the assessment of lung perfusion: correlation to scintigraphy. Eur J Radiol 2008;68(3):369–374. [DOI] [PubMed] [Google Scholar]
- 69.Thieme SF, Graute V, Nikolaou K, et al. Dual energy CT lung perfusion imaging: correlation with SPECT/CT. Eur J Radiol 2012;81(2):360–365. [DOI] [PubMed] [Google Scholar]
- 70.Zhang LJ, Zhou CS, Schoepf UJ, et al. Dual-energy CT lung ventilation/perfusion imaging for diagnosing pulmonary embolism. Eur Radiol 2013;23(10):2666–2675. [DOI] [PubMed] [Google Scholar]
- 71.Johnson TR, Nikolaou K, Wintersperger BJ, et al. Dual-source CT cardiac imaging: initial experience. Eur Radiol 2006;16(7):1409–1415. [DOI] [PubMed] [Google Scholar]
- 72.Meinel FG, De Cecco CN, Schoepf UJ, et al. First-arterial-pass dual-energy CT for assessment of myocardial blood supply: do we need rest, stress, and delayed acquisition? —comparison with SPECT. Radiology 2014;270(3):708–716. [DOI] [PubMed] [Google Scholar]
- 73.Ruzsics B, Chiaramida SA, Schoepf UJ. Images in cardiology: dual-energy computed tomography imaging of myocardial infarction. Heart 2009;95(3):180. [DOI] [PubMed] [Google Scholar]
- 74.Ruzsics B, Lee H, Powers ER, Flohr TG, Costello P, Schoepf UJ. Images in cardiovascular medicine: myocardial ischemia diagnosed by dual-energy computed tomography: correlation with single-photon emission computed tomography. Circulation 2008;117(9):1244–1245. [DOI] [PubMed] [Google Scholar]
- 75.Wichmann JL, Bauer RW, Doss M, et al. Diagnostic accuracy of late iodine-enhancement dual-energy computed tomography for the detection of chronic myocardial infarction compared with late gadolinium-enhancement 3-T magnetic resonance imaging. Invest Radiol 2013;48(12):851–856. [DOI] [PubMed] [Google Scholar]
- 76.Ferda J, Novák M, Mírka H, et al. The assessment of intracranial bleeding with virtual unenhanced imaging by means of dual-energy CT angiography. Eur Radiol 2009;19(10):2518–2522. [DOI] [PubMed] [Google Scholar]
- 77.Graser A, Johnson TR, Hecht EM, et al. Dual-energy CT in patients suspected of having renal masses: can virtual nonenhanced images replace true nonenhanced images? Radiology 2009;252(2):433–440. [DOI] [PubMed] [Google Scholar]
- 78.Ho LM, Marin D, Neville AM, et al. Characterization of adrenal nodules with dual-energy CT: can virtual unenhanced attenuation values replace true unenhanced attenuation values? AJR Am J Roentgenol 2012;198(4):840–845. [DOI] [PubMed] [Google Scholar]
- 79.Mangold S, Thomas C, Fenchel M, et al. Virtual nonenhanced dual-energy CT urography with tin-filter technology: determinants of detection of urinary calculi in the renal collecting system. Radiology 2012;264(1):119–125. [DOI] [PubMed] [Google Scholar]
- 80.Phan CM, Yoo AJ, Hirsch JA, Nogueira RG, Gupta R. Differentiation of hemorrhage from iodinated contrast in different intracranial compartments using dual-energy head CT. AJNR Am J Neuroradiol 2012;33(6):1088–1094. [DOI] [PMC free article] [PubMed] [Google Scholar]
- 81.Takahashi N, Hartman RP, Vrtiska TJ, et al. Dual-energy CT iodine-subtraction virtual unenhanced technique to detect urinary stones in an iodine-filled collecting system: a phantom study. AJR Am J Roentgenol 2008;190(5):1169–1173. [DOI] [PMC free article] [PubMed] [Google Scholar]
- 82.Toepker M, Moritz T, Krauss B, et al. Virtual non-contrast in second-generation, dual-energy computed tomography: reliability of attenuation values. Eur J Radiol 2012;81(3):e398–e405. [DOI] [PubMed] [Google Scholar]
- 83.Takahashi N, Vrtiska TJ, Kawashima A, et al. Detectability of urinary stones on virtual nonenhanced images generated at pyelographic-phase dual-energy CT. Radiology 2010;256(1):184–190. [DOI] [PMC free article] [PubMed] [Google Scholar]
- 84.Korn A, Bender B, Thomas C, et al. Dual energy CTA of the carotid bifurcation: advantage of plaque subtraction for assessment of grade of the stenosis and morphology. Eur J Radiol 2011;80(2):e120–e125. [DOI] [PubMed] [Google Scholar]
- 85.Meyer BC, Werncke T, Hopfenmüller W, Raatschen HJ, Wolf KJ, Albrecht T. Dual energy CT of peripheral arteries: effect of automatic bone and plaque removal on image quality and grading of stenoses. Eur J Radiol 2008;68(3):414–422. [DOI] [PubMed] [Google Scholar]
- 86.Uotani K, Watanabe Y, Higashi M, et al. Dual-energy CT head bone and hard plaque removal for quantification of calcified carotid stenosis: utility and comparison with digital subtraction angiography. Eur Radiol 2009;19(8):2060–2065. [DOI] [PubMed] [Google Scholar]
- 87.Pache G, Krauss B, Strohm P, et al. Dual-energy CT virtual noncalcium technique: detecting posttraumatic bone marrow lesions—feasibility study. Radiology 2010;256(2):617–624. [DOI] [PubMed] [Google Scholar]
- 88.Primak AN, Fletcher JG, Vrtiska TJ, et al. Noninvasive differentiation of uric acid versus non-uric acid kidney stones using dual-energy CT. Acad Radiol 2007;14(12):1441–1447. [DOI] [PMC free article] [PubMed] [Google Scholar]
- 89.Ascenti G, Siragusa C, Racchiusa S, et al. Stone-targeted dual-energy CT: a new diagnostic approach to urinary calculosis. AJR Am J Roentgenol 2010;195(4):953–958. [DOI] [PubMed] [Google Scholar]
- 90.Boll DT, Patil NA, Paulson EK, et al. Renal stone assessment with dual-energy multidetector CT and advanced postprocessing techniques: improved characterization of renal stone composition—pilot study. Radiology 2009;250(3):813–820. [DOI] [PubMed] [Google Scholar]
- 91.Qu M, Ramirez-Giraldo JC, Leng S, et al. Dual-energy dual-source CT with additional spectral filtration can improve the differentiation of non-uric acid renal stones: an ex vivo phantom study. AJR Am J Roentgenol 2011;196(6):1279–1287. [DOI] [PMC free article] [PubMed] [Google Scholar]
- 92.Zilberman DE, Ferrandino MN, Preminger GM, Paulson EK, Lipkin ME, Boll DT. In vivo determination of urinary stone composition using dual energy computerized tomography with advanced post-acquisition processing. J Urol 2010;184(6):2354–2359. [DOI] [PubMed] [Google Scholar]
- 93.Leng S, Shiung M, Ai S, et al. Feasibility of discriminating uric acid from non-uric acid renal stones using consecutive spatially registered low- and high-energy scans obtained on a conventional CT scanner. AJR Am J Roentgenol 2015;204(1):92–97. [DOI] [PMC free article] [PubMed] [Google Scholar]
- 94.Glazebrook KN, Guimarães LS, Murthy NS, et al. Identification of intraarticular and periarticular uric acid crystals with dual-energy CT: initial evaluation. Radiology 2011;261(2):516–524. [DOI] [PubMed] [Google Scholar]
- 95.Johnson TR, Himsl I, Hellerhoff K, et al. Dual-energy CT for the evaluation of silicone breast implants. Eur Radiol 2013;23(4):991–996. [DOI] [PubMed] [Google Scholar]
- 96.Karçaaltıncaba M, Aktaş A. Dual-energy CT revisited with multidetector CT: review of principles and clinical applications. Diagn Interv Radiol 2011;17(3):181–194. [DOI] [PubMed] [Google Scholar]
- 97.Fornaro J, Leschka S, Hibbeln D, et al. Dual- and multi-energy CT: approach to functional imaging. Insights Imaging 2011;2(2):149–159. [DOI] [PMC free article] [PubMed] [Google Scholar]
- 98.Rebuffel V, Dinten JM. Dual-energy x-ray imaging: benefits and limits. Insight 2007;49(10):589–594. [Google Scholar]
- 99.Johnson TR. Dual-energy CT: general principles. AJR Am J Roentgenol 2012;199(5 Suppl):S3–S8. [DOI] [PubMed] [Google Scholar]