Abstract
Autophagy is a major catabolic process responsible for the delivery of proteins and organelles to the lysosome/vacuole for degradation. Malfunction of this pathway has been implicated in numerous pathological conditions. Different organelles have been found to contribute to the formation of autophagosomes, but the exact mechanism mediating this process remains obscure. Here, we show that lipid droplets (LDs) are important for the regulation of starvation-induced autophagy. Deletion of Dga1 and Lro1 enzymes responsible for triacylglycerol (TAG) synthesis, or of Are1 and Are2 enzymes responsible for the synthesis of steryl esters (STE), results in the inhibition of autophagy. Moreover, we identified the STE hydrolase Yeh1 and the TAG lipase Ayr1 as well as the lipase/hydrolase Ldh1 as essential for autophagy. Finally, we provide evidence that the ER-LD contact-site proteins Ice2 and Ldb16 regulate autophagy. Our study thus highlights the importance of lipid droplet dynamics for the autophagic process under nitrogen starvation.
Keywords: Atg8, autophagosome biogenesis, autophagy, fatty acid synthase, lipid droplets
See also: V Deretic (August 2015)
Introduction
Autophagy is an evolutionarily conserved physiological process for the degradation of proteins and organelles in the lysosome/vacuole of the cell, thereby contributing to the maintenance of cell homeostasis (Weidberg et al, 2011). Dysregulation of this catabolic pathway has been implicated in numerous pathological conditions and metabolic diseases (Ravikumar et al, 2010b; Abada & Elazar, 2014).
Autophagy starts with formation of the phagophore, a cup-shaped vesicle that elongates and enwraps parts of the cytoplasm including organelles, and seals itself to form a unique double-membrane structure termed the autophagosome (Weidberg et al, 2011). Several organelles including the endoplasmic reticulum (ER) (Axe et al, 2008; Hayashi-Nishino et al, 2009), mitochondria (Hailey et al, 2010), and Golgi apparatus (Young et al, 2006; Mari et al, 2010; Nair et al, 2011), as well as the plasma membrane (Ravikumar et al, 2010a), were recently reported to contribute to formation of the autophagosome (Rubinsztein et al, 2012; Abada & Elazar, 2014). Numerous autophagy-related proteins (Atgs) are essential for autophagosome biogenesis. In yeast, the site of autophagosome biogenesis is the pre-autophagosomal structure (PAS). Upon induction of autophagy, Atgs are hierarchically recruited to the PAS (Suzuki et al, 2007). The Atg1 kinase complex, the class III phosphoinositide 3-kinase (PI3K) complex, and Atg9 are required at early stages of phagophore formation, whereas the Atg12-Atg5-Atg16 complex and Atg8 are recruited at later stages. Atg8 is a key player in autophagosome formation and is regulated by several essential autophagy factors that enable it to conjugate to phosphatidylethanolamine (PE) on the autophagic membrane (Kirisako et al, 2000; Suzuki et al, 2001; Hanada et al, 2007; Shpilka et al, 2012). Conjugation of Atg8 to PE is a hallmark event in autophagy and is widely utilized to assess autophagic activity (Klionsky et al, 2007; Shpilka et al, 2012).
Lipid droplets (LDs) are organelles that store neutral lipids. They are found in most organisms and cell types (Walther & Farese, 2012) and are most probably formed in the ER (Fujimoto et al, 2008; Jacquier et al, 2011). They are comprised of a neutral lipid core that predominantly contains triacylglycerols (TAGs) and steryl esters (STEs) and is surrounded by a phospholipid monolayer and a specific set of proteins (Rajakumari et al, 2008; Farese & Walther, 2009; Walther & Farese, 2012). In yeasts, STE synthesis requires the activity of two acyl-CoA:sterol acyltransferases, Are1 and Are2 (Jensen-Pergakes et al, 2001), while the enzymes mainly responsible for the synthesis of TAG are the diacylglycerol acyltransferases Dga1 and Lro1 (Sorger & Daum, 2002). Yeast strains devoid of all four enzymes lack LDs (Sandager et al, 2002). LDs serve important functions in the cell by providing lipids and energy as well as by storing free fatty acids that may otherwise become cytotoxic (Beller et al, 2010).
Recent studies point to a complex interplay between autophagy and LDs. On the one hand, LDs are degraded by autophagy via lipophagy (Singh et al, 2009; Wang et al, 2014b; van Zutphen et al, 2014), while, on the other hand, LDs have been implicated in regulation of the autophagic process in mammals (Dupont et al, 2014). In the present study, we utilized the yeast system to investigate the roles of LDs in autophagy. We show that LDs and their component STEs and TAGs are important for autophagosome biogenesis. Deletion of biosynthetic enzymes of STEs and of TAGs has opposite effects on the lipidation state of Atg8, suggesting novel and complementary roles for these neutral lipids in regulation of the autophagic process. Moreover, we identified the TAG and the STE lipases that participate in the autophagic process and found that the ER-LD contact-site proteins Ldb16 and Ice2, which couple LD lipolysis to phospholipid formation in the ER, are also needed. Our results point to a novel role for neutral lipids in regulation of the autophagic process.
Results
Autophagy is inhibited upon depletion of free fatty acids
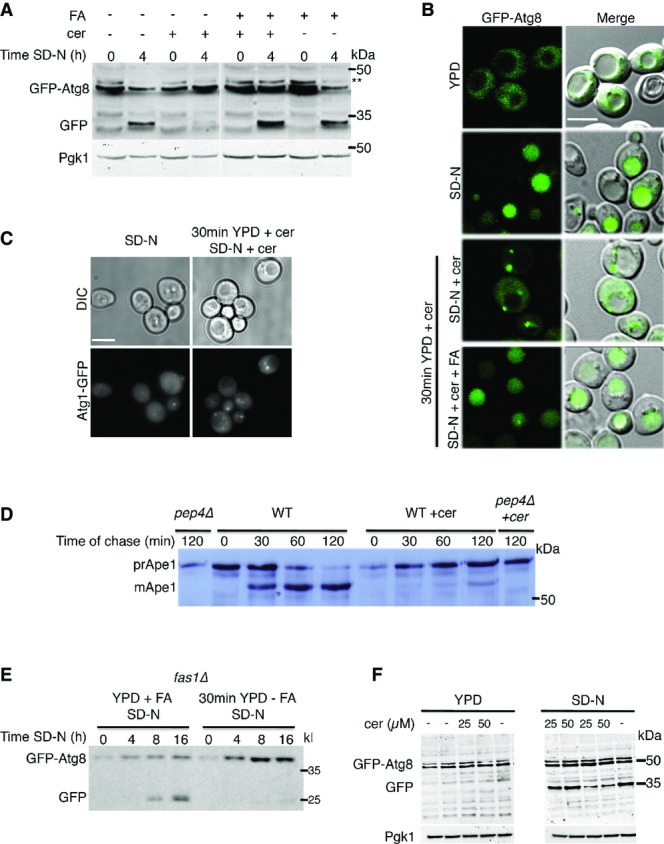
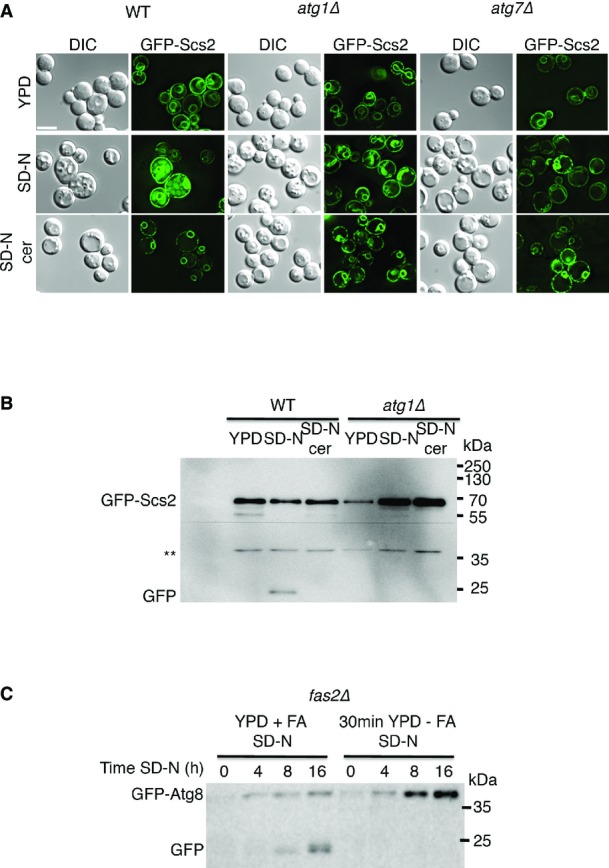
We first set out to characterize the role of fatty acid synthesis in autophagosome biogenesis. To this end, we utilized the antifungal antibiotic cerulenin that binds to and inhibits the activity of fatty acid synthase (FAS), the enzyme responsible for the entire synthesis of C16 and C18 fatty acids (Vance et al, 1972; Wakil et al, 1983). Cells were grown to mid-log phase in complete medium (YPD; Materials and Methods) and prior to nitrogen starvation were mock-treated or treated for 30 min with cerulenin. Delivery of green fluorescent protein (GFP)-tagged Atg8 to vacuoles was monitored by the GFP-cleavage assay (Shintani & Klionsky, 2004) and fluorescence microscopy. Upon delivery of GFP-tagged proteins to the vacuole, the proteins are degraded while GFP remains relatively stable, enabling delivery of the tagged protein to the vacuole to be assessed (Shintani & Klionsky, 2004). Under nitrogen starvation, GFP-Atg8 was readily delivered to the vacuoles in mock-treated cells, but its delivery was blocked in cells treated with cerulenin (Fig1A). Addition of exogenous fatty acid to the cerulenin-treated cells reversed the autophagic defect, supporting the need for fatty acids in the autophagic process (Fig1A). Fluorescence imaging of cerulenin-treated cells demonstrated the failure of Atg8 to reach the vacuole and its accumulation in puncta (Fig1B). This phenotype could be rescued by the addition of fatty acids (Fig1B). Inhibition of autophagy by cerulenin was further tested with the autophagy kinase Atg1. In line with a previous report (Nakatogawa et al, 2012b), under nitrogen starvation, GFP-Atg1 localized to the vacuole and to a single punctum (presumably the PAS). In contrast, treatment of the cells with cerulenin led to accumulation of Atg1 in the cytosol in multiple puncta (Fig1C). Cerulenin treatment also inhibited the delivery of the ER protein Scs2 for degradation, suggesting fatty acid synthesis is also needed for ERphagy (Fig EV1A and B).
Figure 1.
Autophagy is inhibited upon depletion of free fatty acids
- A, B Wild-type (WT) (BY4741) cells expressing GFP-Atg8 were grown to mid-log phase in YPD and were then preincubated with 50 μM cerulenin or 50 μM cerulenin + 0.1 mM palmitic/stearic/myristic acids or with DMSO (−) in the rich medium for 30 min. Cells were washed and shifted to nitrogen starvation medium (SD-N) for 4 h in the presence of 50 μM cerulenin or 50 μM cerulenin + 0.1 mM palmitic/stearic/myristic acids or DMSO. Cells were then lysed and subjected to SDS–PAGE, followed by Western blot analysis using anti-GFP and anti-Pgk1 antibodies (A) or were visualized by fluorescence microscopy (B). Scale bar, 5 μm; **, non-specific band.
- C Cells (TOS038) expressing Atg1-GFP were grown to mid-log phase and were then preincubated in YPD with 50 μM cerulenin or with DMSO for 30 min. Cells were washed, shifted to SD-N for 4 h, and then visualized by fluorescence microscopy. Scale bar, 5 μm.
- D WT (BY4741) and pep4Δ (TOS015) strains were grown to mid-log phase and preincubated in YPD with cerulenin or DMSO for 30 min. Cells were pulse-labeled for 10 min with [35S] methionine and cysteine and chased for the indicated time periods. Cell lysates were subjected to immunoprecipitation with anti-Ape1 antibodies followed by SDS–PAGE and X-ray film to detect radioactive signals. prApe1, premature Ape1; mApe1, mature Ape1.
- E Cells of the fas1Δ (TOS029) strain expressing GFP-Atg8 were grown to mid-log phase in YPD + 0.1 mM palmitic/stearic/myristic acids and shifted either to the same medium or to YPD without fatty acids for 30 min. Cells were then shifted to SD-N for the indicated times. Cell lysates were subjected to SDS–PAGE, followed by Western blot analysis using anti-GFP antibodies.
- F WT (BY4741) cells were grown to mid-log phase and then preincubated in YPD with 25 μM or 50 μM cerulenin (25, 50) or with DMSO (−) in rich medium for 30 min. Cells were washed and shifted to SD-N in the presence of cerulenin (25, 50) or DMSO (−). Cells were lysed and subjected to SDS–PAGE, followed by Western blot analysis using anti-GFP and anti-Pgk1 antibodies.
Data information: cer, cerulenin; DIC, differential interference contrast; FA, fatty acids; SD-N, nitrogen starvation medium; WT, wild type; YPD, complete medium. Source data are available online for this figure.
Autophagy is inhibited upon depletion of free fatty acids
- WT (BY4741), atg1Δ (TOS001), and atg7Δ (TOS005) cells expressing GFP-Scs2 were grown to mid-log phase in YPD and shifted to SD-N for 12 h in the presence (SD-N cer) or absence (SD-N) of 50 μM cerulenin and visualized by fluorescence microscopy. Scale bar, 5 μm.
- WT (BY4741) and atg1Δ (TOS001) cells were grown as in (A). Lysates were subjected to SDS–PAGE, followed by Western blot analysis using anti-GFP antibodies. **, non-specific band.
- fas2Δ (TOS030) cells expressing GFP-Atg8 were grown to mid-log phase in YPD + 0.1 mM palmitic/stearic/myristic acids and shifted either to the same medium or to YPD without fatty acids for 30 min. The cells were then shifted to SD-N for the indicated time periods. Cell lysates were subjected to SDS–PAGE, followed by Western blot analysis using anti-GFP antibodies.
Data information: cer, cerulenin; SD-N, nitrogen starvation medium; WT, wild type; YPD, complete medium.
Cytoplasm-to-vacuole targeting (CVT) is a selective pathway in which the autophagic machinery is utilized to deliver, under vegetative growth conditions, enzymes such as aminopeptidase 1 (Ape1) to the vacuole (Lynch-Day & Klionsky, 2010). Using pulse–chase analysis of radiolabeled Ape1, we examined whether the CVT pathway is also blocked by cerulenin. As a control, we used pep4Δ strains that are incapable of maturing Ape1 (Fig1D) (Lynch-Day & Klionsky, 2010). In untreated wild-type (WT) cells, Ape1 was readily processed and matured, whereas it failed to mature upon cerulenin treatment, suggesting that FAS activity is essential for CVT (Fig1D).
Fatty acid synthase is an essential enzymatic complex composed of two subunits, Fas1 and Fas2 (Henry, 1973; Lomakin et al, 2007) To further characterize the effect of FAS inhibition on autophagy, we utilized deletion strains of FAS, which are able to grow only in rich medium supplemented with fatty acids (Schweizer & Bolling, 1970; Henry, 1973). Using the GFP-cleavage assay, we monitored autophagic activity in fas1Δ and fas2Δ strains expressing GFP-Atg8 under the endogenous promoter. Depletion of fatty acids from these cells by allowing them to grow for 30 min in the absence of exogenous fatty acids prior to nitrogen starvation prevented the degradation of GFP-Atg8 (Figs1E and EV1C). Depletion of fatty acids prior to nitrogen starvation was essential for the inhibition of autophagy, as shown by the finding that fas1Δ and fas2Δ cells subjected directly to nitrogen starvation (without preincubation in rich medium lacking fatty acids) exhibited normal autophagic activity (Figs1E and EV1). Cerulenin was also able to block the autophagy process only in cells that were exposed to such preincubation prior to nitrogen starvation (Fig1F).
Lipid droplets are essential for efficient autophagy
To better characterize the role of fatty acids in the autophagic process we measured autophagic activity by the Pho8Δ60 assay (Noda & Klionsky, 2008) in the presence or absence of cerulenin. Pho8Δ60, a genetically engineered version of the resident vacuolar enzyme Pho8, lacks the N-terminal transmembrane domain that enables translocation of this enzyme into the ER. It therefore accumulates in the cytosol and can be delivered to the vacuole only by autophagy (Noda & Klionsky, 2008). Cells were grown in complete medium (YPD; see Materials and Methods) and were either shifted directly to nitrogen starvation medium or were first preincubated with cerulenin for different times in rich medium to deplete the cells of their free fatty acids prior to nitrogen starvation. We observed that Pho8Δ60 activity gradually decreased with increasing preincubation time (Fig2A). This finding further supported the notion that depletion of fatty acids from the cells blocks autophagy.
Figure 2.
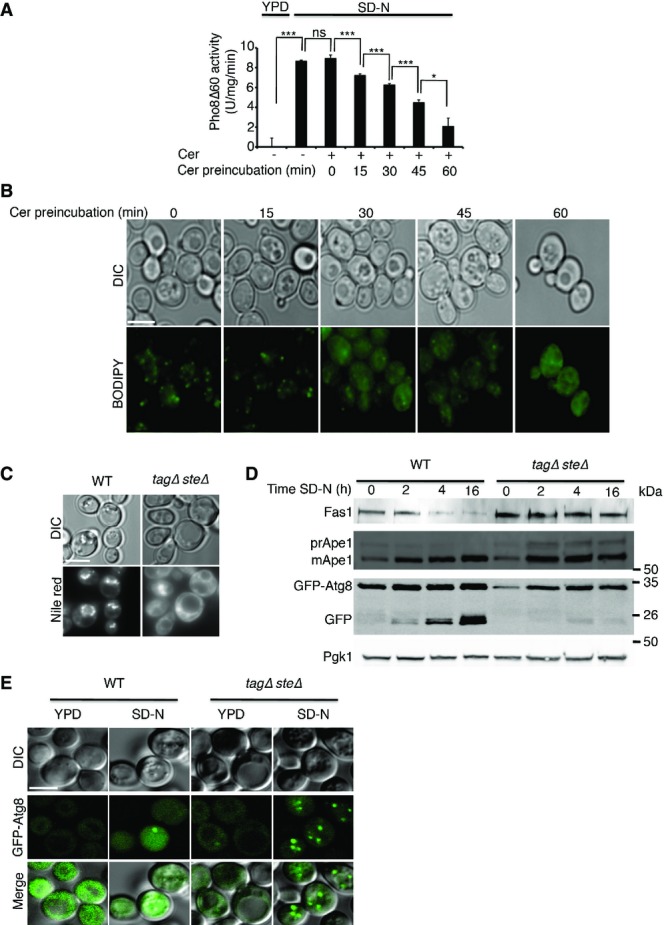
Lipid droplets are important for autophagy
- Cells (TN124 strain) were grown to mid-log phase and preincubated in YPD with 50 μM cerulenin for the indicated time periods (Cer preincubation) or incubated with DMSO without preincubation (−). Cells were then shifted to SD-N for 3 h with the addition of DMSO or 50 μM cerulenin (cer). Autophagic activity was measured by alkaline phosphatase assay. Error bars represent the s.e.m. of three independent experiments. *P < 0.05, ***P < 0.001 (Student’s t-test).
- Cells were grown as in (A), stained with BODIPY, and visualized by fluorescence microscopy. Scale bar, 5 μm.
- WT (SCY62) and tagΔsteΔ (H1246) cells were grown to mid-log phase in YPD and shifted to SD-N for 3 h. Cells were stained with Nile red and visualized by fluorescence microscopy. Scale bar, 5 μm.
- WT (SCY62) and tagΔsteΔ (H1246) cells expressing GFP-Atg8 were grown to mid-log phase in YPD and shifted to SD-N for the indicated time periods. Cell lysates were subjected to SDS–PAGE, followed by Western blot analysis using anti-GFP, anti-Ape1 (prApe1, premature Ape1; mApe1, mature Ape1), and anti-Fas1 and anti-Pgk1 antibodies.
- WT (SCY62) and tagΔsteΔ (H1246) cells were grown to mid-log phase in YPD and shifted to SD-N for 2 h. GFP-Atg8 was visualized by fluorescence microscopy. Scale bar, 5 μm.
Data information: cer, cerulenin; DIC, differential interference contrast; FA, fatty acids; SD-N, nitrogen starvation medium; WT, wild type; YPD, complete medium. Source data are available online for this figure.
Inhibition of fatty acid synthesis under growing conditions leads to the utilization of LD pools in order to supply cells with the necessary lipids (Kurat et al, 2009). We therefore examined the amount and distribution of LDs in cerulenin-treated cells, using the LD dye BODIPY and the protein Erg6, an LD marker (Figs2B and EV2A) (Greenspan et al, 1985; Jacquier et al, 2011). We found that the decrease in autophagic activity upon cerulenin treatment correlated with a reduction in the amount of LDs (Figs2B and EV2A). Under conditions of nitrogen starvation, both BODIPY and Erg6−red fluorescent protein (Erg6−RFP) localized to LDs, whereas their localization shifted to the ER and the number of LDs decreased at a rate proportional to the period of preincubation with cerulenin (Figs2B and EV2A). Addition of cerulenin directly to the starvation medium also inhibited the accumulation of LDs (FigEV2B). These results led us to hypothesize that LDs are essential for the autophagic process.
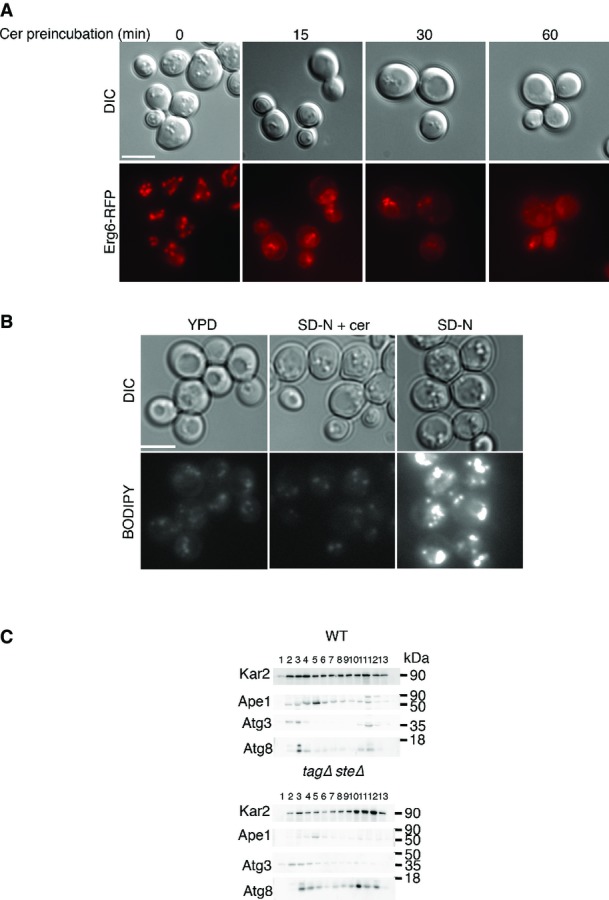
Lipid droplets are important for autophagy
- RFP-Erg6 (TOS039)-expressing cells were grown to mid-log phase in YPD and preincubated with 50 μM cerulenin for the indicated time periods (Cer preincubation) or with DMSO (0). Cells were shifted to SD-N with 50 μM cerulenin for 3 h and then visualized by fluorescence microscopy. Scale bar, 5 μm.
- WT cells were grown to mid-log phase in YPD and shifted to SD-N in the presence or absence of 50 μM cerulenin for 16 h. Cells were stained with BODIPY and visualized by fluorescence microscopy. Scale bar, 5 μm.
- WT (SCY62) and tagΔsteΔ (H1246) cells were grown to mid-log phase in YPD and shifted to SD-N for 2 h. Cells were lysed and the lysate was subjected to subcellular fractionation as described in Materials and Methods. An equal volume of each fraction was subjected to immunoblotting with anti-Atg8, anti-Kar2, anti-Ape1, and anti-Atg3 antibodies.
Data information: cer, cerulenin; SD-N, nitrogen starvation medium; WT, wild type; YPD, complete medium. Source data are available online for this figure.
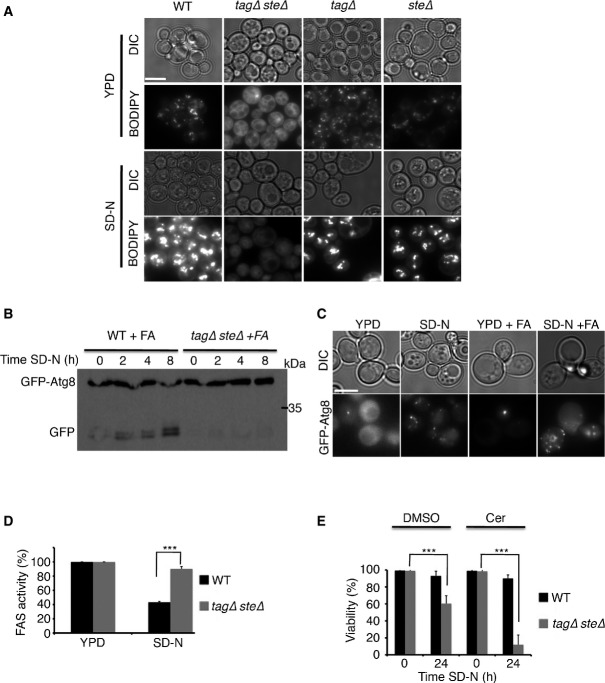
To directly test whether LDs participate in autophagy, we utilized a quadruple deletion strain unable to synthesize LDs (H1246) (Sandager et al, 2002). This strain lacks the enzymes Lro1 and Dga1, which are responsible for the synthesis of TAGs (Sandager et al, 2002), as well as the Are1 and Are2 enzymes responsible for the synthesis of STEs (Sandager et al, 2002). Nile red and BODIPY fluorescence staining confirmed that this strain lacks LDs (Figs2C and 4A). Deficiency of LDs led to the inhibition of autophagy, as indicated by the inability of this strain to degrade GFP-Atg8 and the autophagic substrate FAS1 upon nitrogen starvation (Fig2D). Ape1 was in its mature form in vegetative growing cells, suggesting that the CVT pathway is not dependent on LDs. Upon nitrogen starvation, however, the Ape1 that accumulated in the LD-deficient strain was premature compared with that in the WT, further supporting the inhibition of autophagy (Fig2D). Fluorescence microscopy revealed no apparent differences in GFP-Atg8 localization in the WT and the LD-deficient strains under vegetative growth conditions (Fig2E). Shifting of the cells to the nitrogen starvation medium (SD-N), however, resulted in GFP-Atg8 accumulation in the vacuoles of WT cells, whereas the LD-deficient strain exhibited multiple puncta and failed to reach the vacuole efficiently (Fig2E). Subcellular fractionation indicated that Atg8 accumulated mainly in the ER fraction (Fig EV2B).
Figure 4.
Fatty acids cannot rescue autophagy in LD-deficient strains
- WT (SCY62), tagΔ steΔ (H1246), tagΔ (H1226), and steΔ (H1112) cells expressing GFP-Atg8 were grown to mid-log phase and shifted to SD-N for 6 h. Cells were stained with BODIPY and visualized by fluorescence microscopy. Scale bar, 5 μm.
- WT (SCY62) and tagΔ steΔ (H1246) cells expressing GFP-Atg8 were grown to mid-log phase in YPD + 0.1 mM palmitic/stearic/myristic acids (FA) and shifted to SD-N + 0.1 mM palmitic/stearic/myristic acids for the indicated time periods. Cell lysates were subjected to SDS–PAGE followed by Western blot analysis using anti-GFP antibodies.
- Fluorescence visualization of GFP-Atg8 in tagΔ steΔ (H1246) cells grown in the presence or absence of 0.1 mM palmitic/stearic/myristic acids (FA) and shifted to SD-N for 2 h. Scale bar, 5 μm.
- WT (SCY62) and tagΔ steΔ (H1246) cells expressing GFP-Atg8 were grown to mid-log phase and shifted to SD-N for 4 h. FAS activity was determined at 0 h and after 4 h in SD-N. Error bars represent the s.e.m. of three independent experiments. ***P < 0.001 (Student’s t-test).
- WT (SCY62) and tagΔ steΔ (H1246) cells were grown to mid-log phase and shifted to SD-N with DMSO or 50 μM cerulenin for the indicated time periods. Cell viability was determined at the indicated times using phloxine B. Error bars represent the s.e.m. of three independent experiments. ***P < 0.001 (Student’s t-test).
Data information: Cer, cerulenin; DIC, differential interference contrast; FA, fatty acids; FAS, fatty acid synthase; SD-N, nitrogen starvation medium; WT, wild type; YPD, complete medium. Source data are available online for this figure.
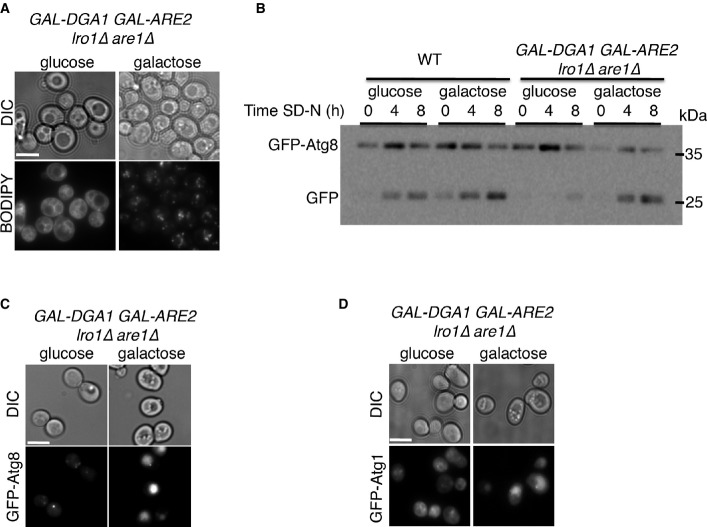
The need for LDs in autophagy was further emphasized by the use of an LD-deficient strain harboring the DGA1 and ARE2 genes under a galactose-inducible promoter (are1Δlro1Δ pGAL-DGA1 pGAL-ARE2). We found that it was only when this strain was grown on a galactose medium that LDs were formed (Fig3A). Autophagy was inhibited when these cells were grown on glucose, as indicated by the GFP-Atg8 processing assay and by the localization of GFP-Atg8 to multiple puncta under nitrogen starvation (Fig3B and C). Upon galactose induction, however, GFP-Atg8 was readily processed and accumulated inside the vacuoles (Fig3B and C). We also observed that the core autophagy protein and substrate Atg1 failed to reach the vacuole under nitrogen starvation when grown on glucose-containing medium but was readily delivered to the vacuole when grown on galactose (Fig3D). Together, these results strongly indicate that LDs are key regulators of autophagy.
Figure 3.
Induction of STE and TAG enzymes rescues autophagy
- A GAL-DGA1 GAL-ARE2 lro1Δ are1Δ (FYS118 strain) was grown on SC (synthetic minimal medium without dextrose) + raffinose overnight, diluted to OD 0.4, and grown to mid-log phase in either SC + glucose or SC + galactose medium. Cells were shifted to SD-N for 2 h, stained with BODIPY, and visualized by fluorescence microscopy. Scale bar, 5 μm.
- B WT (BY4741) and GAL-DGA1 GAL-ARE2 lro1Δ are1Δ (FYS118) cells expressing GFP-Atg8 were grown as in (A). Cells were lysed at the indicated times and subjected to SDS–PAGE, followed by Western blot analysis using anti-GFP antibodies.
- C, D WT (BY4741) and GAL-DGA1 GAL-ARE2 lro1Δ are1Δ (FYS118) cells expressing GFP-Atg8 (C) or GFP-Atg1 (D) were grown as in (A) and visualized by fluorescence microscopy after 2 h in SD-N. Scale bar, 5 μm.
Data information: DIC, differential interference contrast; SD-N, nitrogen starvation medium; WT, wild type. Source data are available online for this figure.
Exogenous fatty acids cannot rescue lipid droplet deficiency
Under nitrogen starvation, fatty acids are stored in the form of LDs (Fig4A). Both STE- and TAG-containing LDs accumulated under these conditions (Fig4A). We speculated that in the absence of LDs, the cells might encounter a shortage of fatty acids that would result in autophagy blockage. To test this hypothesis, we supplied exogenous fatty acids to WT and LD-deficient strains. Addition of fatty acids to the LD-deficient strain failed to rescue autophagy, as indicated by the GFP-Atg8 cleavage assay (Fig4B) and also failed to overcome the accumulation of GFP-Atg8 puncta upon nitrogen starvation (Fig4C). In agreement with the inhibition of the autophagic process and the inability of fatty acids to overcome autophagic defects, we observed that FAS activity remained high and relatively constant in the LD-deficient strain but showed a marked decrease upon nitrogen starvation in the WT strain presumably owing to its degradation by autophagy (Fig4D). In the absence of LDs, therefore, cells may need to rely mostly on FAS for their fatty acid supply. Inhibition of FAS by cerulenin under nitrogen starvation led to a rapid and complete loss of viability in the LD-deficient strain, whereas its effect on WT cells was not significant (Fig4E). These results showed that LDs and not fatty acids are needed for regulation of the autophagic process.
Triacylglycerols and steryl esters are both essential for efficient autophagy
Lipid droplets are composed of TAGs and STEs surrounded by a phospholipid monolayer. To gain a deeper understanding of the role of LDs in autophagy, we analyzed the effect of LDs deprived of either tagΔ (dga1Δ lro1Δ) or steΔ (are1Δ are2Δ). Using the GFP-Atg8 processing assay, we observed that GFP cleavage in both tagΔ and steΔ cells is defective compared to that in WT cells (Fig5A and B). In addition, fluorescence microscopy of GFP-Atg8 revealed that GFP-Atg8 fails to efficiently localize to the vacuole in these strains (Fig5C). Notably, Atg8 in both tagΔsteΔ and steΔ strains accumulated in puncta-like structures, whereas no such accumulation was observed in the tagΔ strain (Fig5C). Similar accumulation in puncta was observed when we visualized GFP-Atg1 (Fig EV3A), but were not seen with the GFP-tagged housekeeping gene phosphoglycerokinase 1 GFP-Pgk1 (FigEV3B), suggesting that the puncta are autophagy-related structures. In agreement with these results, we found that upon nitrogen starvation, Atg8 accumulated in its unlipidated form in the tagΔ strain, whereas lipidated Atg8 accumulated in the steΔ and the steΔtagΔ strains (Figs5D and EV3C). In further support of autophagy inhibition, the starvation-induced degradation of long-lived proteins was significantly inhibited (FigEV3D). These results indicated that both TAGs and STEs are important for autophagy. Notably, we could not detect the autophagy proteins Atg8 or Atg3 on LDs, suggesting that Atg8 lipidation does not occur on LDs (FigEV3E).
Figure 5.
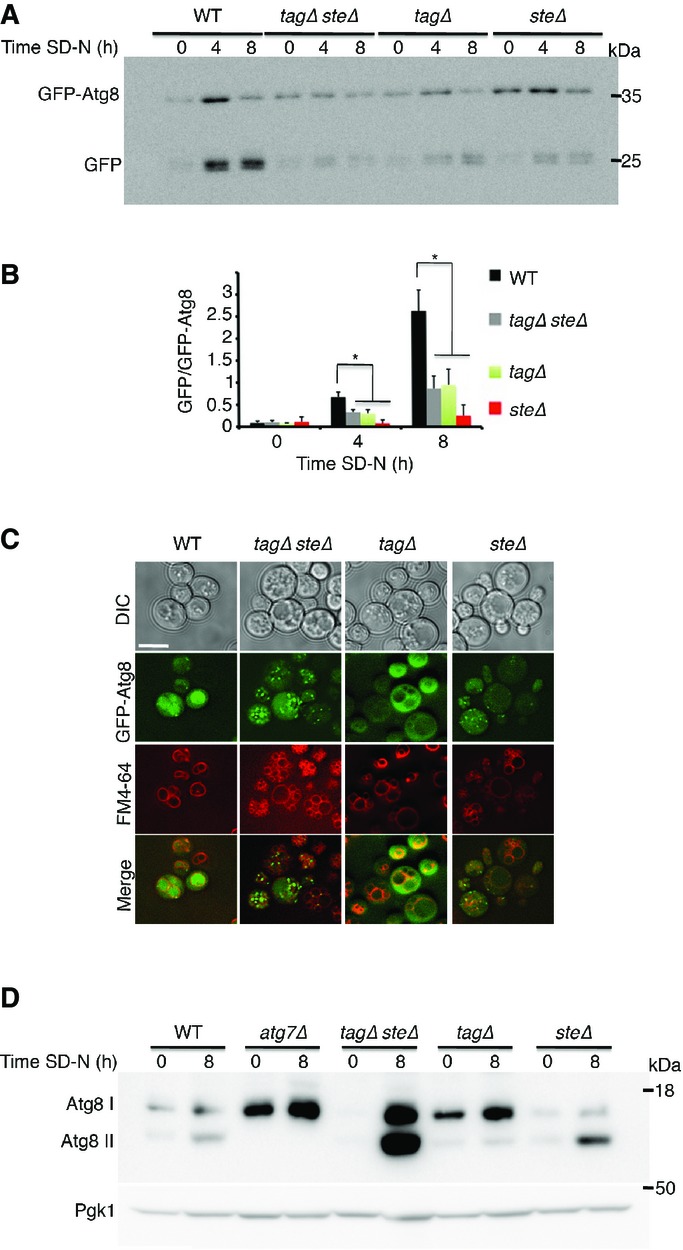
TAG and STE are both essential for efficient autophagy
- WT (SCY62), tagΔsteΔ (H1246), tagΔ (H1226), and steΔ (H1112) cells expressing GFP-Atg8 were grown to mid-log phase in YPD and shifted to SD-N for the indicated time periods. Cells were lysed and subjected to SDS–PAGE, followed by Western blot analysis using anti-GFP antibodies.
- Quantification of the GFP/GFP-Atg8 ratio. Error bars represent the s.e.m. of three independent experiments. *P < 0.05 (Student’s t-test).
- WT (SCY62), tagΔsteΔ (H1246), tagΔ (H1226), and steΔ (H1112) cells expressing GFP-Atg8 were grown to mid-log phase in YPD and shifted to SD-N for 2 h. GFP-Atg8 was visualized by fluorescence microscopy. Scale bar, 5 μm.
- WT (SCY62), tagΔsteΔ (H1246), tagΔ (H1226), and steΔ (H1112) cells were grown as in (A). Lysates were subjected to SDS−PAGE in urea gel, followed by Western blot analysis using anti-Atg8 and anti-Pgk1 antibodies.
Data information: Atg8 I, non-lipidated Atg8; Atg8 II, lipidated Atg8; DIC, differential interference contrast; SD-N, nitrogen starvation medium; WT, wild type. Source data are available online for this figure.
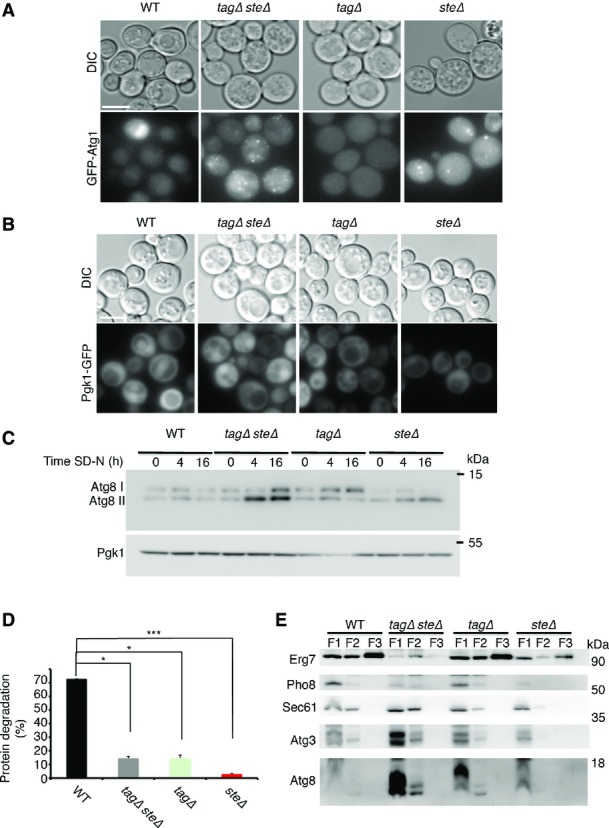
TAG and STE are both essential for efficient autophagy
- A, B WT (SCY62), tagΔsteΔ (H1246), tagΔ (H1226), and steΔ (H1112) cells expressing Atg1-GFP (A) or Pgk1-GFP (B) were grown to mid-log phase in YPD and shifted to SD-N for 2 h. GFP was visualized by fluorescence microscopy. Scale bar, 5 μm.
- C WT (SCY62), tagΔsteΔ (H1246), tagΔ (H1226), and steΔ (H1112) cells were grown to mid-log phase in YPD and shifted to SD-N for the indicated time periods. Lysates were subjected to SDS–PAGE in urea gel, followed by Western blot analysis using anti-Atg8 and anti-Pgk1 antibodies.
- D WT (SCY62), tagΔsteΔ (H1246), tagΔ (H1226), and steΔ (H1112) cells were grown to mid-log phase in YPD and pulse-labeled for 16 h with [35S] methionine and cysteine. Cells were chased on non-radioactive starvation medium. Acid-soluble small peptides generated by proteolysis were determined after 8 h in SD-N, as described in Materials and Methods. Error bars represent the s.e.m. of three independent experiments. *P < 0.05, ***P < 0.001 (Student’s t-test).
- E WT (SCY62), tagΔsteΔ (H1246), tagΔ (H1226), and steΔ (H1112) cells were grown to mid-log phase in YPD and shifted to SD-N for 4 h. Cells were lysed and lipid droplets were isolated by three successive flotations (F1, F2, F3) as described in Materials and Methods. The flotation fractions were subjected to SDS–PAGE, followed by Western blot analysis using anti-Atg8, anti-Sec61, anti-Erg7, anti-Atg3, and anti-Pho8 antibodies. WT sucrose %: 1–8.4%, 2–13%, 3–19.5%, 4–23.8%, 5–26%, 6–28.5%, 7–28.8%, 8–29.5%, 9–32%, 10–34.2%, 11–39.5%, 12–48.5%, 13–48.5%. tagΔsteΔ sucrose %: 1–8.4%, 2–12%, 3–13%, 4–18.5%, 5–23.8%, 6–26.5%, 7–28.2%, 8–31%, 9–31.5%, 10–33.8%, 11–38%, 12–45%, 13–48%.
Data information: SD-N, nitrogen starvation medium; WT, wild type; YPD, complete medium. Source data are available online for this figure.
Lack of lipid droplets inhibits starvation-induced formation of autophagosomes
To further study the inhibitory effect of the LD mutant strains on autophagy, we generated LD mutants on the background of pep4Δ and performed electron microscopic analyses of the morphologies of different LD mutants under conditions of rich medium and of nitrogen starvation. When grown in rich medium, the morphologies of both the WT and the different LD mutant strains were normal except that LDs were hardly observed in the steΔtagΔ mutant and the vacuoles were larger and appeared as partially budded invaginations in the steΔ strain (FigEV4A). Under nitrogen starvation, however, autophagic bodies were easily detectable in the WT cells but much harder to detect in the LD-deficient strains (FigEV4B–D). Accumulation of autophagosomes or phagophores in these strains and in the LD mutant pep4Δ strains was hardly detectable, suggesting that LD deficiency inhibits the autophagic process at early stages of autophagosome biogenesis (Figs6A–H, J and EV4B–D). Strikingly, the steΔtagΔ strain exhibited massive expansion of the ER. The peripheral ER was continuous and was often looped in the cytoplasm (Fig6D and I). The ER connecting the nuclear envelope with the peripheral ER was also prominent. In several cells, the expanded ER gave rise to the formation of a complex network of membranes. In addition, mitochondria were often larger and their cristae were affected (Fig6I).
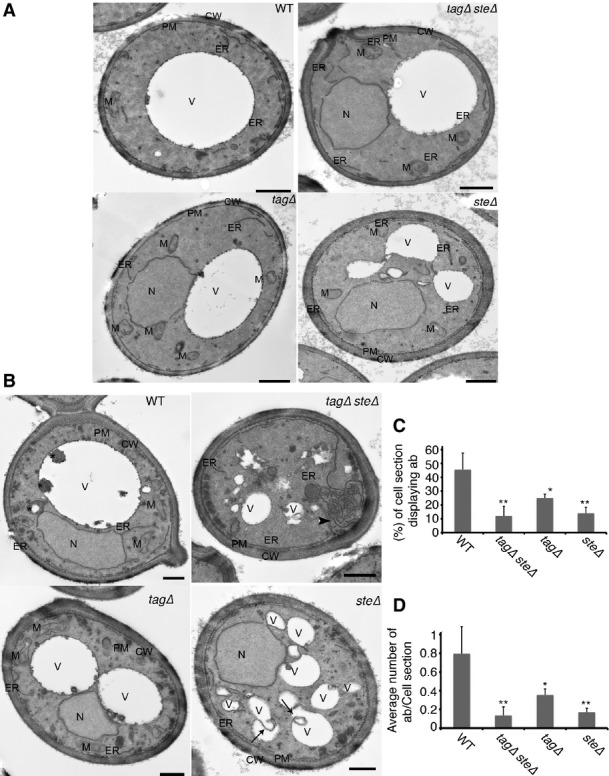
Lack of lipid droplets inhibits starvation-induced formation of autophagosomes
- A, B WT (SCY62), tagΔ (H1226), steΔ (H1112), and tagΔsteΔ (H1246) cells were grown to an exponential phase in rich medium and were then processed for electron microscopy (A) or starved in SD-N for 2 h, prior to electron microscopy analysis (B). Scale bars, 500 nm. CW, cell wall; ER, endoplasmic reticulum; M, mitochondrion; V, vacuole; SD-N, nitrogen starvation medium; WT, wild type. Arrows highlight homotypic membrane fusion of a vacuolar remnant. Arrowheads point to proliferating ER.
- C, D Average number of autophagic bodies per cell section (C) and percentages of cell sections displaying autophagic bodies in the vacuolar lumen (D) were determined by counting 100 randomly selected cell profiles. Error bars represent standard deviations from counting of the three grids. *P < 0.05, **P < 0.01 (Student’s t-test). WT, wild type.
Figure 6.
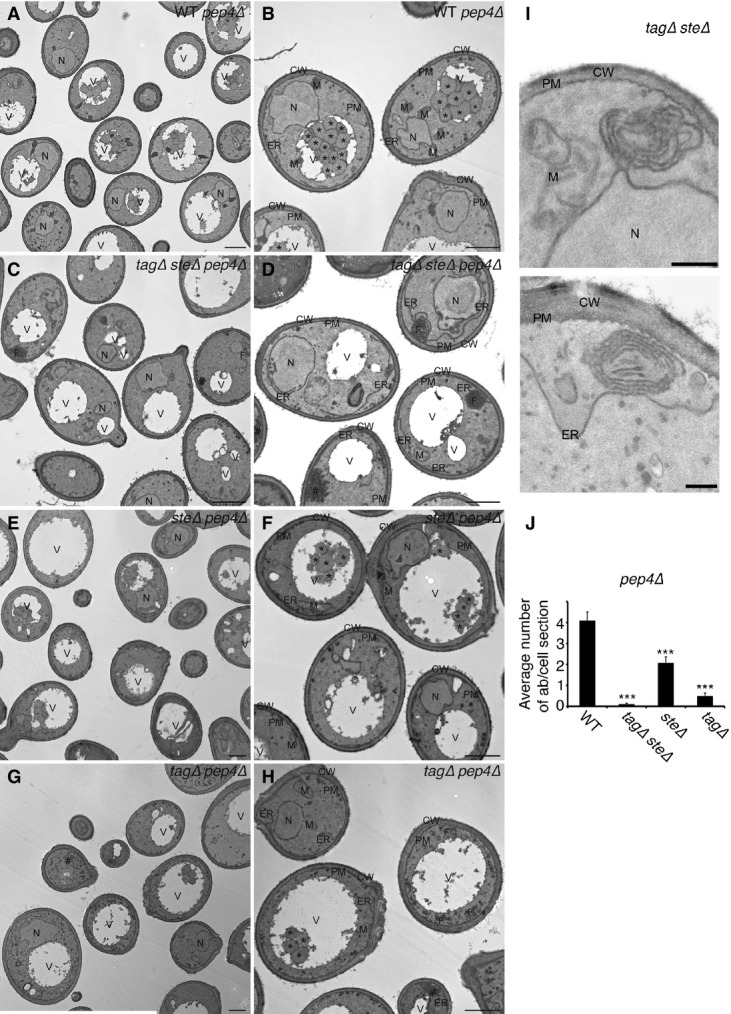
Lack of lipid droplets inhibits starvation-induced formation of autophagosomes
- A–I WT pep4Δ (pep4Δ) (A, B), tagΔsteΔ pep4Δ (tagΔsteΔpep4Δ)(C, D), steΔ pep4Δ (steΔpep4Δ)(E, F), and tagΔ pep4Δ (tagΔpep4Δ) (G, H) cells were grown to an exponential phase in YPD before being starved in SD-N for 2 h and were then processed for electron microscopy. (H) is a magnification of the box in (G). Magnification of proliferating ER in a tagΔsteΔ (H1246) cell is shown in (I). Asterisks indicate autophagic bodies. N, nucleus; PM, plasma membrane; CW, cell wall; ER, endoplasmic reticulum; M, mitochondrion; V, vacuole; #, trehalose; F, ER proliferation. Scale bars: 1 μm (A–H) and 200 nm (I).
- J Average number of autophagic bodies per cell section was determined by counting 100 randomly selected cell profiles. Error bars represent standard deviations from counting of the three grids. ***P < 0.001 (Student’s t-test).
Data information: SD-N, nitrogen starvation medium; WT, wild type; YPD, complete medium. Source data are available online for this figure.
The STE deletion strain exhibited fragmented vacuoles (FigEV4B), which may be due to aberrant ergosterol synthesis (Tedrick et al, 2004; Jones et al, 2010).
Lipolysis of TAG and STE is essential for autophagy
Thus far we have shown that biogenesis of TAG and STE is important for autophagy. We hypothesized that the mobilization of TAG and STE into phospholipids, sterols, and fatty acids may be important for formation of the autophagosomal membrane. In yeasts, several TAG lipases (Tgl3, Tgl4, Tgl5, and Ayr1) (Athenstaedt & Daum, 2003, 2005; Ploier et al, 2013) and STE hydrolases (Tgl1, Yeh1, and Yeh2) (Koffel et al, 2005; Koffel & Schneiter, 2006) have been identified and characterized. Ldh1 was recently shown to possess both TAG lipase and STE hydrolase activities (Debelyy et al, 2011). Using the GFP-Atg8 processing assay, we examined whether deletion of these lipases inhibits autophagy. To identify the STE lipase required for starvation-induced autophagy, tgl1Δ,yeh1Δ, and yeh2Δ strains were tested for starvation-induced autophagy. Strikingly, inhibition in the processing of GFP-Atg8 (Fig7A) and its delivery to the vacuole (Fig7F) was detected only in the yeh1Δ cells and yeh1Δ strains accumulated non-lipidated Atg8 (Fig EV5C). These findings suggest that the mobilization of STE is important for the autophagic process. Moreover, while deletion of the TAG lipase genes TGL3, TGL4, TGL5 (FigEV5A) or triple deletion of these genes (tgl3Δtgl4Δtgl5Δ) (Fig7B) did not hamper processing of GFP-Atg8, single deletion of AYR1 or LDH1 exhibited low inhibition (Fig7C), and double deletion (ldh1Δayr1Δ) significantly inhibited processing of GFP-Atg8 (Fig7D) and its delivery to the vacuole (Fig EV5B). Together, these results indicate that the mobilization of both STE and TAG is important for the autophagic process.
Figure 7.
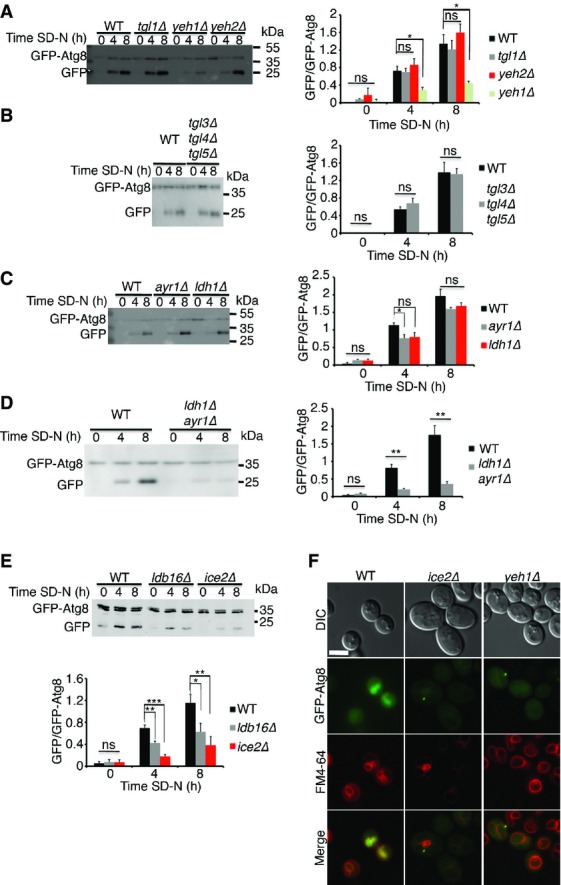
Lipolysis of lipid droplets is essential for autophagy
- WT (BY4741), tgl1Δ, yeh1Δ, and yeh2Δ cells expressing GFP-Atg8 were grown to mid-log phase in YPD and shifted to SD-N for the indicated time periods. Cells were lysed and subjected to SDS–PAGE, followed by Western blot analysis using anti-GFP antibodies. Quantification of the GFP/GFP-Atg8 ratio is presented on the right.
- WT (BY4741) and tgl3Δtgl4Δtgl5Δ cells expressing GFP-Atg8 were grown, treated, lysed, and subjected to Western blot as in (A). Quantification of the GFP/GFP-Atg8 ratio is presented on the right.
- WT (BY4741), ayr1Δ, and ldh1Δ cells expressing GFP-Atg8 were grown, treated, lysed, and subjected to Western blot as in (A). Quantification of the GFP/GFP-Atg8 ratio is presented on the right.
- WT (BY4741) and ldh1Δayr1Δ cells expressing GFP-Atg8 were grown, treated, lysed, and subjected to Western blot as in (A). Quantification of the GFP/GFP-Atg8 ratio is presented on the right.
- WT (BY4741), ice2Δ, and ldb16Δ cells expressing GFP-Atg8 were grown, treated, lysed, and subjected to Western blot as in (A). Quantification of the GFP/GFP-Atg8 ratio is presented in the bottom panel.
- WT (BY4741), ice2Δ, and yeh1Δ cells expressing GFP-Atg8 were grown to mid-log phase in YPD and shifted to SD-N for 4 h. GFP-Atg8 was visualized by fluorescence microscopy. Scale bar, 5 μm.
Data information: In (A–E), error bars represent the s.e.m. of three independent experiments. *P < 0.05, **P < 0.01 ***P < 0.001 (Student’s t-test). DIC, differential interference contrast; SD-N, nitrogen starvation medium; WT, wild type. Source data are available online for this figure.
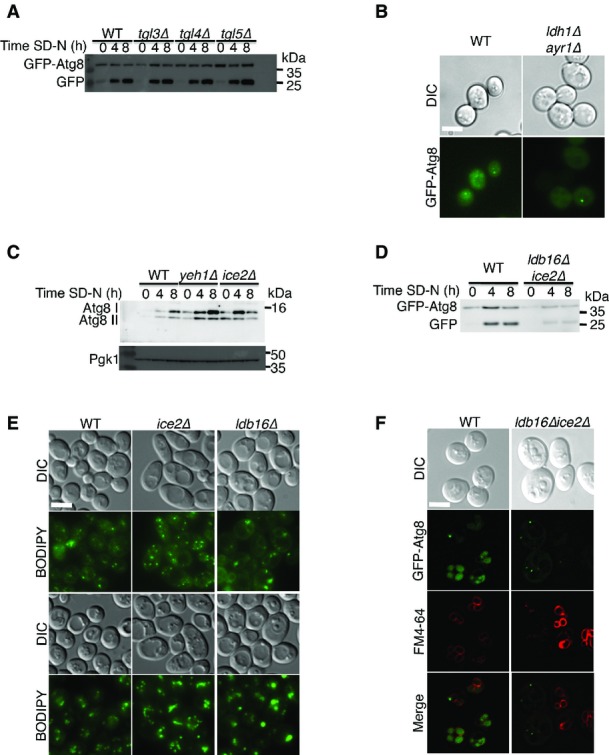
Lipolysis of TAG and STE is essential for autophagy
- WT (BY4741), tgl3Δ (TOS042), tgl4Δ (TOS043), and tgl5Δ (TOS044) cells expressing GFP-Atg8 were grown to mid-log phase in YPD and shifted to SD-N for the indicated time periods. Cells were lysed and subjected to SDS–PAGE, followed by Western blot analysis using anti-GFP antibodies.
- WT (BY4741) and ldh1Δayr1Δ (TOS056) cells were grown to mid-log phase in YPD, shifted to SD-N for 4 h, and then visualized by fluorescence microscopy. Scale bar, 5 μm.
- WT (BY4741), tgl1Δ (TOS041), yeh1Δ (TOS045), and yeh2Δ (TOS046) cells were grown to mid-log phase in YPD and shifted to SD-N for the indicated time periods. Lysates were subjected to SDS–PAGE in urea gel, followed by Western blot analysis using anti-Atg8 and anti-Pgk1 antibodies.
- WT (BY4741) and ldb16Δice2Δ (TOS057) cells expressing GFP-Atg8 were grown to mid-log phase in YPD and shifted to SD-N for the indicated time periods. Cells were lysed and subjected to SDS−PAGE, followed by Western blot analysis using anti-GFP antibodies.
- WT (BY4741), ice2Δ (TOS047), and ldb16Δ (TOS048) cells were grown to mid-log phase in YPD and shifted to SD-N for 2 h. Cells were stained with BODIPY and visualized by fluorescence microscopy. Scale bar, 5 μm.
- WT (BY4741) and ldb16Δice2Δ (TOS057) cells expressing GFP-Atg8 were grown to mid-log phase in YPD, shifted to SD-N for 4 h, and visualized by fluorescence microscopy. Scale bar, 5 μm.
Data information: SD-N, nitrogen starvation medium; WT, wild type; YPD, complete medium. Source data are available online for this figure.
Ice2 and Ldb16 are ER membrane proteins that reside on the contact sites of the ER and LDs (Markgraf et al, 2014; Wang et al, 2014a). Ice2 was recently shown to couple TAG utilization to lipid synthesis in the ER (Markgraf et al, 2014), and Ldb16 was shown to be important for phospholipid metabolism and LD size (Wang et al, 2014a). We hypothesized that lipolysis of LDs is coupled to phospholipid synthesis in the ER and therefore that contact-site proteins will be important to the autophagy process. We found that ice2Δ cells accumulate excess amount of LDs owing to their inability to utilize them properly (FigEV5C) (Markgraf et al, 2014) and that ldb16Δ results in the accumulation of supersized LDs (FigEV5C) (Wang et al, 2014a). These strains exhibited significant reduction in starvation-induced autophagy (Figs7F and EV5D). Together, our results suggest that lipolysis of LDs supplies lipids to the ER through ER-LD contact sites, a process that is essential for autophagosome formation.
Discussion
In the present study, we utilized yeast strains in which we deleted the enzymes responsible for the biosynthesis of TAG (Lro1, Dga1), of STE (Are1, Are2), or of both (Lro1, Dga1, Are1, Are2) to investigate the roles of LDs in autophagy. Strains that lack TAG (tagΔ) or STE (steΔ) form LDs with altered composition, while strains lacking both TAG and STE (tagΔsteΔ) do not form LDs at all. We found that inhibition of starvation-induced autophagy in the tagΔ strain was accompanied by inhibition of Atg8 conjugation to PE. Moreover, starvation-induced autophagy was also inhibited in the steΔ and tagΔsteΔ strains. In these two strains, however, Atg8 conjugated to PE accumulated on multiple puncta structures. In line with these results, Atg1—known to localize to early autophagic structures (Suzuki et al, 2007)—was also found to accumulate in multiple puncta in the steΔ and tagΔsteΔ strains, but not in the tagΔ strain. Importantly, autophagosomes could not be detected in any of these strains. In addition, we show that lipolysis of STE by Yeh1 and of TAG by Ayr1 as well as by the lipase/hydrolase Ldh1 is essential for autophagy. In line with the essential use of LDs, we showed that the ER-LD contact-site proteins Ice2 and Ldb16 play important roles in autophagy. We hypothesize that the formation and lipolysis of LDs are imperative for the efficient formation of autophagosomes.
Lipid droplets may contribute lipids, provide energy, or act as scaffolds for autophagosome biogenesis. They are found in close proximity to phagophores (Yla-Anttila et al, 2009) and engage in transient “kiss-and-run” interactions with autophagosomes (Dupont et al, 2014). Similar interactions, associated with phagosome maturation, were described for LDs and phagosomes (van Manen et al, 2005). The observed interaction of LDs with phagosomes was suggested to provide a reservoir of arachidonic acid, important for NADPH oxidase activation and consequently for phagosome maturation (van Manen et al, 2005). Our results indicate that lipolysis of either STE or TAG is essential for autophagy, suggesting that LDs provide fatty acids and lipids that regulate the formation and elongation of the phagophore. In agreement with this suggestion, a recent study showed that TAG mobilization by the lipase PNPLA5 contributes to autophagosome biogenesis (Dupont et al, 2014). We identified the TAG lipases and STE hydrolases Ayr1, Ldh1, and Yeh1 as crucial for autophagy. The need for these lipases and not others (such as Tgl1, Yeh2, Tgl3, Tgl4, and Tgl5) may suggest that only a certain subset of lipases is active during nitrogen starvation or that only specific LD populations contribute lipids to the autophagosomal membrane. Interestingly, Yeh1 was shown to be the major steryl ester hydrolase under conditions of heme deficiency (Koffel & Schneiter, 2006), supporting the notion that only a particular subset of lipases is active under different environmental conditions. These results indicate that not only the formation of LDs but also the mobilization of neutral lipid stores is important for autophagy. Importantly, a recent study demonstrated that ergosterol ester hydrolysis is required for pro-spore membrane biogenesis in sporulating diploids (Ren et al, 2014). Thus, the dynamics of LDs may be a general regulator of membrane biogenesis processes under nutrient-limiting conditions.
The ER membrane is considered to serve as a source of autophagosomes (Axe et al, 2008; Hayashi-Nishino et al, 2009; Yla-Anttila et al, 2009; Shibutani & Yoshimori, 2014). LDs are functionally connected to the ER and may therefore enable efficient conversion of neutral lipids to phospholipids in the ER, mediated by the LD-ER contact-site protein Ice2 (Jacquier et al, 2011; Markgraf et al, 2014). Our study discloses a need not only for the formation and lipolysis of LDs, but also for the functional connection of LDs to the ER. We showed that two ER-LD contact-site proteins, Ice2 and Ldb16, are essential for the autophagic process. Ldb16 is a transmembrane ER protein that resides in the ER-LD contact sites. It was recently shown that human seipin could complement defects of LDs in the ldb16Δ yeast strain (Wang et al, 2014a). Since mutations in human seipin are linked to a severe form of congenital generalized lipodystrophy (CGL) (Simha & Garg, 2003; Payne et al, 2008), our study points to a possible link between CGL and autophagy. We suggest that lipid funneling from LDs to the ER is essential for autophagosome formation and that these two organelles act together to orchestrate autophagosome biogenesis. Importantly, the crosstalk between LDs and autophagy acts in both directions, as the autophagic machinery is implicated in the formation and growth of LDs (Shibata et al, 2010; Rambold et al, 2015). It therefore seems reasonable to suggest that a delicate feedback occurs between these two processes to drive LD growth, autophagosome biogenesis, and cellular homeostasis.
Under nitrogen starvation, LDs accumulate within the cell. Accumulation of LDs is evidently not required for autophagosome biogenesis, as inhibition of FAS activity needed for both de novo synthesis of fatty acid and the accumulation of LDs (Athenstaedt & Daum, 2003; Kurat et al, 2006) did not block autophagy. Autophagy was inhibited only when LD pools were depleted. In contrast, FAS inhibition, but not LD deficiency, led to the blockage of CVT. As CVT vesicles (150–250 nm) are smaller than autophagosomes (400–900 nm) (Takeshige et al, 1992; Baba et al, 1997), it is reasonable to suggest that LDs are needed for elongation of the phagophore membrane.
Atg8 was reported to constantly undergo conjugation to and deconjugation from PE (Nakatogawa et al, 2012a). Deconjugation of Atg8 from PE, mediated by the cysteine protease Atg4, plays an important role in autophagosome biogenesis and is required for the efficient disassembly of PAS-associated Atg proteins. Moreover, inability to deconjugate Atg8 from PE results in the formation of smaller and fewer autophagosomes, leading to mislocalization of Atg8 (Nair et al, 2012). The marked effect of the steΔ and tagΔsteΔ mutants on the conjugation of Atg8 to PE raises the possibility that LDs participate in regulation of the deconjugation process. Therefore, malfunctioning of the deconjugation machinery of Atg8 may explain the aberrant accumulation of lipidated Atg8 puncta and the significant (though not complete) inhibition of the autophagy process observed in the steΔ and tagΔsteΔ strains. The tagΔsteΔ strain exhibits massive accumulation of lipidated Atg8. We showed here that this strain exhibits extensive proliferation of the ER after short periods of nitrogen starvation. ER proliferation occurred only in the tagΔsteΔ strain and not in the tagΔ or steΔ strain. This phenotype most likely occurs due to the inability of this strain to store excess fatty acids in LDs (Petschnigg et al, 2009; Krahmer et al, 2013). It is therefore possible that in strains lacking LDs, additional signals are responsible for the induction and regulation of autophagy. The inability of Atg8 to conjugate to PE in the tagΔ strain may indicate that the imbalance in STE accumulation inhibits this process.
The data presented here, together with previous reports that link LDs and autophagy, point to a complex interplay between the two. Deciphering the mechanism by which LDs regulate autophagy, and unraveling the mode of action of TAG and STE in this process, may have important implications for autophagosome formation and for the development of lipid-associated diseases. Determining the precise mechanism by which LDs regulate these processes will be the goal of future studies.
Materials and Methods
Reagents, antibodies, and plasmids
Yeast nitrogen base was purchased from Difco and cerulenin from Fermentek. Rabbit anti-FAS antibodies and the pRS316-Pgk1-GFP were a kind gift from Prof. Michael Thumm. Mouse anti-Pgk1 and mouse anti-Pho8 were from Molecular Probes, mouse anti-GFP was from Covance, and rabbit anti-GFP was from Invitrogen. Rabbit anti-Kar2 and rabbit anti-Sec61 were a kind gift from Dr. Maya Schuldiner. Rabbit anti-Erg7 was a kind gift from Prof. Guenther Daum. Anti-Ape1 polyclonal antibodies were prepared by using two synthetic peptides that were conjugated to keyhole limpet hemocyanin (KLH) and then injected into rabbits to produce anti-Ape1 antiserum that recognizes both precursors. The pRS316-GFP-Atg8 plasmid under the promoter of Atg8 was previously described (Amar et al, 2006). pRS316-Atg1-GFP and rabbit anti-Atg3 were a kind gift from Prof. Yoshinori Ohsumi.
Yeast strains and media
The yeast (S. cerevisiae) strains used in this study are listed in Table EV1. Yeast transformation in S. cerevisiae was performed by the lithium acetate method (Elble, 1992). Standard techniques for yeast sporulation, tetrad analysis, and gene disruption were employed as described (Guthrie & Fink, 1991). Yeast strains were grown in complete (“rich”) medium (YPD; 1% yeast extract, 2% peptone, and 2% glucose), in synthetic minimal medium (SD; 0.67% yeast nitrogen base without amino acids or nutrients, 2% dextrose supplemented with amino acids), or in nitrogen starvation medium (SD-N; 2% glucose, 0.67% yeast nitrogen base without amino acids or ammonium sulfate). For galactose induction, strains were grown overnight in SC medium (SD without dextrose) (0.67% yeast nitrogen base without amino acids or nutrients, supplemented with amino acids) + 2% raffinose. Cells were diluted to optical density (OD) 0.2–0.4 and grown to mid-log phase in SC + 2% galactose or 2% glucose. For fatty acid supplementation, 0.1 mM palmitic acid, stearic acid, and myristic acid (Sigma-Aldrich) were added to the relevant medium in the presence of 1% Tween-40 (Sigma-Aldrich). For experiments with cerulenin, 25 μM or 50 μM cerulenin was added to the corresponding medium and DMSO was added to the controls. For preincubation experiments, cerulenin was added to the rich medium, and after the indicated times, the cells were washed and shifted to SD-N supplemented with cerulenin. For cerulenin experiments that were performed without preincubation, cerulenin was added directly to SD-N. Cell lysis was performed as described (Kushnirov, 2000).
Fluorescence microscopy
For the analysis of GFP- and RFP-tagged proteins, fluorescence microscopy was performed with a confocal microscope (Olympus FV1000 + IX81) (Fig2E) or a DeltaVision microscope (Applied Precision). DeltaVision images were deconvolved using the SoftWORx software (Applied Precision).
Pho8Δ60 assay
The Pho8Δ60 assay for the measurement of non-selective autophagy was performed as previously described (Noda & Klionsky, 2008).
FM4‒64 staining
FM4‒64 (40 μM; Invitrogen) was added to the cells at room temperature for 15–30 min. Cells were collected (950 × g, 5 min) and resuspended in new medium for 15–30 min, and the chase was repeated once. Cells were washed (950 × g, 5 min) and visualized under a fluorescence microscope.
Nile red and BODIPY staining
Cells were washed with double-distilled water (DDW) and stained with Nile red (10 μg/ml, Sigma-Aldrich) for 1 min at room temperature. Cells were washed twice with phosphate-buffered saline (PBS) and visualized under a fluorescence microscope. BODIPY 493/503 (1 μg/ml, Rhenium) was added to the cells for 15 min at 30°C. The cells were washed three times with PBS and then imaged.
Electron microscopy
Cells were grown in YPD and then in SD-N for 2 h. Samples were collected before and after nitrogen starvation and processed for electron microscopy as previously described (Griffith et al, 2008). Three different grids with sections obtained from the same preparations were statistically evaluated. For each grid, the average number of autophagic bodies per cell section and the percentage of cell sections displaying autophagic bodies in the vacuole lumen were determined by counting 100 randomly selected cell profiles from two independent experiments.
Cell viability
Cell viability was assessed as previously described (Noda, 2008). Cells were grown to mid-log phase in SD, washed twice in DDW, and shifted to SD-N with either DMSO or 50 μM cerulenin. At the indicated time points, cells were harvested (950 × g, 3 min), washed, and stained with phloxine B (2 μg/ml, Sigma-Aldrich). Fluorescence microscopy was carried out with a fluorescein isothiocyanate (FITC) filter. Cells with bright fluorescence were counted as dead cells.
Fatty acid synthase activity
Fatty acid synthase activity was assayed as previously described (Lynen, 1969). Yeasts were grown to mid-log phase in YPD, washed twice, and shifted to SD-N. At the indicated time points, 10 OD units were harvested (950 × g, 5 min) and washed with DDW. The pellet was resuspended in ice-cold 0.1 M potassium phosphate buffer, pH 7.4, containing protease inhibitors (Calbiochem) and PMSF (Sigma-Aldrich). Lysis was performed with glass beads (7 cycles, each of 1 min vortex and 1 min cooling on ice). The lysate was centrifuged at 8,000 × g for 20 min at 4°C. FAS activity was assayed at room temperature in a mixture containing 0.1 M potassium phosphate pH 6.5, 2 mM EDTA, 10 mM cysteine, 0.2 mM NADPH, 0.05 mM acetyl CoA, 0.3 mg of bovine serum albumin, PMSF (Sigma-Aldrich), 20–40 μl of total protein extract, and 0.08 mM malonyl CoA, in a total volume of 1 ml. The decrease in NADPH was measured spectrophotometrically in a quartz cuvette at 340 nm. The blank rate for NADPH oxidation was measured prior to the addition of malonyl CoA and was subtracted from the total rate of NADPH oxidation in the presence of malonyl CoA.
Protein degradation assay
Protein degradation was assayed as previously described (Schlumpberger et al, 1997). Briefly, cells were grown overnight in SD medium, diluted to OD 0.2, and grown to OD 0.8. The cells were washed and then resuspended for 12 h in SD medium (without methionine or cysteine) containing 100 μCi [35S] of methionine/cysteine mix (Danyel Biotech). Cells were collected, washed three times in SD-N, and resuspended in SD-N for the indicated times. At each time point, a 900-μl cell sample was mixed with 100 μl of trichloroacetic acid (TCA) (final concentration 10%) and incubated on ice for at least 4 h. Released acid-soluble radioactivity was determined by subjecting the samples to centrifugation for 10 min at 14,000 × g and then mixing 900 μl of the supernatant with 5 ml of scintillation liquid. For determination of the total incorporated radioactivity, pellets from the 0-h samples were washed five times with SD-N containing 10% TCA and twice with ethanol–ether (1:1). They were then air-dried and dissolved in 1 ml of 4% sodium dodecyl sulfate (SDS) and 2% Triton X-100. A 900-μl volume of the solution was mixed with 5 ml of scintillation liquid, and radioactivity was determined with a scintillation counter. Protein breakdown was calculated as the increase in the ratio of TCA-soluble to TCA-insoluble activity of the 0-h sample.
Pulse and chase
Early log-phase yeasts were grown in SC-Met medium for 1 h, and 10 OD600 U were later incubated in 300 μl of SC-Met with 0.5 mCi [35S] of methionine/cysteine mix for 30 min. Following two washes with DDW, chase was initiated by the addition of cold methionine/cysteine to a final concentration of 10 mM. At the indicated time points, 600 μl of cells was collected, lysed, and immunoprecipitated using rabbit polyclonal anti-Ape1 antibody. Immunoprecipitated proteins were subjected to SDS–polyacrylamide gel electrophoresis (SDS–PAGE) and transferred to a nitrocellulose membrane. The gel was exposed to X-ray film for detection of radioactive signals.
Lipid droplet isolation
Lipid droplets were isolated as previously described (Leber et al, 1994). Briefly, spheroplasts were resuspended in lysis buffer (12% Ficoll 400, 10 mM MES–Tris pH 6.9, 0.2 mM EDTA) and centrifuged (5,000 × g, 5 min). The homogenate was overlaid with lysis buffer and subjected to flotation by centrifugation at 100,000 × g for 1 h. The floating fraction (L1) was collected, overlaid with 8% Ficoll in 10 mM MES–Tris pH 6.9, 0.2 mM EDTA, and centrifuged at 100,000 × g for 1 h. The second floating fraction (L2) was collected, diluted with 0.6 M sorbitol in 8% Ficoll, 10 mM MES–Tris pH 6.9, 0.2 mM EDTA, overlaid with 0.25 M sorbitol in MES–Tris pH 6.9, 0.2 mM EDTA, and subjected to flotation by centrifugation at 100,000 × g for 1 h (L3). LDs were collected and analyzed by SDS–PAGE.
Subcellular fractionation
Cell lysates were prepared according to Harding et al (1995) and Ishihara et al (2001). Briefly, cells (200 OD600 U) were harvested, washed with 100 mM Tris–HCl pH 9.0 and 40 mM 2-mercaptoethanol, and resuspended in 10 ml of SD-N containing 1 M sorbitol and 20 mM Tris–HCl pH 7.5. Cells were converted to spheroplasts by the addition of Zymolyase 20T (Seikagaku, NC9934469). Spheroplasts were harvested, washed with 1 M sorbitol, resuspended at 30 OD600 U/ml in 20 mM 1,4-piperazinediethanesulfonic acid-KOH, pH 6.8, 200 mM sorbitol, 1 mM PMSF, and protease inhibitor cocktail, and incubated on ice for 5 min. Lysates were cleared by two consecutive centrifugations (500 × g, 5 min). The lysate was spun at 13,000 × g for 15 min to obtain the pellet. The pellet was resuspended in lysis buffer and layered on top of sucrose gradient (1 ml 60%, 1 ml 37%, 1.5 ml 34%, 2 ml 32%, 2 ml 29%, 1 ml 27%, 1.5 ml 22%, 0.5 ml 10% sucrose).
Acknowledgments
Z.E. is an incumbent of the Harold Korda Chair of Biology. We are grateful for funding from the Israel Science Foundation ISF (Grant no. 535/11), the German-Israeli Foundation GIF (Grant no. 1129/157), the Legacy Heritage Fund (Grant no. 1309/13), and the Weizmann Institute Minerva center. We wish to thank Dr. Ohsumi Yoshinori (Frontier Research Center, Tokyo Institute of Technology, Yokohama 226-8503, Japan) for plasmids and antibodies and Dr. Michael Thumm (Institute of Cellular Biochemistry, University Medicine, Georg-August University, Göttingen, Germany) for the Fas1 antibody. We thank Dr. Sten Stymne generously providing lipid droplet mutant strains. We thank Dr. Gunther Daum (Institute of Biochemistry, Graz University of Technology, NaWi Graz, Austria) and Dr. Roger Schneiter (Division of Biochemistry, Department of Biology, University of Fribourg, Fribourg, Switzerland) for extensive help with strains and antibodies. We thank Dr. Tobias Walther (Department of Genetics and Complex Diseases, Harvard T.H. Chan School of Public Health, Boston, Massachusetts, the Department of Cell Biology, Harvard Medical School and the Broad Institute of MIT and Harvard, Cambridge, Massachusetts) and Pablo Mardones Hiche for the inducible lipid droplet strain. We also thank Dr. Maya Schuldiner (Department of Molecular Genetics, Weizmann Institute of Science, Rehovot, Israel) for antibodies, reagents, and helpful suggestions. And we thank Dr. Hagai Abeliovich (Department of Biochemistry, Food Science and Nutrition, Hebrew University of Jerusalem, Rehovot, Israel) for helpful suggestions and valuable comments.
Author contributions
TS and ZE designed research; TS, EW, NB, NA, and MM performed research; TS, FR, and ZE analyzed data; and TS and ZE wrote the paper.
Conflict of interest
The authors declare that they have no conflict of interest.
Supporting Information
Expanded View Figures PDF
Table EV1
Review Process File
Source Data for Figure 1
Source Data for Figure 2
Source Data for Figure 3
Source Data for Figure 4
Source Data for Figure 5
Source Data for Figure 6
Source Data for Figure 7
Source Data for Expanded View
References
- Abada A, Elazar Z. Getting ready for building: signaling and autophagosome biogenesis. EMBO Rep. 2014;15:839–852. doi: 10.15252/embr.201439076. [DOI] [PMC free article] [PubMed] [Google Scholar]
- Amar N, Lustig G, Ichimura Y, Ohsumi Y, Elazar Z. Two newly identified sites in the ubiquitin-like protein Atg8 are essential for autophagy. EMBO Rep. 2006;7:635–642. doi: 10.1038/sj.embor.7400698. [DOI] [PMC free article] [PubMed] [Google Scholar]
- Athenstaedt K, Daum G. YMR313c/TGL3 encodes a novel triacylglycerol lipase located in lipid particles of Saccharomyces cerevisiae. J Biol Chem. 2003;278:23317–23323. doi: 10.1074/jbc.M302577200. [DOI] [PubMed] [Google Scholar]
- Athenstaedt K, Daum G. Tgl4p and Tgl5p, two triacylglycerol lipases of the yeast Saccharomyces cerevisiae are localized to lipid particles. J Biol Chem. 2005;280:37301–37309. doi: 10.1074/jbc.M507261200. [DOI] [PubMed] [Google Scholar]
- Axe EL, Walker SA, Manifava M, Chandra P, Roderick HL, Habermann A, Griffiths G, Ktistakis NT. Autophagosome formation from membrane compartments enriched in phosphatidylinositol 3-phosphate and dynamically connected to the endoplasmic reticulum. J Cell Biol. 2008;182:685–701. doi: 10.1083/jcb.200803137. [DOI] [PMC free article] [PubMed] [Google Scholar]
- Baba M, Osumi M, Scott SV, Klionsky DJ, Ohsumi Y. Two distinct pathways for targeting proteins from the cytoplasm to the vacuole/lysosome. J Cell Biol. 1997;139:1687–1695. doi: 10.1083/jcb.139.7.1687. [DOI] [PMC free article] [PubMed] [Google Scholar]
- Beller M, Thiel K, Thul PJ, Jackle H. Lipid droplets: a dynamic organelle moves into focus. FEBS Lett. 2010;584:2176–2182. doi: 10.1016/j.febslet.2010.03.022. [DOI] [PubMed] [Google Scholar]
- Debelyy MO, Thoms S, Connerth M, Daum G, Erdmann R. Involvement of the Saccharomyces cerevisiae hydrolase Ldh1p in lipid homeostasis. Eukaryot Cell. 2011;10:776–781. doi: 10.1128/EC.05040-11. [DOI] [PMC free article] [PubMed] [Google Scholar]
- Dupont N, Chauhan S, Arko-Mensah J, Castillo EF, Masedunskas A, Weigert R, Robenek H, Proikas-Cezanne T, Deretic V. Neutral Lipid Stores and Lipase PNPLA5 Contribute to Autophagosome Biogenesis. Curr Biol. 2014;24:609–620. doi: 10.1016/j.cub.2014.02.008. [DOI] [PMC free article] [PubMed] [Google Scholar]
- Elble R. A simple and efficient procedure for transformation of yeasts. Biotechniques. 1992;13:18–20. [PubMed] [Google Scholar]
- Farese RV, Jr, Walther TC. Lipid droplets finally get a little R-E-S-P-E-C-T. Cell. 2009;139:855–860. doi: 10.1016/j.cell.2009.11.005. [DOI] [PMC free article] [PubMed] [Google Scholar]
- Fujimoto T, Ohsaki Y, Cheng J, Suzuki M, Shinohara Y. Lipid droplets: a classic organelle with new outfits. Histochem Cell Biol. 2008;130:263–279. doi: 10.1007/s00418-008-0449-0. [DOI] [PMC free article] [PubMed] [Google Scholar]
- Greenspan P, Mayer EP, Fowler SD. Nile red: a selective fluorescent stain for intracellular lipid droplets. J Cell Biol. 1985;100:965–973. doi: 10.1083/jcb.100.3.965. [DOI] [PMC free article] [PubMed] [Google Scholar]
- Griffith J, Mari M, De Maziere A, Reggiori F. A cryosectioning procedure for the ultrastructural analysis and the immunogold labelling of yeast Saccharomyces cerevisiae. Traffic. 2008;9:1060–1072. doi: 10.1111/j.1600-0854.2008.00753.x. [DOI] [PubMed] [Google Scholar]
- Guthrie C, Fink GR. Guide to Yeast Genetics and Molecular Biology. San Diego: Academic Press; 1991. [Google Scholar]
- Hailey DW, Rambold AS, Satpute-Krishnan P, Mitra K, Sougrat R, Kim PK, Lippincott-Schwartz J. Mitochondria supply membranes for autophagosome biogenesis during starvation. Cell. 2010;141:656–667. doi: 10.1016/j.cell.2010.04.009. [DOI] [PMC free article] [PubMed] [Google Scholar]
- Hanada T, Noda NN, Satomi Y, Ichimura Y, Fujioka Y, Takao T, Inagaki F, Ohsumi Y. The Atg12-Atg5 conjugate has a novel E3-like activity for protein lipidation in autophagy. J Biol Chem. 2007;282:37298–37302. doi: 10.1074/jbc.C700195200. [DOI] [PubMed] [Google Scholar]
- Harding TM, Morano KA, Scott SV, Klionsky DJ. Isolation and characterization of yeast mutants in the cytoplasm to vacuole protein targeting pathway. J Cell Biol. 1995;131:591–602. doi: 10.1083/jcb.131.3.591. [DOI] [PMC free article] [PubMed] [Google Scholar]
- Hayashi-Nishino M, Fujita N, Noda T, Yamaguchi A, Yoshimori T, Yamamoto A. A subdomain of the endoplasmic reticulum forms a cradle for autophagosome formation. Nat Cell Biol. 2009;11:1433–1437. doi: 10.1038/ncb1991. [DOI] [PubMed] [Google Scholar]
- Henry SA. Death resulting from fatty acid starvation in yeast. J Bacteriol. 1973;116:1293–1303. doi: 10.1128/jb.116.3.1293-1303.1973. [DOI] [PMC free article] [PubMed] [Google Scholar]
- Ishihara N, Hamasaki M, Yokota S, Suzuki K, Kamada Y, Kihara A, Yoshimori T, Noda T, Ohsumi Y. Autophagosome requires specific early Sec proteins for its formation and NSF/SNARE for vacuolar fusion. Mol Biol Cell. 2001;12:3690–3702. doi: 10.1091/mbc.12.11.3690. [DOI] [PMC free article] [PubMed] [Google Scholar]
- Jacquier N, Choudhary V, Mari M, Toulmay A, Reggiori F, Schneiter R. Lipid droplets are functionally connected to the endoplasmic reticulum in Saccharomyces cerevisiae. J Cell Sci. 2011;124:2424–2437. doi: 10.1242/jcs.076836. [DOI] [PubMed] [Google Scholar]
- Jensen-Pergakes K, Guo Z, Giattina M, Sturley SL, Bard M. Transcriptional regulation of the two sterol esterification genes in the yeast Saccharomyces cerevisiae. J Bacteriol. 2001;183:4950–4957. doi: 10.1128/JB.183.17.4950-4957.2001. [DOI] [PMC free article] [PubMed] [Google Scholar]
- Jones L, Tedrick K, Baier A, Logan MR, Eitzen G. Cdc42p is activated during vacuole membrane fusion in a sterol-dependent subreaction of priming. J Biol Chem. 2010;285:4298–4306. doi: 10.1074/jbc.M109.074609. [DOI] [PMC free article] [PubMed] [Google Scholar]
- Kirisako T, Ichimura Y, Okada H, Kabeya Y, Mizushima N, Yoshimori T, Ohsumi M, Takao T, Noda T, Ohsumi Y. The reversible modification regulates the membrane-binding state of Apg8/Aut7 essential for autophagy and the cytoplasm to vacuole targeting pathway. J Cell Biol. 2000;151:263–276. doi: 10.1083/jcb.151.2.263. [DOI] [PMC free article] [PubMed] [Google Scholar]
- Klionsky DJ, Cuervo AM, Seglen PO. Methods for monitoring autophagy from yeast to human. Autophagy. 2007;3:181–206. doi: 10.4161/auto.3678. [DOI] [PubMed] [Google Scholar]
- Koffel R, Tiwari R, Falquet L, Schneiter R. The Saccharomyces cerevisiae YLL012/YEH1, YLR020/YEH2, and TGL1 genes encode a novel family of membrane-anchored lipases that are required for steryl ester hydrolysis. Mol Cell Biol. 2005;25:1655–1668. doi: 10.1128/MCB.25.5.1655-1668.2005. [DOI] [PMC free article] [PubMed] [Google Scholar]
- Koffel R, Schneiter R. Yeh1 constitutes the major steryl ester hydrolase under heme-deficient conditions in Saccharomyces cerevisiae. Eukaryot Cell. 2006;5:1018–1025. doi: 10.1128/EC.00002-06. [DOI] [PMC free article] [PubMed] [Google Scholar]
- Krahmer N, Farese RV, Jr, Walther TC. Balancing the fat: lipid droplets and human disease. EMBO Mol Med. 2013;5:905–915. doi: 10.1002/emmm.201100671. [DOI] [PMC free article] [PubMed] [Google Scholar]
- Kurat CF, Natter K, Petschnigg J, Wolinski H, Scheuringer K, Scholz H, Zimmermann R, Leber R, Zechner R, Kohlwein SD. Obese yeast: triglyceride lipolysis is functionally conserved from mammals to yeast. J Biol Chem. 2006;281:491–500. doi: 10.1074/jbc.M508414200. [DOI] [PubMed] [Google Scholar]
- Kurat CF, Wolinski H, Petschnigg J, Kaluarachchi S, Andrews B, Natter K, Kohlwein SD. Cdk1/Cdc28-dependent activation of the major triacylglycerol lipase Tgl4 in yeast links lipolysis to cell-cycle progression. Mol Cell. 2009;33:53–63. doi: 10.1016/j.molcel.2008.12.019. [DOI] [PubMed] [Google Scholar]
- Kushnirov VV. Rapid and reliable protein extraction from yeast. Yeast. 2000;16:857–860. doi: 10.1002/1097-0061(20000630)16:9<857::AID-YEA561>3.0.CO;2-B. [DOI] [PubMed] [Google Scholar]
- Leber R, Zinser E, Zellnig G, Paltauf F, Daum G. Characterization of lipid particles of the yeast, Saccharomyces cerevisiae. Yeast. 1994;10:1421–1428. doi: 10.1002/yea.320101105. [DOI] [PubMed] [Google Scholar]
- Lomakin IB, Xiong Y, Steitz TA. The crystal structure of yeast fatty acid synthase, a cellular machine with eight active sites working together. Cell. 2007;129:319–332. doi: 10.1016/j.cell.2007.03.013. [DOI] [PubMed] [Google Scholar]
- Lynch-Day MA, Klionsky DJ. The Cvt pathway as a model for selective autophagy. FEBS Lett. 2010;584:1359–1366. doi: 10.1016/j.febslet.2010.02.013. [DOI] [PMC free article] [PubMed] [Google Scholar]
- Lynen F. Yeast fatty acid synthetase. Methods Enzymol. 1969;14:17–33. [Google Scholar]
- van Manen HJ, Kraan YM, Roos D, Otto C. Single-cell Raman and fluorescence microscopy reveal the association of lipid bodies with phagosomes in leukocytes. Proc Natl Acad Sci USA. 2005;102:10159–10164. doi: 10.1073/pnas.0502746102. [DOI] [PMC free article] [PubMed] [Google Scholar]
- Mari M, Griffith J, Rieter E, Krishnappa L, Klionsky DJ, Reggiori F. An Atg9-containing compartment that functions in the early steps of autophagosome biogenesis. J Cell Biol. 2010;190:1005–1022. doi: 10.1083/jcb.200912089. [DOI] [PMC free article] [PubMed] [Google Scholar]
- Markgraf DF, Klemm RW, Junker M, Hannibal-Bach HK, Ejsing CS, Rapoport TA. An ER protein functionally couples neutral lipid metabolism on lipid droplets to membrane lipid synthesis in the ER. Cell Rep. 2014;6:44–55. doi: 10.1016/j.celrep.2013.11.046. [DOI] [PMC free article] [PubMed] [Google Scholar]
- Nair U, Jotwani A, Geng J, Gammoh N, Richerson D, Yen WL, Griffith J, Nag S, Wang K, Moss T, Baba M, McNew JA, Jiang X, Reggiori F, Melia TJ, Klionsky DJ. SNARE proteins are required for macroautophagy. Cell. 2011;146:290–302. doi: 10.1016/j.cell.2011.06.022. [DOI] [PMC free article] [PubMed] [Google Scholar]
- Nair U, Yen WL, Mari M, Cao Y, Xie Z, Baba M, Reggiori F, Klionsky DJ. A role for Atg8-PE deconjugation in autophagosome biogenesis. Autophagy. 2012;8:780–793. doi: 10.4161/auto.19385. [DOI] [PMC free article] [PubMed] [Google Scholar]
- Nakatogawa H, Ishii J, Asai E, Ohsumi Y. Atg4 recycles inappropriately lipidated Atg8 to promote autophagosome biogenesis. Autophagy. 2012a;8:177–186. doi: 10.4161/auto.8.2.18373. [DOI] [PubMed] [Google Scholar]
- Nakatogawa H, Ohbayashi S, Sakoh-Nakatogawa M, Kakuta S, Suzuki SW, Kirisako H, Kondo-Kakuta C, Noda NN, Yamamoto H, Ohsumi Y. The autophagy-related protein kinase Atg1 interacts with the ubiquitin-like protein Atg8 via the Atg8 family interacting motif to facilitate autophagosome formation. J Biol Chem. 2012b;287:28503–28507. doi: 10.1074/jbc.C112.387514. [DOI] [PMC free article] [PubMed] [Google Scholar]
- Noda T. Viability assays to monitor yeast autophagy. Methods Enzymol. 2008;451:27–32. doi: 10.1016/S0076-6879(08)03202-3. [DOI] [PubMed] [Google Scholar]
- Noda T, Klionsky DJ. The quantitative Pho8Delta60 assay of nonspecific autophagy. Methods Enzymol. 2008;451:33–42. doi: 10.1016/S0076-6879(08)03203-5. [DOI] [PubMed] [Google Scholar]
- Payne VA, Grimsey N, Tuthill A, Virtue S, Gray SL, Dalla Nora E, Semple RK, O’Rahilly S, Rochford JJ. The human lipodystrophy gene BSCL2/seipin may be essential for normal adipocyte differentiation. Diabetes. 2008;57:2055–2060. doi: 10.2337/db08-0184. [DOI] [PMC free article] [PubMed] [Google Scholar]
- Petschnigg J, Wolinski H, Kolb D, Zellnig G, Kurat CF, Natter K, Kohlwein SD. Good fat, essential cellular requirements for triacylglycerol synthesis to maintain membrane homeostasis in yeast. J Biol Chem. 2009;284:30981–30993. doi: 10.1074/jbc.M109.024752. [DOI] [PMC free article] [PubMed] [Google Scholar]
- Ploier B, Scharwey M, Koch B, Schmidt C, Schatte J, Rechberger G, Kollroser M, Hermetter A, Daum G. Screening for hydrolytic enzymes reveals Ayr1p as a novel triacylglycerol lipase in Saccharomyces cerevisiae. J Biol Chem. 2013;288:36061–36072. doi: 10.1074/jbc.M113.509927. [DOI] [PMC free article] [PubMed] [Google Scholar]
- Rajakumari S, Grillitsch K, Daum G. Synthesis and turnover of non-polar lipids in yeast. Prog Lipid Res. 2008;47:157–171. doi: 10.1016/j.plipres.2008.01.001. [DOI] [PubMed] [Google Scholar]
- Rambold AS, Cohen S, Lippincott-Schwartz J. Fatty acid trafficking in starved cells: regulation by lipid droplet lipolysis, autophagy, and mitochondrial fusion dynamics. Dev Cell. 2015;32:678–692. doi: 10.1016/j.devcel.2015.01.029. [DOI] [PMC free article] [PubMed] [Google Scholar]
- Ravikumar B, Moreau K, Jahreiss L, Puri C, Rubinsztein DC. Plasma membrane contributes to the formation of pre-autophagosomal structures. Nat Cell Biol. 2010a;12:747–757. doi: 10.1038/ncb2078. [DOI] [PMC free article] [PubMed] [Google Scholar]
- Ravikumar B, Sarkar S, Davies JE, Futter M, Garcia-Arencibia M, Green-Thompson ZW, Jimenez-Sanchez M, Korolchuk VI, Lichtenberg M, Luo S, Massey DC, Menzies FM, Moreau K, Narayanan U, Renna M, Siddiqi FH, Underwood BR, Winslow AR, Rubinsztein DC. Regulation of mammalian autophagy in physiology and pathophysiology. Physiol Rev. 2010b;90:1383–1435. doi: 10.1152/physrev.00030.2009. [DOI] [PubMed] [Google Scholar]
- Ren J, Pei-Chen Lin C, Pathak MC, Temple BR, Nile AH, Mousley CJ, Duncan MC, Eckert DM, Leiker TJ, Ivanova PT, Myers DS, Murphy RC, Brown HA, Verdaasdonk J, Bloom KS, Ortlund EA, Neiman AM, Bankaitis VA. A phosphatidylinositol transfer protein integrates phosphoinositide signaling with lipid droplet metabolism to regulate a developmental program of nutrient stress-induced membrane biogenesis. Mol Biol Cell. 2014;25:712–727. doi: 10.1091/mbc.E13-11-0634. [DOI] [PMC free article] [PubMed] [Google Scholar]
- Rubinsztein DC, Shpilka T, Elazar Z. Mechanisms of autophagosome biogenesis. Curr Biol. 2012;22:R29–R34. doi: 10.1016/j.cub.2011.11.034. [DOI] [PubMed] [Google Scholar]
- Sandager L, Gustavsson MH, Stahl U, Dahlqvist A, Wiberg E, Banas A, Lenman M, Ronne H, Stymne S. Storage lipid synthesis is non-essential in yeast. J Biol Chem. 2002;277:6478–6482. doi: 10.1074/jbc.M109109200. [DOI] [PubMed] [Google Scholar]
- Schlumpberger M, Schaeffeler E, Straub M, Bredschneider M, Wolf DH, Thumm M. AUT1, a gene essential for autophagocytosis in the yeast Saccharomyces cerevisiae. J Bacteriol. 1997;179:1068–1076. doi: 10.1128/jb.179.4.1068-1076.1997. [DOI] [PMC free article] [PubMed] [Google Scholar]
- Schweizer E, Bolling H. A Saccharomyces cerevisiae mutant defective in saturated fatty acid biosynthesis. Proc Natl Acad Sci USA. 1970;67:660–666. doi: 10.1073/pnas.67.2.660. [DOI] [PMC free article] [PubMed] [Google Scholar]
- Shibata M, Yoshimura K, Tamura H, Ueno T, Nishimura T, Inoue T, Sasaki M, Koike M, Arai H, Kominami E, Uchiyama Y. LC3, a microtubule-associated protein1A/B light chain3, is involved in cytoplasmic lipid droplet formation. Biochem Biophys Res Commun. 2010;393:274–279. doi: 10.1016/j.bbrc.2010.01.121. [DOI] [PubMed] [Google Scholar]
- Shibutani ST, Yoshimori T. A current perspective of autophagosome biogenesis. Cell Res. 2014;24:58–68. doi: 10.1038/cr.2013.159. [DOI] [PMC free article] [PubMed] [Google Scholar]
- Shintani T, Klionsky DJ. Cargo proteins facilitate the formation of transport vesicles in the cytoplasm to vacuole targeting pathway. J Biol Chem. 2004;279:29889–29894. doi: 10.1074/jbc.M404399200. [DOI] [PMC free article] [PubMed] [Google Scholar]
- Shpilka T, Mizushima N, Elazar Z. Ubiquitin-like proteins and autophagy at a glance. J Cell Sci. 2012;125:2343–2348. doi: 10.1242/jcs.093757. [DOI] [PubMed] [Google Scholar]
- Simha V, Garg A. Phenotypic heterogeneity in body fat distribution in patients with congenital generalized lipodystrophy caused by mutations in the AGPAT2 or seipin genes. J Clin Endocrinol Metab. 2003;88:5433–5437. doi: 10.1210/jc.2003-030835. [DOI] [PubMed] [Google Scholar]
- Singh R, Kaushik S, Wang Y, Xiang Y, Novak I, Komatsu M, Tanaka K, Cuervo AM, Czaja MJ. Autophagy regulates lipid metabolism. Nature. 2009;458:1131–1135. doi: 10.1038/nature07976. [DOI] [PMC free article] [PubMed] [Google Scholar]
- Sorger D, Daum G. Synthesis of triacylglycerols by the acyl-coenzyme A: diacyl-glycerol acyltransferase Dga1p in lipid particles of the yeast Saccharomyces cerevisiae. J Bacteriol. 2002;184:519–524. doi: 10.1128/JB.184.2.519-524.2002. [DOI] [PMC free article] [PubMed] [Google Scholar]
- Suzuki K, Kirisako T, Kamada Y, Mizushima N, Noda T, Ohsumi Y. The pre-autophagosomal structure organized by concerted functions of APG genes is essential for autophagosome formation. EMBO J. 2001;20:5971–5981. doi: 10.1093/emboj/20.21.5971. [DOI] [PMC free article] [PubMed] [Google Scholar]
- Suzuki K, Kubota Y, Sekito T, Ohsumi Y. Hierarchy of Atg proteins in pre-autophagosomal structure organization. Genes Cells. 2007;12:209–218. doi: 10.1111/j.1365-2443.2007.01050.x. [DOI] [PubMed] [Google Scholar]
- Takeshige K, Baba M, Tsuboi S, Noda T, Ohsumi Y. Autophagy in yeast demonstrated with proteinase-deficient mutants and conditions for its induction. J Cell Biol. 1992;119:301–311. doi: 10.1083/jcb.119.2.301. [DOI] [PMC free article] [PubMed] [Google Scholar]
- Tedrick K, Trischuk T, Lehner R, Eitzen G. Enhanced membrane fusion in sterol-enriched vacuoles bypasses the Vrp1p requirement. Mol Biol Cell. 2004;15:4609–4621. doi: 10.1091/mbc.E04-03-0194. [DOI] [PMC free article] [PubMed] [Google Scholar]
- Vance D, Goldberg I, Mitsuhashi O, Bloch K. Inhibition of fatty acid synthetases by the antibiotic cerulenin. Biochem Biophys Res Commun. 1972;48:649–656. doi: 10.1016/0006-291x(72)90397-x. [DOI] [PubMed] [Google Scholar]
- Wakil SJ, Stoops JK, Joshi VC. Fatty acid synthesis and its regulation. Annu Rev Biochem. 1983;52:537–579. doi: 10.1146/annurev.bi.52.070183.002541. [DOI] [PubMed] [Google Scholar]
- Walther TC, Farese RV., Jr Lipid droplets and cellular lipid metabolism. Annu Rev Biochem. 2012;81:687–714. doi: 10.1146/annurev-biochem-061009-102430. [DOI] [PMC free article] [PubMed] [Google Scholar]
- Wang CW, Miao YH, Chang YS. Control of lipid droplet size in budding yeast requires the collaboration between Fld1 and Ldb16. J Cell Sci. 2014a;127:1214–1228. doi: 10.1242/jcs.137737. [DOI] [PubMed] [Google Scholar]
- Wang CW, Miao YH, Chang YS. A sterol-enriched vacuolar microdomain mediates stationary phase lipophagy in budding yeast. J Cell Biol. 2014b;206:357–366. doi: 10.1083/jcb.201404115. [DOI] [PMC free article] [PubMed] [Google Scholar]
- Weidberg H, Shvets E, Elazar Z. Biogenesis and cargo selectivity of autophagosomes. Annu Rev Biochem. 2011;80:125–156. doi: 10.1146/annurev-biochem-052709-094552. [DOI] [PubMed] [Google Scholar]
- Yla-Anttila P, Vihinen H, Jokitalo E, Eskelinen EL. 3D tomography reveals connections between the phagophore and endoplasmic reticulum. Autophagy. 2009;5:1180–1185. doi: 10.4161/auto.5.8.10274. [DOI] [PubMed] [Google Scholar]
- Young AR, Chan EY, Hu XW, Kochl R, Crawshaw SG, High S, Hailey DW, Lippincott-Schwartz J, Tooze SA. Starvation and ULK1-dependent cycling of mammalian Atg9 between the TGN and endosomes. J Cell Sci. 2006;119:3888–3900. doi: 10.1242/jcs.03172. [DOI] [PubMed] [Google Scholar]
- van Zutphen T, Todde V, de Boer R, Kreim M, Hofbauer HF, Wolinski H, Veenhuis M, van der Klei IJ, Kohlwein SD. Lipid droplet autophagy in the yeast Saccharomyces cerevisiae. Mol Biol Cell. 2014;25:290–301. doi: 10.1091/mbc.E13-08-0448. [DOI] [PMC free article] [PubMed] [Google Scholar]
Associated Data
This section collects any data citations, data availability statements, or supplementary materials included in this article.
Supplementary Materials
Expanded View Figures PDF
Table EV1
Review Process File
Source Data for Figure 1
Source Data for Figure 2
Source Data for Figure 3
Source Data for Figure 4
Source Data for Figure 5
Source Data for Figure 6
Source Data for Figure 7
Source Data for Expanded View


