

Abstract
The epithelial to mesenchymal transition (EMT) is a biological process in which cells lose cell–cell contacts and become motile. EMT is used during development, for example, in triggering neural crest migration, and in cancer metastasis. Despite progress, the dynamics of JNK signaling, its role in genomewide transcriptional reprogramming, and involved downstream effectors during EMT remain largely unknown. Here, we show that JNK is not required for initiation, but progression of phenotypic changes associated with EMT. Such dependency resulted from JNK-driven transcriptional reprogramming of critical EMT genes and involved changes in their chromatin state. Furthermore, we identified eight novel JNK-induced transcription factors that were required for proper EMT. Three of these factors were also highly expressed in invasive cancer cells where they function in gene regulation to maintain mesenchymal identity. These factors were also induced during neuronal development and function in neuronal migration in vivo. These comprehensive findings uncovered a kinetically distinct role for the JNK pathway in defining the transcriptome that underlies mesenchymal identity and revealed novel transcription factors that mediate these responses during development and disease.
Keywords: EMT, gene regulation, JNK signaling, metastasis, transcription factors
Introduction
Epithelial to mesenchymal transition (EMT) refers to the phenotypic remodeling that involves changes such as cytoskeletal reorganization and loss of cell–cell junctions allowing epithelial cells to evade from their original location by acquiring a motile, migratory, mesenchymal phenotype (Hay, 2005). Such dramatic change in cell fate is essential during key developmental processes such as embryo implantation, embryonic layer formation during gastrulation, and neural crest migration (Pijnenborg et al, 1980; Perez-Pomares & Munoz-Chapuli, 2002; Acloque et al, 2009; Kalluri & Weinberg, 2009; Thiery et al, 2009; Nieto, 2011; Tiwari et al, 2012a). While widely employed during embryonic development, in adults, EMT is known to be only activated to ensure tissue regeneration and wound healing (Acloque et al, 2009; Nieto, 2009, 2011). However, aberrant activation of the EMT program is associated with disease phenotypes such as organ fibrosis (Zeisberg et al, 2007a,b; Potenta et al, 2008) as well as tumor progression and metastasis (Thiery, 2002; Tiwari et al, 2012a, 2013). A number of signaling pathways such as TGF-β, FGF, EGF, HGF, Wnt/beta-catenin, and Notch are known to induce EMT in vitro and in vivo (Thiery & Sleeman, 2006; Kalluri & Weinberg, 2009; Tiwari et al, 2012a, 2013).
TGF-β is among the most established drivers of EMT during development, cancer progression, and fibrosis (Nawshad et al, 2005; Nieto, 2011). TGF-β is further considered as prototypic EMT inducer, whereas other molecules display a more context-dependent action (Yang et al, 2005; Willis & Borok, 2007). TGF-β stimulation induces the canonical pathway in which Smad2 and Smad3 become C-terminally phosphorylated and form an active trimer with Smad4, which in turn translocates to the nucleus to bind target gene promoters for transcriptional regulation (Feng & Derynck, 2005; Xu et al, 2009). This results in gene expression changes that are crucial for mediating early steps of reprogramming from epithelial to mesenchymal identity including downregulation of classical epithelial and cell cycle genes as well as upregulation of mesenchymal markers (Postigo et al, 2003; Kowanetz et al, 2004; Barrallo-Gimeno & Nieto, 2005). It is also known that besides Smad-dependent signaling (canonical), TGF-β also induces Smad-independent signaling (non-canonical) via a number of additional cascades including MAP kinases (Hocevar et al, 1999; Yu et al, 2002; Chaudhury & Howe, 2009; Zhang, 2009; Gui et al, 2012). Chemical inhibition of these non-canonical signaling pathways including JNK or perturbation of their components alters EMT, suggesting their important function during epithelial to mesenchymal transition (Santibanez, 2006; Alcorn et al, 2008; Liu et al, 2008; Gui et al, 2012). However, the contribution of JNK pathway to global transcriptional reprogramming underlying cell-fate changes during EMT remains elusive. Furthermore, epigenetic mechanisms and the repertoire of transcription factors that function downstream of JNK signaling during EMT are not known.
Here, we reveal the functional kinetics of JNK signaling during EMT in mammary epithelial cells and show that it is not required for onset but for the progression of phenotypic changes hallmark of EMT. We further reveal the underlying cause by showing that the transcriptional reprogramming of many critical EMT genes relies on JNK signaling as cells progress to a mesenchymal state. Such JNK-dependent gene regulation involves modulation of the epigenetic state as well as chromatin packaging at target gene promoters. We further identified eight previously uncharacterized transcription factors that rely on JNK signaling for their expression during mesenchymal progression. Depletion of these factors perturbs phenotypic properties of EMT and reverses EMT gene signature. We find that three of these factors are also crucial for maintaining the mesenchymal identity by regulating expression of a large number of metastasis-relevant genes. Importantly, these factors show significantly higher expression in invasive tumors which exhibit high JNK and low Smad signaling. These transcription factors are similarly induced during neurogenesis in a JNK-dependent fashion and regulate neuronal EMT during development. This study goes beyond previous notions on the involvement of JNK signaling in EMT, detailing kinetically distinct modes of JNK activity during the process and establishing its role in the maintenance of the mesenchymal fate via regulation of critical genes. Importantly further, these comprehensive findings uncover JNK-dependent gene regulatory circuitry underlying cell-fate changes from epithelial to mesenchymal state and, at the same time, reveal novel transcription factors that participate in mediating these changes during development and disease.
Results
JNK shows kinetically distinct phase of activation during EMT and progressively overtakes as a critical determinant of mesenchymal properties
To decipher gene regulatory mechanisms underlying EMT, we used untransformed normal murine mammary gland (NMuMG) epithelial cells exposed to TGF-β, which is an established model for EMT in cell culture (Maeda et al, 2005; Tiwari et al, 2013). Over a period of 7 days of exposure to TGF-β, we found that NMuMG cells lost markers of cell–cell junctions, increased stress fiber formation, and increased the production of extracellular matrix and focal adhesion proteins (Supplementary Fig S1A), consistent with the acquisition of a complete mesenchymal identity. To determine whether TGF-β-induced EMT requires de novo transcription and translation and cannot be established exclusively by signaling-mediated modulation of the existing proteome, we treated NMuMG cells with inhibitors of transcription or translation shortly before exposure to TGF-β and observed that EMT was completely blocked under these conditions (Supplementary Fig S1B).
To understand specifically which genes changed expression during TGF-β-induced EMT, we performed high coverage deep sequencing of the transcriptome (RNA-Seq) at several time points of TGF-β exposure (day 0, day 1, day 4, and day 7) spanning early, intermediate, and late stages of EMT. The time-resolved TGF-β-dependent transcriptomes revealed many known EMT-associated changes in gene expression, including the classical cadherin switch, lincRNAs such as Malat1, other genes enriched for gene ontology (GO) annotations hallmark of EMT (Kalluri & Weinberg, 2009) (Ying et al, 2012), as well as a number of genes that were previously unknown to be modulated during specific phases of EMT (Fig1A–C; Supplementary Fig S1C–J). We further confirmed that these transcriptional changes during EMT were specifically induced by TGF-β and were not a result of culture conditions (Supplementary Fig S1K).
Figure 1.

JNK signaling is activated during a distinct phase of EMT and progressively becomes a critical determinant of mesenchymal identity
- A Heatmap showing standardized expression (Z-scores) of genes differentially expressed upon TGF-β-induced EMT in NMuMG cells.
- B, C Venn diagram showing overlap of upregulated (B) and downregulated (C) genes at individual time points.
- D Representative immunoblots (n = 3) showing the phosphorylation state of Smad2 and JNK during TGF-β-induced EMT in NMuMG cells. Lamin B serves as a loading control.
- E Quantification of one set of representative immunoblots (from D) and its graphical representation showing the dynamics of Smad2 and JNK activation during TGF-β-induced EMT in NMuMG.
- F Representative immunohistochemistry images for p-Smad2 and p-JNK in noninvasive (n = 34) and invasive (n = 14) breast cancer samples. Scale bars for 10× and 40× images are 200 and 50 μm, respectively.
- G Quantification of immunohistochemical staining for p-JNK and p-Smad2 as in (F) in invasive tumor samples (n = 34). The pie chart shows the percentage of tumors with high p-Smad2 and low p-JNK or high p-JNK and low p-Smad2 or equal p-Smad2 and p-JNK.
- H Immunofluorescence microscopy for changes in the localization and expression levels of EMT markers in epithelial NMuMG cells (d0) and cells treated with TGF-β for seven days in the presence of JNK inhibitor (d7 JNKi) or control (d7 DMSO). Staining was performed with antibodies against fibronectin-1, with phalloidin to visualize the actin cytoskeleton and against paxillin to detect focal adhesion plaques. It is important to note that the untreated epithelial cells are highly proliferative and appear small in size, round in shape, and adhere to surrounding cells, whereas day 7 TGF-β-treated (mesenchymal) cells are much bigger in size, elongated in shape, and detached from the nearby cells. Scale bar, 100 μm, 63× magnification.
- I mRNA levels for classical EMT markers in cells treated as in (H) were measured by qRT–PCR relative to Ctcf and fold changes as compared to untreated are plotted on the y-axis. Mean and SEM is plotted from three independent biological replicates.
- J Transwell migration assay for NMuMG cells treated as in (H). Plotted mean ± SEM of three biological replicates.
Data information: *P < 0.05, **P < 0.01, ***P < 0.001, Student’s t-test.
To gain insight into the upstream regulators of observed transcriptional remodeling, we investigated the dynamics of Smad-dependent and Smad-independent TGF-β signaling during EMT. We found that phosphorylation of Smad2 was induced as early as 30 min and then declined 6 h after exposure to TGF-β (Fig1D and E). In contrast, JNK showed a very distinct mode of activation as compared to Smad signaling. A high level of active JNK was detected only after 24 h, and this was maintained throughout EMT, including the later stages where Smad signaling loses activity (Fig1D and E). We also observed a similar pattern of phosphorylation of Smad2 and JNK in human epithelial (MCF7) and mesenchymal (BT549) breast cancer cell lines (Supplementary Fig S2A). To investigate whether such patterns are also observed in human cancers of different invasiveness, we analyzed these signaling pathways in various breast cancer samples. These findings show that a large fraction of invasive tumors exhibit high p-JNK and low p-Smad levels, whereas this pattern was not observed in noninvasive tumors (Fig1F and G; Supplementary Fig S2B and C, Supplementary Table S1). Furthermore, Smad signaling showed a significant decrease in invasive tumors as compared to noninvasive tumors, whereas JNK signaling was maintained equally high in both types of tumor samples (Supplementary Fig S2D). We further noticed a tendency toward higher JNK activity in high-grade invasive tumors, a finding that needs to be statistically validated in a larger cohort of samples (Supplementary Fig S2E).
We next assessed the contribution of canonical (Smad-dependent) and non-canonical (Smad-independent) pathways to TGF-β-induced JNK activation. Toward this, we analyzed phospho-JNK levels 24 h after TGF-β-stimulation following Smad4 depletion or blockage of Akt or PI3 kinase signaling. Interestingly, siRNA-mediated knockdown of Smad4 led to a significant reduction in p-JNK levels (Supplementary Fig S2F), while chemical inhibition of the Akt or PI3 kinase pathway led to a significant increase in JNK activity (Supplementary Fig S2G). Intrigued by these observations, we further analyzed whether Smad-independent pathways could influence JNK signaling even in the absence of TGF-β. Interestingly, while inhibition of PI3 kinase or ERK1/2 pathway did not influence JNK activity, blockage of Akt pathway led to induction of JNK signaling even in the absence of TGF-β (Supplementary Fig S2H).
Intrigued by the different activation kinetics of Smad and JNK pathways, we next attempted to test their functional requirement in distinct stages of TGF-β-induced EMT. siRNA-mediated depletion of Smad4 severely impaired the onset of EMT (Supplementary Fig S2I). In contrast, inhibition of JNK signaling in early stages did not affect the induction of EMT (Supplementary Fig S2J). However, JNK inhibition in later stages of EMT led to a drastic downregulation of crucial mesenchymal markers such as fibronectin and severe reduction in remodeling of the cytoskeleton from cortical actin to stress fibers as well as focal adhesion formation indicating a reversal toward the epithelial state (Fig1H). Such reversion of EMT following JNK inhibition was also accompanied by changes in the expression levels of classical EMT markers (Fig1I). These effects of inhibiting JNK signaling were also reflected in cellular properties such as a significant reduction in their migration capacity (Fig1J). The effectiveness of JNK inhibitor was validated by an observed decrease in the phosphorylation of downstream substrates during different time points of TGF-β-induced EMT (Supplementary Fig S3A, B, G and H). These observations were further validated using siRNA-mediated simultaneous knockdown of JNK1 and JNK2 (JNK1/2) as well as another established JNK inhibitor (JNK-IN-8), both of which caused similar reversal of EMT-associated features (Supplementary Fig S3C–F). Overall, these interesting data uncover a kinetically distinct mode of action by signaling cascades during EMT where Smad pathway initiates EMT while JNK acquires a dominant role in its progression.
Mesenchymal cells rely on active JNK signaling to define epigenome and transcriptome underlying their identity
The unique pattern of JNK activation and its requirement in mesenchymal progression during EMT prompted us to investigate whether this function involves gene regulatory events. Toward this, we carried out genomewide transcriptome analysis (RNA-Seq) at several time points during TGF-β-induced EMT in continuous presence of the JNK inhibitor. We observed no changes in gene expression profile during early stages of EMT (Fig2A), in agreement with the lack of phenotypic changes following JNK inhibition during early EMT (Supplementary Fig S2G). As cells progressed through advanced mesenchymal states, the effect of JNK inhibition on gene expression progressively became more prominent (Fig2A). While first differentially expressed genes following JNK inhibition were visible at 72 h of EMT (24 genes), major transcriptome changes were observed only at day 7 (611 genes) (Fig2A–C). A principle component analysis (PCA) on these datasets further confirmed the progressive dependency of EMT transcriptome on JNK signaling (Fig2D). The genes upregulated upon JNK inhibition contained cell cycle regulators (Ccnd1, Ccnf, and Ccng1) and epithelial genes (e.g., Fmn1, Brca1, and Ckap2) and were overall enriched for genes involved in defining epithelial identity (e.g., tight junction formation and cytoskeletal organization as well as cell cycle) (Supplementary Fig S4A and B). The downregulated genes included classical mesenchymal markers (e.g., Mcam, Fn1, Tnc), and GO term analysis further confirmed enrichment for genes defining mesenchymal properties (e.g., response to wounding, cytoskeletal reorganization, and migration) (Supplementary Fig S4C and D). Analysis of lincRNA expression revealed that JNK inhibition also affects expression of a selected set of lincRNAs only at day 7 of EMT (Supplementary Fig S4E and F). We further selected additional EMT-relevant genes that were upregulated upon treatment with the JNK inhibitor (Supplementary Fig S4G) and analyzed their expression following the addition of JNK inhibitor at various time points during EMT. These genes were similarly affected irrespective of whether the JNK inhibitor was present from the very beginning or employed later following onset or progression of EMT (Supplementary Fig S4H). This was also reflected in the analysis of EMT markers that showed similar reversal of EMT in all tested conditions (Supplementary Fig S4I).
Figure 2.

JNK signaling defines epigenome and transcriptome to specify mesenchymal fate
- A Volcano plots showing significantly differentially expressed genes upon treatment with the JNK inhibitor SP600125 (JNKi) as compared to DMSO at days 1, 2, 3, 4, and 7 during TGF-β-induced EMT in NMuMG cells. x-axis indicates fold change in log2 scale, while y-axis denotes −log10 of the P-value. Differentially expressed genes are depicted with red circles. Blue horizontal line represents FDR-adjusted P-value of 0.1.
- B, C Venn diagram showing the overlap of upregulated (B) and downregulated (C) genes in JNKi- versus DMSO-treated cells.
- D A principal component analysis (PCA) using RNA-Seq data was performed comparing two replicates (r1, r2) each of DMSO- and JNKi-treated samples at different time points during TGF-β-induced EMT (d1, d2, d3, d4, d7). The first two principal components are presented to display the variation between samples. The distances on the x-axis and y-axis explain 47 and 19% of variation in the data, respectively. Biological duplicates (r1 and r2) are depicted in the same color.
- E ChIP assay using H3K27me3-specific antibody in epithelial cells (day 0) or NMuMG cells treated for seven days with TGF-β (mesenchymal) and DMSO or JNKi. qRT–PCRs were performed for the indicated gene promoters, and enrichments are plotted on the right y-axis as ratio of precipitated DNA (bound) to total input DNA. On the left y-axis, RNA levels of analyzed genes derived from RNA-Seq data (fold change to untreated normalized tag counts) are plotted. Mean and SEM is plotted from three independent biological replicates.
- F FAIRE assay was performed in cells treated as in (E), and qRT–PCRs were performed for the same gene promoters and plotted as in (E). Mean and SEM is plotted from three independent biological replicates.
Having established that the mesenchymal transcriptome becomes progressively dependent on JNK signaling during EMT, we next asked whether this involves interplay with epigenetic machinery at the promoters of target genes. Polycomb repressive complex 2 (PRC2) mark trimethylation of lysine 27 of histone H3 (H3K27me3) has been implicated to play a role in the transcriptional reprogramming underlying EMT (Tiwari et al, 2013). Therefore, we performed ChIP assay using antibodies against the PRC2 mark H3K27me3 in epithelial and mesenchymal cells as well as mesenchymal cells treated with the JNK inhibitor. We next quantified H3K27me3 enrichments at a number of genes that were strongly downregulated upon EMT but were reverted back closer to epithelial cells following loss of JNK signaling. All tested genes showed a strong increase in H3K27me3 levels at their promoters during EMT, indicating that PcG complex is involved in their repression during EMT (Fig2E). Strikingly, such deposition of H3K27me3 was noticeably reduced in the absence of JNK activity (Fig2E). We further assessed whether such gain of PcG-associated mark during EMT accompanies changes in chromatin accessibility at these genes and thereby leading to a transcriptionally silenced state. Using FAIRE assay, we indeed find that these promoters lose chromatin accessibility during EMT. Interestingly further, JNK inhibition restores a more open chromatin state at many of these genes (Fig2F). Such chromatin changes were not observed at control loci (Supplementary Fig S4J). Together, these novel findings reveal that JNK signaling becomes progressively critical in gene regulation underlying EMT and involves epigenetic modulation at target gene promoters.
JNK-induced novel transcription factors are critically required for EMT
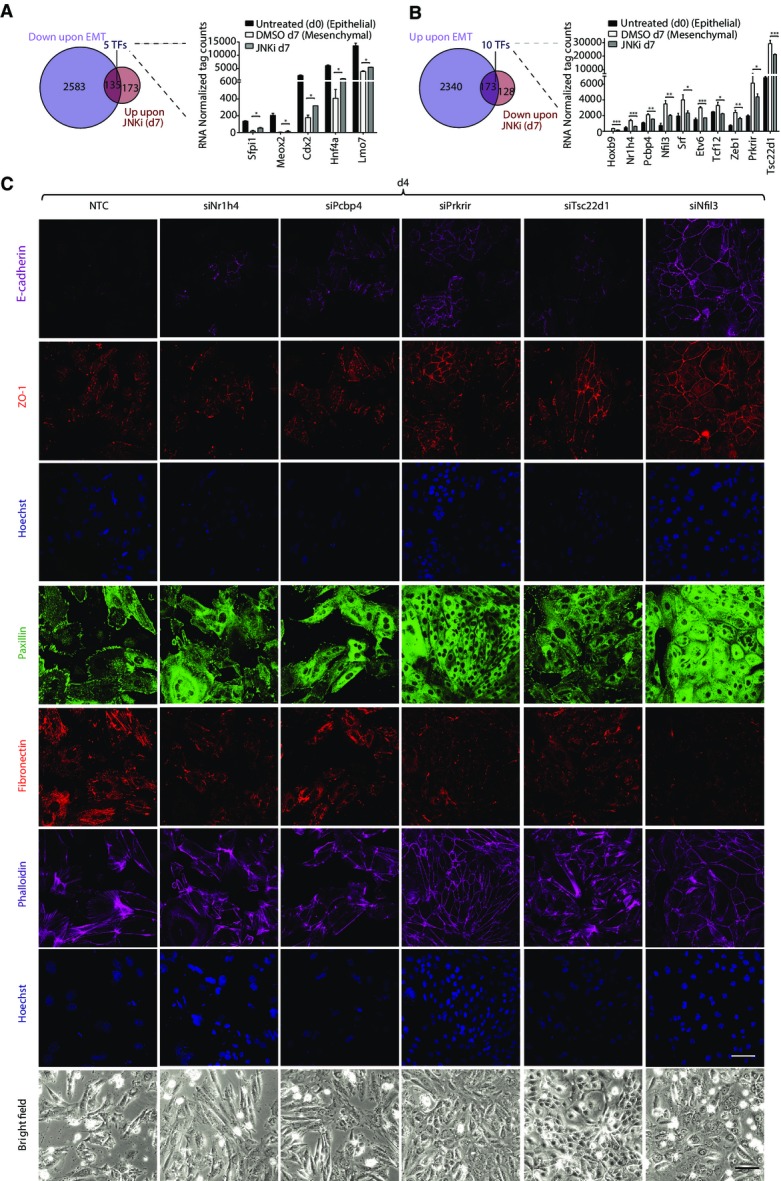
To uncover downstream components of the JNK-dependent gene regulatory network that could be critically involved in mesenchymal progression, we further explored the identity of genes that are misregulated in the absence of JNK signaling. Toward this, we compared JNK inhibitor-affected genes (Fig2B and C) with the transcriptome changes acquired during normal EMT (Fig1B and C). A comparative analysis revealed that 44% (n = 135) of genes that are upregulated in response to JNK inhibition were repressed during normal EMT (Fig3A). These genes show enrichment for GO terms associated with an epithelial cell fate such as cell cycle (Supplementary Fig S5A). Furthermore, overlap of genes downregulated upon JNK inhibition with genes that are induced during EMT revealed 57% (n = 173) of genes in common (Fig3B). These genes included hallmark mesenchymal genes (e.g., Fn1, Cdh2, Mcam, Zeb1, and Tnc) and showed GO term enrichments such as actin cytoskeletal reorganization, cell junction, and extracellular matrix organization (Supplementary Fig S5B). These findings further support our previous findings that the blockage of JNK signaling is able to significantly reverse the gene expression signature acquired during EMT. Having observed that a large number of genes rely on active JNK signaling for proper transcriptional dynamics during EMT, we next assessed whether JNK pathway regulates expression of any gene regulatory proteins during EMT that are then involved in mediating JNK-dependent transcriptional program. Computational analysis searching for transcription factors in these overlap lists revealed five and ten specific transcription factors that were up- and downregulated, respectively, following JNK inhibition (Fig.3A and B). These patterns were further validated by independent expression analyses (Supplementary Fig S5C and D).
Figure 3.
JNK-induced transcription factors are critically required for EMT
- Venn diagram showing overlap of genes upregulated upon JNKi treatment during EMT and downregulated during normal EMT at day 7 that contains five transcription factors. Right panel shows RNA levels (normalized tag counts) for these factors.
- Same overlap as in (A) for genes downregulated upon JNKi treatment during EMT and upregulated during normal EMT. Right panel displays RNA levels as in (A) for 10 transcription factors identified in this overlap.
- Representative bright-field and immunofluorescence images for localization and expression levels of EMT marker proteins after four days (d4) of siRNA-mediated depletion of factors compared to non-targeting control (NTC). Staining was performed with antibodies against epithelial markers E-cadherin and ZO-1, mesenchymal markers fibronectin-1, with phalloidin to visualize the actin cytoskeleton and against paxillin to detect focal adhesion plaques. Scale bar, 100 μm, 40× magnification.
Data information: Plotted are means ± SEM of three biological replicates. *P < 0.05, **P < 0.01, ***P < 0.001, Student’s t-test.
Out of five transcription factors (Sfpi1, Meox2, Cdx2, Hnf4a, and Lmo7) that are downregulated during EMT but transcriptionally induced following inhibition of JNK signaling, all are known to inhibit EMT and tumor progression as well as promote epithelial properties (Spath & Weiss, 1998; Walter et al, 2005; Rosenbauer et al, 2006; Valcourt et al, 2007; Ohshima et al, 2009; Tanaka-Okamoto et al, 2009; Santangelo et al, 2011). These data thus uncover JNK signaling as a novel upstream regulator functioning in suppression of these critical epithelial determinant genes during EMT. Among the ten transcription factors that are upregulated during EMT but become downregulated upon JNK inhibition, we identified Zeb1 and Srf that have an established role in tumor progression (Psichari et al, 2002; Thiery & Sleeman, 2006; Choi et al, 2009; Kalluri & Weinberg, 2009). Importantly however, the remaining eight factors have been either only partly (Tcf12, Etv6, Hoxb9) or never (Nr1h4. Pcbp4, Prkrir, Tsc22d1, Nfil3) investigated in the context of EMT. We, therefore, decided to explore the functional role of these eight factors in EMT progression. Toward this, we employed siRNA-mediated depletion of these factors during EMT and assessed its impact on cellular and molecular changes that accompany this process. Strikingly, knockdown of these factors perturbed morphological features hallmark of EMT as well as expression pattern of key EMT genes (Fig3C; Supplementary Fig S6A and B (for completely novel factors); Supplementary Fig S6C–E (for partly implicated factors)). These changes include drastic reduction in crucial mesenchymal markers such as fibronectin, overall increase in expression and relocalization of ZO-1 and E-cadherin to the membrane, reduction in remodeling of the cytoskeleton from cortical actin to stress fibers as well as focal adhesion formation, in addition to the increased cell-to-cell contact. These observations were further validated using independent siRNAs (Supplementary Fig S7A–D).
We next attempted to identify downstream components in the JNK pathway through which it may regulate expression of these genes. Toward this, we performed ChIP assay using antibodies against various transcription factors that are established JNK effectors in different contexts viz. ATF4, ATF2, EGR1, c-JUN, NF-YA, and ELK1 at day 7 of TGF-β-induced EMT in the presence and absence of JNK inhibitor and analyzed the promoter of these genes by quantitative PCRs. While most of these transcription factors did not show any enrichment, ATF2 was found to be binding at these gene promoters in mesenchymal cells and this occupancy was significantly diminished following JNK inhibition (Supplementary Fig S8A). Furthermore, such reduced binding of ATF2 at target genes following JNK inhibition was accompanied by a diminished nuclear localization of ATF2 (Supplementary Fig S8B).
The transcriptional regulation of these factors by JNK signaling was further validated by treatment with an alternate JNK inhibitor, JNK-IN-8, and siRNA-mediated knockdown of JNK1/2 during TGF-β-induced EMT that also showed downregulation of these genes following loss of JNK activity or protein (Supplementary Fig S8C and D). Encouraged by our findings of a functional role of these novel factors in EMT, we next induced MET by TGF-β withdrawal in mammary mesenchymal cells that have originally undergone EMT in response to TGF-β (Supplementary Fig S8E). Interestingly, such induction of MET led to a loss of JNK signaling (Supplementary Fig S8F) and transcriptional repression of all novel transcription factors (Supplementary Fig S8G). These findings establish JNK signaling in regulation of previously known important regulators of EMT and, at the same time, discover a new set of JNK-induced transcription factors that function as critical regulators of mesenchymal progression.
Depletion of JNK-induced novel transcription factors during TGF-β-induced EMT confers proliferative properties
One of the hallmarks of the epithelial state is their high proliferative capacity. We therefore attempted to ask whether the novel factors induced by JNK during EMT promote mesenchymal fate by reducing the rate of cell division. To address this in detail, we performed time-lapse video microscopy and single-cell tracking of epithelial cells during TGF-β-induced EMT following depletion of three of the selected factors, Tsc22d1, Prkrir, and Pcbp4. Analysis of several experiments revealed a marked decrease in the number of cell divisions within the time window of tracking during TGF-β-mediated EMT as compared to the epithelial cells (Fig4A and B; Supplementary Fig S9). Interestingly however, depletion of any of these three novel factors during EMT was sufficient to significantly rescue the effect of TGF-β on cell division and led to a noticeable increase in cell proliferation (Fig4A and B, Supplementary Fig S9). This analysis further showed that the knockdown cells acquire morphology that closely resembles epithelial cells (data not shown). Overall, these experiments tracking cell-fate changes of single cells during EMT further showed how JNK-induced novel transcription factors contribute to various aspects of the mesenchymal fate, including regulation of cell division.
Figure 4.
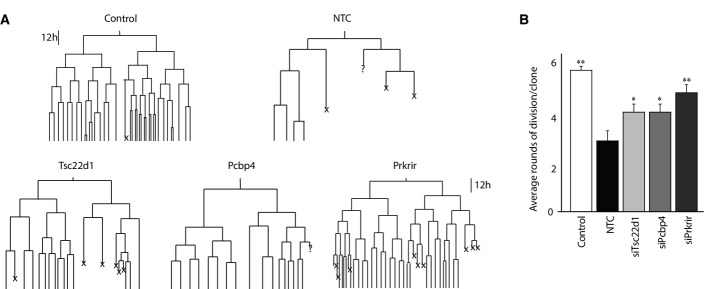
Depletion of Prkrir, Pcbp4, and Tsc22d1 rescues TGF-β-induced reduction in the rate of cell division
- Lineage trees tracked by live imaging for control (untreated NMuMG cells), non-target control (NTC) (NMuMG cells treated with TGF-β and non-target control siRNA) and siRNAs against transcription factors during TGF-β-induced EMT (NMuMG cells treated with TGF-β and siRNAs specific for each transcription factor) (X: cell death/cells could not be tracked till the end).
- Average number of rounds of division per clone in conditions described in (A) (mean ± SEM; ANOVA, Tukey’s post-test, *P < 0.05, **P < 0.01).
PRKRIR, PCBP4, and TSC22D1 are crucial for maintenance of the metastatic state
To extend our observations to the human contexts of metastasis, we next inhibited JNK signaling in an aggressive, human mesenchymal breast cancer cell line (MDA-MB-231). Such treatment led to a massive loss in their wound healing capacity, suggesting that JNK signaling is critical in maintenance of the metastatic state in these cells (Fig5A). Furthermore, this also accompanied upregulation of epithelial markers and downregulation of mesenchymal markers, suggesting differentiation toward an epithelial state (Fig5B). Interestingly, blockage of TGF-β receptor in these cells did not inhibit JNK signaling, but rather led to an increase in phospho-JNK levels that also accompanied a slight increase in their wound healing potential (Supplementary Fig S10A and B). These results further suggest that during tumor progression mesenchymal breast cancer cells may evolve TGF-β-independent mechanisms to sustain high JNK activity that allows maintenance of the mesenchymal fate independent of the signal (viz. TGF-β) that originally induced EMT.
Figure 5.

PRKRIR, PCBP4, and TSC22D1 are crucial for maintenance of the mesenchymal fate
- Scratch assay in MDA-MB-231 cells treated for four days with DMSO or JNKi. Scale bar, 200 μm; 20× magnification.
- mRNA levels for key EMT marker genes in MDA-MB-231 cells treated with DMSO or JNKi for 4 days were measured by qRT–PCR relative to Ctcf and plotted on the y-axis.
- mRNA levels for transcription factors in isogenic epithelial (MDA-MB-361) and mesenchymal (MDA-MB-231) breast cancer cells were measured by qRT–PCR relative to Ctcf and plotted on the y-axis.
- Scratch assay in MDA-MB-231 cells transfected with NTC or siRNA against PRKRIR, NFIL3, PCBP4, and TSC22D1 for 4 days as in (A).
- Invasion assay in MDA-MB-231 cells treated as in (D).
- mRNA levels of key EMT marker genes in MDA-MB-231 and MDA-MB-231 transfected with either empty vector or vector overexpressing PCBP4 or TSC22D1 for 48 h and then treated with the JNK inhibitor (SP600125) for 24 h were measured by qRT–PCR relative to Ctcf and plotted on the y-axis.
Data information: Plotted are means ± SEM of three biological replicates. *P < 0.05, **P < 0.01, ***P < 0.001, Student’s t-test.
Driven by these observations, we were next interested in investigating whether JNK-induced novel transcription factors also have a role in maintenance of the mesenchymal state, in addition to their observed role in its progression. Interestingly, all newly identified transcription factors show much higher expression levels in the aggressive, mesenchymal breast cancer cell line (MDA-MB-231) compared to the isogenic noninvasive epithelial cell line (MDA-MB-361) (Fig5C; Supplementary Fig S10C) (except NR1h4, which is not expressed in these cells). Prompted by these findings, we next assessed whether these factors are involved in maintaining the mesenchymal properties and thus the metastatic potential. Three of these factors (HOXB9, TCF12, and ETV6) have been partly implicated in promoting metastasis, and we therefore chose the remaining four novel transcription factors (PRKRIR, NFIL3, PCBP4, and TSC22D1) for further functional analysis. siRNA-mediated knockdown of these factors in the MDA-MB-231 cells showed a noticeable reduction in their wound-healing potential (Fig5D; Supplementary Fig S10D–F). Importantly further, such depletion of these factors also led to a significant reduction in the invasive capacity of these cells, a property that reflects a critical loss in their metastatic potential (Fig5E). These effects following knockdown of JNK-induced factors were not linked to alternations in cell viability or cell cycle progression (Supplementary Fig S10G–J).
We next asked whether the restoration of these transcription factors is able to counteract the effects of JNK inhibition in these cells. While control breast cancer cells treated with the JNK inhibitor showed gain of epithelial markers and loss of mesenchymal markers, overexpression of TSC22D1 and PCBP4 was able to significantly rescue cells from these JNK inhibitor-induced changes (Fig5F). These observations suggest that these factors indeed function downstream of JNK activity in breast cancer cells in maintenance of the mesenchymal state. Overall, these findings establish that the identified novel transcription factors are important not only for progression but also in maintenance of the mesenchymal state.
PRKRIR, PCBP4, and TSC22D1 regulate distinct sets of genes in breast cancer cells
To further uncover genes under regulation of these transcription factors, we performed genomewide transcriptome profiling (RNA-Seq) following their siRNA-mediated depletion in these cells. Strikingly, computational analysis revealed a large number of genes that were significantly misregulated following knockdown of PRKRIR, PCBP4, and TSC22D1 (Fig6A). To our surprise, with a stringent cutoff for significance, NFIL3 knockdown did not show any aberrantly expressed genes. Interestingly further, several genes that were downregulated following knockdown of these three novel factors have previously been shown to promote metastasis (Fig6B; Supplementary Table S2). Similarly, a number of genes that were upregulated following depletion of these factors are known to be of anti-tumorigenic nature (Fig6B; Supplementary Table S2). We further quantified expression of a number of these misregulated genes in independent knockdown experiments and the results fully validated the changes observed in the RNA-Seq assay (Fig6C). Furthermore, a comparison between the differentially expressed genes in cells depleted of these three factors did not show extensive overlap, suggesting that these proteins function to regulate distinct sets of genes to maintain mesenchymal properties (Fig6D and E).
Figure 6.

PRKRIR, PCBP4, and TSC22D1 regulate expression of distinct sets of genes in mesenchymal breast cancer cells
- A Volcano plots showing significantly changing genes upon siRNA-mediated depletion of PRKRIR, PCBP4, and TSC22D1 as compared to NTC. The x-axis and y-axis show fold expression changes (log2 scale) and associated P-value (−log10 scale), respectively. The blue horizontal line marks the cutoff for genes considered significantly changing upon factor depletion. Red dots indicate genes previously implicated in a similar context (Supplementary Table S2).
- B Circle plots of genes highlighted in (A) (red) and all significantly changing genes (gray).
- C mRNA levels for representative genes highlighted in (A) for cells treated as in Fig5D were measured by qRT–PCR relative to Ctcf and plotted on the y-axis.
- D, E Venn diagrams showing the overlap of the genes differentially downregulated (D) and upregulated (E) following knockdown of the three factors mentioned in (A).
- F Representative immunofluorescence images showing localization of Tsc22d1 in NMuMG cells following transient expression of Flag-HA-tagged Tsc22d1 and detection using an anti-Flag antibody. Bar plot shows quantification of Tsc22d1 localization with respect to DAPI density within the nucleus. y-axis shows the percentage of total fluorescence intensity for Tsc22d1 in DAPI dense and light regions.
- G ChIP assay using anti-Flag antibody following expression of Flag-HA-tagged TSC22D1 in MDA-MB-231 cells. Quantitative PCRs were performed for indicated gene promoters, and enrichments are plotted on the y-axis as ratio of precipitated DNA (bound) to total input DNA and then further divided by the same obtained in the empty vector-transfected cells.
- H mRNA levels for PRKRIR, PCBP4, TSC22D1 in noninvasive (DCIS) (n = 20) and invasive tumor (n = 20) samples were measured by qRT–PCRs relative to TBP and plotted on the y-axis. ZEB1 was used as an established positive control for invasive tumors.
Data information: Plotted are means ± SEM of three biological replicates. *P < 0.05, **P < 0.01, ***P < 0.001, Student’s t-test.
We next attempted to explore whether these transcription factors are directly targeting the regulatory elements of misregulated genes. To test this, we chose and characterized TSC22D1 for its distribution and DNA binding activity. Following transient expression, TSC22D1 showed an exclusive nuclear localization (Fig6F). Interestingly, a deeper analysis revealed that TSC22D1 preferentially localizes with the DAPI-less regions in the nucleus that are known to mark euchromatin and transcriptionally active sites in the genome (Fig6F). Given these patterns, we performed chromatin immunoprecipitation (ChIP) assay for TSC22D1 in MDA-MB-231 cells and analysis showed that it directly binds at the promoter of its target genes (Fig6G). These TSC22D1-bound genes were discovered to be downregulated following TSC22D1 depletion in MDA-MB-231 cells (Fig6C). These observations imply that TSC22D1 is targeted to active chromatin sites in the genome where it functions in transcriptional activation of critical EMT genes.
In order to extend these findings to clinic, we collected many noninvasive (n = 20) and invasive tumor samples (n = 20) and analyzed expression of the three novel transcription factors TSC22D1, PRKRIR, and PCBP4 as well as ZEB1, which is an established marker of highly invasive tumors. Interestingly, all three factors were significantly higher expressed in invasive tumors as compared to noninvasive tumors (Fig6H) that we have also shown to exhibit high phospho-JNK levels (Fig1F and G). These observations clearly establish the clinical relevance of our findings and support our hypothesis that these factors are critical for the metastatic progression of breast cancer cells. Altogether, these findings imply that the JNK-induced novel transcription factors function in the transcriptional regulation of metastasis-relevant genes in invasive breast cancer cells.
Newly identified transcription factors are similarly upregulated during neurogenesis and are required for neuronal EMT
We next attempted to investigate whether the newly identified factors are also components of the core machinery involved in other contexts of EMT such as during development. The differentiation of embryonic stem cells was described to exhibit features of EMT in various studies (Eastham et al, 2007; Ullmann et al, 2007; Li et al, 2010). Therefore, we employed mouse embryonic stem cells (ESCs) that differentiate under well-defined conditions into Pax6-positive neural progenitors (NP), that go on to differentiate into post-mitotic glutamatergic neurons (TN) (Bibel et al, 2004, 2007; Plachta et al, 2004). We find that the transition from embryonic stem cells to differentiated neurons indeed involves gene expression changes that are hallmarks of EMT such as classical cadherin switch (Fig7A). Furthermore, this process is also accompanied by an activation of JNK signaling at later stages (Fig7B) (Tiwari et al, 2012b). Interestingly further, concomitant with the induction of JNK activity, these newly identified transcription factors are significantly increased in their expression during neuronal differentiation (Fig7C). Having observed a correlation with JNK activity and induction of these novel transcription factors during neurogenesis, we investigated a previously published dataset comparing the transcriptome of neurons following a short-term exposure to the JNK inhibitor SP600125 (Tiwari et al, 2012b). Interestingly, the expression of all three transcription factors was significantly reduced following such inhibition of JNK signaling in neurons (Fig7D).
Figure 7.

Newly identified transcription factors are similarly upregulated during neurogenesis and function in neuronal migration
- qRT–PCR analysis for key EMT markers in embryonic stem cells (ESCs), neuronal progenitors (NP), and terminally differentiated neurons (TN). mRNA levels were measured by qRT–PCR relative to Ctcf and plotted on the y-axis.
- Western blot analyzing total JNK and phospho-JNK (p-JNK) during neuronal differentiation of stem cells. β-actin serves as a loading control.
- RNA levels of Pcbp4, Prkrir, and Tsc22d1 during neuronal differentiation were measured by qRT–PCR relative to Ctcf and plotted on the y-axis.
- RNA levels of Pcbp4, Prkrir, and Tsc22d1, represented by average counts derived from previously published microarray data of independent biological replicates from neurons treated with DMSO or JNK inhibitor SP600125 (JNKi) for 6 h.
- RNA levels of Tsc22d1 and three Tsc22d1 target genes during various stages of neuronal differentiation shown in (A) measured by qRT–PCR relative to Ctcf and plotted on the y-axis.
- RNA levels of Tsc22d1 and the same three target genes is shown as average normalized tag counts derived from RNA-Seq data from ventricular zone (VZ), sub-ventricular zone (SVZ) and cortical plate (CP) of E14.5 mouse cortex.
- RNA levels of genes shown in (E) represented by average normalized tag counts derived from RNA-Seq data of TGF-β-induced EMT in NMuMG cells and plotted on the y-axis.
- Graphical representation of in utero electroporation (IUE) performed at the embryonic stage 12.5 (E12.5) during murine development. E12.5 mouse embryos were electroporated with GFP-tagged constructs either with an established non-target control (NTC) shRNA or with a validated shRNA against Tsc22d1. Four days later (E16.5), embryos were sacrificed and brains were fixed for immunofluorescence analysis.
- Representative images from immunofluorescence analysis performed with anti-GFP and anti-Tbr1 antibody that shows retention of GFP-positive cells below the Tbr1 layer in Tsc22d1 knockdown brain as compared to the control brain. The bar plot on the right side shows quantification of migrated GFP-positive cells in control and Tsc22d1-depleted mouse brain with respect to the Tbr1 staining. y-axis represents percentage of cells above or below the Tbr1 stain region.
Data information: Error bars represent SEM from three independent biological replicates. *P < 0.05, **P < 0.01, ***P < 0.001, Student’s t-test.
To investigate whether the target genes of these transcription factors show any specific patterns during neuronal EMT, we chose Tsc22d1 for further validation. We selected a set of genes that were downregulated in TSC22D1-depleted MDA-MB-231 cells with the additional criteria that they have a known role in EMT and neurogenesis (Supplementary Fig S11A). Interestingly, these genes also showed a significant increase in their expression during neuronal differentiation of embryonic stem cells (Fig7E). We next attempted to further validate these observations in vivo by analyzing their expression in various cortical layers during mouse embryonic development. In support of our observations, Tsc22d1 as well as these target genes were similarly induced during neuronal development in vivo where radial glial cells (neuronal progenitors) generate neurons that then migrate to the cortical layer using EMT-like mechanisms (Fig7F). These genes were also found to be significantly induced during EMT in mouse mammary epithelial cells (Fig7G).
To functionally test the requirement of Tsc22d1 in neuronal migration, we attempted to knockdown Tsc22d1 in vivo during mouse brain development. Toward this, we performed in utero electroporation assay in mouse cortex at E12.5 with plasmids containing either an established non-target (control) shRNA or a validated shRNA against Tsc22d1 as described previously (Saito, 2006) and sacrificed the animals at E16.5 for sectioning and analysis (Fig7H). Interestingly, such knockdown of Tsc22d1 led to a very strong reduction in the number of electroporated cells (GFP-positive) in the upper neuronal layer and a noticeable retention in the lower layer, reflecting a defect in neuronal migration toward the cortical plate (CP) (Fig7I; Supplementary Fig S11B). These observations establish that Tsc22d1 is indeed critical for neuronal EMT during mouse brain development. These findings further highlight that the EMT machinery involved in both development and disease may involve a common set of transcription factors that function via regulating a similar set of EMT genes and places JNK-induced transcription factors among these core EMT regulatory factors.
Discussion
Epithelial to mesenchymal transition (EMT) plays crucial roles in generating the body plan during embryonic development by contributing to the morphogenesis of multiple tissues and organs (Acloque et al, 2009; Nieto, 2009, 2011). This process is further employed during wound healing and tissue regeneration in adults. However, its aberrant activation is known to cause organ fibrosis and promote carcinoma progression through a variety of mechanisms (Pijnenborg et al, 1980; Perez-Pomares & Munoz-Chapuli, 2002; Thiery & Sleeman, 2006; Zeisberg et al, 2007a,b; Potenta et al, 2008; Acloque et al, 2009; Kalluri & Weinberg, 2009; Thiery et al, 2009; Nieto, 2011; Tiwari et al, 2012a, 2013). EMT confers cells with migratory and invasive properties, induces stem cell properties, prevents apoptosis and senescence, and contributes to immunosuppression (Acloque et al, 2009; Nieto, 2011). Thus, the acquisition of mesenchymal state accompanies gain in the capacity of cells to migrate to distant organs and maintain stemness, allowing their subsequent differentiation into multiple cell types during development and the initiation of metastasis during carcinogenesis. Our high-resolution, high-coverage deep-sequencing transcriptome data for various steps during progression from epithelial to mesenchymal state including later mesenchymal stages would be of vital importance to researchers studying EMT in these various contexts. These datasets will serve as a useful resource to not only study gene expression program during EMT but also pursue functional investigation of novel coding and long non-coding RNAs that we discovered to be transcriptionally modulated during distinct phases of this phenotypic transition.
TGF-β-induced EMT has been shown to involve activation of a number of non-canonical pathways including MAP kinases such as ERK, p38, and JNK. However, the induction kinetics of these pathways as well as their crosstalk to canonical Smad signaling during EMT has not been explored in detail so far. Our observations show that while Smad signaling is required for the onset of EMT, JNK pathway is critical for the progression and maintenance of phenotypic and cellular changes associated with EMT. We further established the clinical relevance of these findings by showing that a large fraction of invasive tumors exhibit high JNK activity and low Smad signaling, whereas no such pattern was observed in noninvasive tumors (Fig1F and G; Supplementary Fig S2B and C, Supplementary Table S1).
A number of previous, small-scale studies have suggested that JNK activation may contribute to the TGF-β-induced gene regulation including expression of fibronectin and of other profibrotic genes (Hocevar et al, 1999; Alcorn et al, 2008, 2009; Chang & Wu, 2010). However, these were single-gene studies that neither uncovered all the genes regulated by JNK signaling nor investigated the differential requirement of JNK signaling during distinct phases of mesenchymal progression. Our genomewide expression profiling in combination with morphological analysis following JNK inhibition at various phases of EMT revealed that JNK signaling has no functional contribution in the onset of this process. Interestingly however, as cells progress through the mesenchymal state, JNK signaling gradually becomes a crucial transcriptional regulator of many genes that includes activation of established mesenchymal genes (e.g., Zeb1, Ncam, Mcam, and Tnc1) and repression of known epithelial genes (e.g., Cdh1, Ccnd1, Ccnf, and Ccng1) and therefore is required to achieve morphological features typical of a progressed mesenchymal state. This study goes beyond previous notions on the involvement of JNK signaling during EMT, detailing kinetically distinct modes of JNK activity during the process and establishing its role in genomewide transcriptome remodeling that drives mesenchymal progression.
It is increasingly being recognized that EMT involves active participation of epigenetic regulatory pathways (McDonald et al, 2011; Shen & Laird, 2013; Tiwari et al, 2013). However, there are no existing observations that link upstream signaling to the regulation of chromatin state in driving this process. We find that a number of genes that were downregulated upon EMT acquired the PcG complex-associated repressive mark H3K27me3 at their promoters in a JNK signaling-dependent fashion. Furthermore, JNK signaling also mediates a compact chromatin state of these gene promoters, facilitating their silencing during EMT. While the precise molecular mechanism underlying JNK signaling-mediated regulation of chromatin states during EMT remains unclear, it is possible that JNK pathway modulates activity of certain epigenetic regulators or other factors involved in targeting of these proteins to distinct genomic sites. It also remains probable that JNK directly modifies chromatin as shown previously in the context of neurogenesis (Tiwari et al, 2012b). Nevertheless, these findings have uncovered a previously unknown function of JNK signaling in modulating the epigenetic state and chromatin packaging at target gene promoters to mediate transcriptional reprogramming underlying EMT. These findings further set a new dimension as to how external signaling could modulate epigenome to drive changes in cell fate.
The transcriptional reprogramming underlying transition from epithelial to mesenchymal fate is known to involve function of a number of critical transcription factors (e.g., ZEB1, ZEB2, TWIST, SNAIL1, SNAIL3, SOX4) (Thiery & Sleeman, 2006; Kalluri & Weinberg, 2009; Tiwari et al, 2012a, 2013). However, these few transcription factors render unable to explain expression changes observed in several hundred genes during EMT and suggest that the entire circuitry of regulatory factors involved in driving this process is yet to be fully explored. Our study discovered eight novel transcription factors that were highly induced during EMT and were critically required for the phenotypic and molecular changes that accompany this process. Importantly further, active JNK signaling was required for the induced expression of these factors during EMT. Moreover, these factors were transcriptionally repressed upon MET that parallels loss of JNK signaling. These observations further suggest how JNK activity might participate in transcriptional reprogramming underlying EMT by regulating expression of critical transcription factors.
We also revealed that the newly identified factors not only function in acquisition of the mesenchymal fate but are also required for its maintenance. These factors were very highly expressed in the aggressive, human mesenchymal breast cancer cells, and depletion of three of these factors (PRKRIR, PCBP4 and TSC22D1) in these cells led to a drastic loss in their wound healing and invasion capacity. In combination with genomewide transcriptional profiling, we find that these phenotypic effects of transcription factors are linked to their function in activation and repression of a large number of established metastasis-promoting and tumor suppressor genes, respectively. Importantly further, these datasets also uncovered a number of novel genes under transcriptional control of these factors but have never been studied in the context of tumor biology and warrant further investigation. It is further important to note that the set of genes regulated by these novel factors are largely non-overlapping, arguing that carcinogenic mechanisms may evolve a network of transcription factors that regulate distinct sets of genes, but ultimately functionally culminate to cooperatively drive metastatic progression at the phenotypic level. We also explored whether these gene regulatory effects can be explained by a DNA binding function of these regulatory factors. Indeed, we find that one such factor, Tsc22d1, not only localizes to the nucleus but is preferentially targeted to the euchromatic regions in the genome. Furthermore, Tsc22d1 directly binds at the upstream regulatory elements of critical EMT genes to induce their transcription. We further enhanced the translational impact of our findings by screening a large number of breast cancer patient samples and showing that the three JNK-induced novel transcription factors, PRKRIR, PCBP4, and TSC22D1, are significantly higher expressed in invasive tumors as compared to noninvasive tumors.
While abnormal EMT is involved in tumor progression and metastasis, this process is vitally involved in key developmental events such as embryonic layer formation during gastrulation and neural crest migration (Pijnenborg et al, 1980; Perez-Pomares & Munoz-Chapuli, 2002; Acloque et al, 2009). Motivated by our discovery of new transcription factors that play a crucial role in EMT in the context of breast carcinogenesis, we also extended our investigation to understand whether they belong to the core EMT machinery that is equally employed in other contexts of EMT, such as during development. We find that neuronal differentiation, which shows expression changes hallmark of a classical EMT, involves activation of JNK pathway. Importantly further, all novel factors were transcriptionally induced during this process and this requires an active JNK signaling. Furthermore, in utero knockdown of one such factor, Tsc22d1, during brain development results in a defective neuronal migration. This is also in line with previous observations that JNK pathway is essential for neurogenesis (Amura et al, 2005; Oliva et al, 2006; Tiwari et al, 2012b). Altogether, these observations strongly suggest that our newly identified transcription factors are components of the EMT core machinery that is utilized in both disease and developmental contexts.
Overall, these comprehensive findings extend beyond existing notions on the function of JNK activity during EMT, providing detailed kinetics of its phase of action during the process and unraveling the entire gene regulatory network downstream of this important signaling cascade through which it functions to determine mesenchymal fate. Moreover, these observations put forth new evidence how signaling pathways such as JNK may directly modulate the epigenetic state of critical genes to mediate transcriptional reprogramming underlying EMT and, at the same time, reveal a new repertoire of JNK-induced transcription factors that are critical in progression as well as maintenance of the mesenchymal fate (Fig8).
Figure 8.
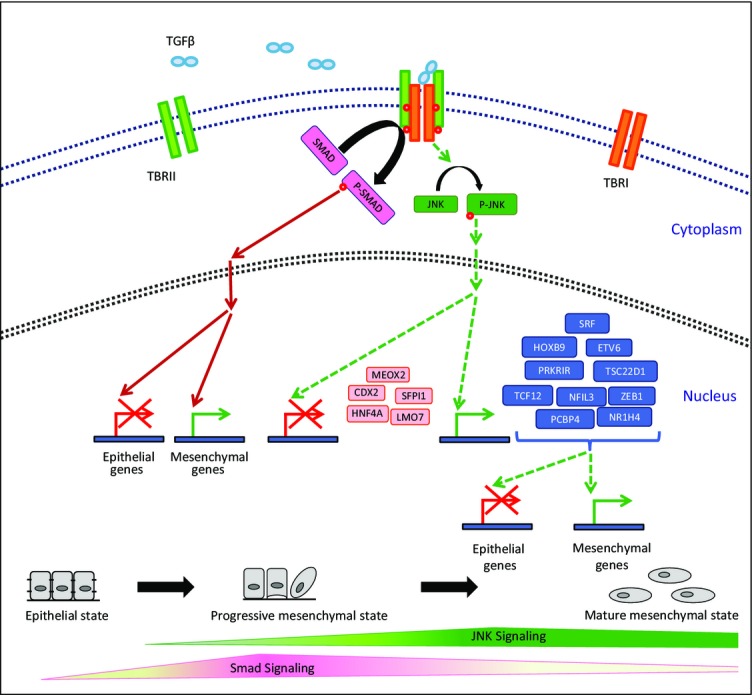
Model showing distinct gene regulatory function of JNK signaling during EMT
Onset of EMT crucially relies on Smad-mediated (Valcourt et al, 2007; Xu et al, 2009) transcriptional changes, and as cells advance through the mesenchymal fate, JNK pathway progressively becomes critical in gene regulation. We identified a set of transcription factors (Prkrir, Etv6, Srf, Hoxb9, Tsc22d1, Tcf12, Nr1h4, Zeb1, Pcbp4, Nfil3) that are induced by JNK signaling and function in progression and/or maintenance of the mesenchymal state. Furthermore, JNK activity also represses another set of factors (Meox2, Hnf4a, Sfpi1, Lmo7, Cdx2) that promote an epithelial phenotype. Among these JNK-regulated factors, in addition to the factors known to regulate EMT and carcinogenesis [Etv6 (Tognon et al, 2011), Srf (Bae et al, 2014), Hoxb9 (Hayashida et al, 2010), Tcf12 (Lee et al, 2012), Zeb1 (Burk et al, 2008; Sanchez-Tillo et al, 2013), Meox2 (Valcourt et al, 2007), Hnf4a (Santangelo et al, 2011), Sfpi1 (Walter et al, 2005; Rosenbauer et al, 2006), Lmo7 (Tanaka-Okamoto et al, 2009) and Cdx2 (Gross et al, 2008)], we also identified five novel transcription factors that are crucial for progression and/or maintenance of EMT (Nfil3, Nr1h4, Tsc22d1, Pcbp4, and Prkrir).
Materials and Methods
Cell culture
A subclone of NMuMG cells (NMuMG/E9, hereafter NMuMG) has been described previously (Maeda et al, 2005) and was grown in DMEM supplemented with 10% FBS, 2 mM L-glutamine, and 1× non-essential amino acids. HMECs were obtained from Lonza and cultured according to the manufacturer’s guidelines. Other cell lines were obtained from ATCC and cultured supplying the following media: N2a: DMEM, 10% FBS, 2.0 mM L-glutamine, 1.0 mM sodium pyruvate; MDA-MB-231: DMEM, 10% FBS; MDA-MB-361: DMEM, 20% FBS; BT549: RPMI-1640, 10% FBS, 0.001 mg/ml bovine insulin; MCF7: DMEM, 10% FBS, 0.01 mg/ml bovine insulin. All cells were cultured at 37°C with 7% CO2 in a humid incubator. For TGF-β time course experiments, NMuMG cells and HMEC were treated with 2 ng/ml TGF-β (rhTGF-β1 240-B, R&D systems) for indicated time points with TGF-β replenishment and medium change every 2 days. Neuronal differentiation in N2a cells was induced by adding 20 μM retinoic acid (Sigma, St. Louis, MO) in DMEM supplemented with 2% FBS.
siRNA-mediated knockdown
For all siRNA-mediated knockdown experiments, cells were seeded at the same starting density and transfected with ON-TARGET plus SMARTpool siRNAs (i.e., a mixture of four siRNAs provided as a single reagent) (Dharmacon) or single siRNA (Dharmacon) wherever indicated every second day. For siRNA transfections, Lipofectamine RNAiMax (Invitrogen, 13778-150) was used according to the manufacturer’s instructions. For experiments during TGF-β-induced EMT, a 4-day predepletion was performed in epithelial cells before TGF-β induction to ensure efficient knockdown prior to starting EMT. Sequences of siRNAs are provided in Supplementary Table S3.
ChIP assay
NMuMG cells were cross-linked in medium containing 1% formaldehyde for 10 min at room temperature, neutralized with 0.125 M glycine, scraped off, and rinsed twice with 10 ml 1× PBS. Pellets were resuspended in 3 ml of buffer L1 (50 mM Hepes KOH, pH 7.5, 140 mM NaCl, 1 mM EDTA pH 8.0, 10% glycerol, 5% NP-40, 0.25% Triton X-100) and incubated for 10 min at 4°C. This was followed by centrifugation for 5 min at 4°C at 1,300 g. The pellet was then resuspended in 3 ml of buffer L2 (200 mM NaCl, 1 mM EDTA pH 8.0, 0.5 mM EGTA pH 8.0, 10 mM Tris pH 8.0) and incubated for 10 min at room temperature, followed by centrifugation for 5 min at 4°C at 1,300 g. The pellet was then resuspended in 600 μl buffer L3 (1 mM EDTA pH 8.0, 0.5 mM EGTA pH 8.0, 10 mM Tris pH 8.0, 100 mM NaCl, 0.1% Na-deoxycholate, 0.17 mM N-lauroyl sarcosine) containing protease inhibitors and incubated at 4°C for 3 h following sonication using Bioruptor plus (Diagenode). Sixty micrograms of chromatin was incubated overnight at 4°C with 2 μg of the antibody targeting H3K27me3 (ab6002; Abcam). The mixture was then incubated for 3 h with 40 μl protein A-Sepharose beads preblocked with tRNA and BSA at 4°C. Beads were washed twice with 1 ml buffer L3 and once with 1 ml DOC buffer (10 mM Tris pH 8.0, 0.25 M LiCl, 0.5% NP-40, 0.5% deoxycholate, 1 mM EDTA), and bound chromatin was eluted in 1% SDS/0.1 M NaHCO3. This followed treatment with RNase A (0.2 mg/ml) for 30 min at 37°C and then with proteinase K (50 μg/ml) for 2.5 h at 55°C. The cross-linking was reversed at 65°C overnight with gentle shaking. DNA was purified by phenol–chloroform extraction followed by ethanol precipitation and recovered in 40 μl TE buffer. Real-time PCR on this ChIP material was performed using SYBR Green (ABI) and ChIP (1:40) or input (1:100) DNA per PCR.
FAIRE assay
For FAIRE assay, NMuMG cells were fixed, lysed, and sonicated as described for ChIP. After clearing cellular debris by spinning at 14,000 g for 10 min at 4°C, DNA was isolated by adding an equal volume of phenol:chloroform:isoamylalcohol (25:24:1), vortexing, and spinning at 12,000 g for 5 min at room temperature. The aqueous phase was isolated, and a second round of phenol:chloroform:isoamylalcohol purification was performed. Following collection of aqueous phase, chloroform:isoamylalcohol (24:1) was added, vortexed and spun at 12,000 g for 5 min at room temperature. The aqueous phase was then collected, and DNA was ethanol precipitated and recovered in 40 μl TE buffer. This recovered material was then treated with RNase for 30 min (0.2 mg/ml) and recleaned with phenol followed by chloroform:isoamylalcohol (24:1) and subsequently ethanol precipitated. Next, DNA was recovered in 40 μl TE buffer. For deriving input DNA control, RNase and proteinase K digestion, reverse cross-linking and purification of 10% input material, and real-time PCR analysis were performed as described for ChIP samples.
Quantitative RT–PCR
mRNA levels were quantified as described previously (Tiwari et al, 2012a). In brief, total RNA was prepared using TRIzol (Invitrogen) or SurePrep TrueTotal RNA Purification Kit (Fisher Scientific), reverse-transcribed with First-Strand cDNA Synthesis Kit (Fermentas), and transcripts were quantified by PCR using SYBR Green PCR Master Mix (ABI) on ViiA7 PCR machine (Life Technologies). Human or mouse Ctcf and Rpl19 primers were used for normalization. Sequences of all primers used in this study are provided as Supplementary Table S4.
Reagents and antibodies
Reagents used in the present study were TGF-β (rhTGF-β1 240-B, R&D systems), DMEM (21969-035, Invitrogen), RPMI-1640 (R0883, Sigma), PBS (D8537, Sigma), trypsin (25300-054, Invitrogen), Opti-MEM (31985-047, Invitrogen), FBS (10270, Invitrogen), glutamine (25030-024, Invitrogen), MEM NEAA (100×) (11140-035, Invitrogen), Lipofectamine 2000 (11668, Invitrogen), Lipofectamine RNAiMax (13778-150, Invitrogen), TRIzol (15596026, Invitrogen), reverse transcriptase kit (K1612, Thermo Fischer), SYBR Green PCR Master Mix (4334973, Invitrogen), Bradford reagent (5000205, Bio-Rad), protease inhibitor cocktail (04693132001, Roche), and phosphatase inhibitor cocktail (04906837001, Roche).
Antibodies used for Western blot were phospho-JNK (4688, Cell Signaling), JNK (sc474, Santa Cruz), pSmad2 (3108, Cell signaling), Smad2 (5339, Cell Signaling), Lamin B (sc2616, Santa Cruz), c-Jun antibody (c-Jun Antibody (H-79) Santa Cruz), and phospho-c-Jun (Ser63) II (Cell Signaling),
Antibodies used for immunofluorescence were E-cadherin (13-1900, Invitrogen and 610182, BD Transduction Laboratories), N-cadherin (610921, BD Transduction Laboratories), ZO-1 (617300, Invitrogen), fibronectin (F-3648, Sigma-Aldrich), paxillin (610052, BD, Transduction Laboratories), p-c-Jun (9261, Cell Signaling), Atf2 (CREB-2 (C-200) Santa Cruz), green fluorescent protein (2BScientific, GFP-1020), TBR1 (Abcam, ab31940), SATB2 (Abcam, ab34735), Alexa Fluor-488 goat anti mouse IgG (H+L) (A11029, Invitrogen), Alexa Fluor-568 goat anti rabbit IgG (H+L) (A11011 Invitrogen), and Alexa Fluor-633 goat anti rat IgG (H+L) (A21094, Invitrogen). Alexa Fluor 633 phalloidin (A22284, Invitrogen) was used to stain F-actin.
Antibodies used for immunohistochemistry were p-Smad2 (3108, Cell Signaling) and p-JNK (4668, Cell Signaling).
For chemical inhibition experiments, we used JNK inhibitors (SP600125, S5567, Sigma; JNK-IN-8, 420150, Merck Millipore), actinomycin D (A1410, Sigma) and cycloheximide (C7698, Sigma), Akt inhibitor (B2311 Sigma), PI3 kinase inhibitor wortmannin (W3144 Sigma), TGF-β receptor blocker (SB-431542).
Inhibitor studies
Cells were seeded at same densities and pretreated 30 min prior to TGF-β treatment with signaling pathway inhibitors or their solvent DMSO at the final concentrations of 10 μM SP600125 or 2 μM IN-8 and analyzed at indicated time points. Same treatment scheme was employed for inhibitors of transcription (actinomycin D, 0.2 μg/ml) and translation (cycloheximide; 5 μg/ml). To access the effect of later inhibition of JNK during TGF-β-induced EMT, NMuMG cells were treated starting at day 1 or day 3 after TGF-β stimulation; medium, inhibitor, and TGF-β were freshly added every second day. To test the effect of blocking AKT and PI3 signaling on JNK signaling, NMuMG cells were pretreated with the Akt inhibitor (Akt Inhibitor IV) and PI3 kinase inhibitor (wortmannin) for 30 min and then induced with TGF-β. This was followed by harvesting the cells 24 h later for Western blot analysis of p-JNK levels.
Immunofluorescence assay
Cells were grown on coverslips, fixed with 4% paraformaldehyde in PBS, and permeabilized with 0.2% Triton X-100 for 15 min at room temperature. Subsequently, cells were blocked with 10% goat serum, 5% FCS, and 0.5% BSA in PBS for 20 min and incubated with primary antibodies at 4°C overnight then incubated with fluorochrome-labeled secondary antibody or phalloidin-633 for 1 h at room temperature. The coverslips were counterstained with Hoechst mounted with ImmoMount and imaged with a confocal laser-scanning microscope. Data were processed with ImageJ software.
Immunoblotting
Cells were lysed in RIPA buffer, and protein concentrations were quantified by using Bradford reagent. Equal amounts of proteins (30 μg) were boiled in 6× SDS–PAGE loading buffer run on a polyacrylamide gel and transferred to a PVDF membrane and probed with respective antibodies.
Wounding migration assay
Cells were seeded at equal densities and following treatment with either DMSO or JNK inhibitor, and a scratch wound was generated using a 10-μl pipette tip on confluent cell monolayers growing in six-well culture plates. Cells were then washed with fresh medium to remove floating cells. Bright-field images were taken at 20× magnification after 24 h of wounding.
Migration and invasion assays
Migration assays were performed as previously described (Tiwari et al, 2013). In brief, 104 cells were seeded in 2% FBS/DMEM (Sigma) in the upper chamber of a 24-well transwell migration insert (pore size: 8 μm; Falcon BD). The lower chamber was filled with 20% FBS/DMEM. After 16 h of incubation at 37°C, cells in the upper chamber were removed with a cotton swap, and the cells that had traversed the membrane were fixed in 4% paraformaldehyde/PBS and quantified by DAPI staining using a fluorescence microscope and ImageJ software. For invasion assays, transwells were coated with 0.5 mg/ml Matrigel in serum-free media overnight. 1.5 × 10⁵ cells were used for the assays.
Immunohistochemistry
Immunohistochemical analysis of 30 invasive and 13 noninvasive breast cancer samples was performed on 4-μm-thick sections according to standard procedures. Antigen retrieval reactions were performed in a steamer using citrate buffer, pH 6.0, for 40 min. All slides were incubated with the peroxidase block reagent supplied by Dako (Carpinteria, California, USA). Sections were then stained with respective antibodies in a 1:25 dilution at 4°C overnight. Slides were then incubated with a polymeric biotin-free visualization system (EnVision™; Dako, Carpinteria, California, USA) for 30 min at room temperature, followed by 5-min incubation with the chromogen diaminobenzidine (DAB) and finally lightly counterstained with hematoxylin. All series included appropriate positive and negative controls that gave adequate results. All slides were mounted and then were evaluated under a Leica light microscope (Leica Microsystem, Wetzler, Germany) by one of the authors trained in histological and immunohistochemical diagnostics (M.S.). Both phospho-SAPK/JNK and phospho-Smad2 showed nuclear staining which was divided into four groups each: 0 (no staining), 1 (weak staining), 2 (moderate staining), and 3 (strong staining). Tumor size, histological grade, estrogen receptor (ER), progesterone receptor (PR), and human epidermal growth factor receptor 2 (HER2) were collected from our breast cancer database as previously described (Schmidt et al, 2012). The study was approved by the ethical review board of the medical association of Rhineland-Palatinate, Germany. Informed consent has been obtained, and all clinical investigation has been conducted according to the principles expressed in the Declaration of Helsinki.
RNA-Seq
RNA samples from the TGF-β-induced EMT time course in NMuMG cells were depleted from rRNA prior to library preparation using the Ribo-Zero kit (Epicentre) following the manufacturer’s instructions. RNA-Seq libraries for all samples were generated using TruSeq kit from Illumina. In all cases, 50-bp reads and single-end sequencing were derived using Illumina HiSeq2000 platform. Reads were aligned to mouse genome (mm9) using TopHat (Trapnell et al, 2009) (version 2.0.9) with default parameters using RefSeq transcript file for coding genes from UCSC. In case of lincRNA expression analysis, reads were aligned to lincRNA coordinates collated from different databases. The aligned reads were then provided as an input to HTSeq_count utility from HTSeq package. The raw read count files obtained from HTSeq-count were then processed for differential expression using DESeq package, and normalized read count with a FDR rate of 0.1 for coding and non-coding RNA was generated after library size normalization (Anders & Huber, 2010).
Cell cycle analysis
MDA-MB-231 cells were pulse-treated with 10 μM BrdU for 30 min. Then, cells were trypsinized and fixed for 15 min at room temperature using Cytofix/Cytoperm buffer (BD Biosciences). After two washes with Perm/Wash buffer (BD Biosciences), the cells were permeabilized with Cytoperm permeabilization buffer (BD Biosciences) for 10 min at 4°C, washed with Perm/Wash buffer (BD Biosciences), and subjected to DNase (300 μg/ml in PBS) digest for 1 h at 37°C. The staining with APC-BrdU antibody was performed using BrdU Flow Kit (BD Biosciences) for 20 min at room temperature. DNA was counterstained with 7-AAD along with 30-min RNase (0.1 mg/ml final concentration) digest. Samples were subsequently measured using the BD LSRFortessa Cell Analyzer with BD FACSDiva software, and plots were generated using FlowJo.
Time-lapse video microscopy
Time-lapse video microscopy and single-cell tracking of NMuMG cells depleted with control siRNA or with siRNA against transcription factors were performed with a cell observer (Zeiss) at a constant temperature of 37°C and 7% CO2. Phase-contrast images were acquired every 5 min for 4 days using a 20× phase-contrast objective (Zeiss), an AxioCamHRm camera, and a Zeiss AxioVision 4.7 software. Single-cell tracking was performed using a self-written computer program (TTT) (Ortega et al, 2013).
In utero electroporation
Experiments were carried out essentially as described (Saito, 2006). All experimental procedures were conducted in accordance with European, national, and institutional guidelines for animal care. Timed-pregnant (Theiler stages 20 = E12.5) C57BL/6 mice were anaesthetized with isoflurane (2.5% via mask, Forene®, Abbod) and analgesized subcutaneously with carprofen (4 mg/kg body weight, Rimadyl, Pfizer). After opening the abdominal cavity, the embryos were carefully exposed and 1 μl colored solution containing 1 μg of the p.SUPER-GFP shRNA plasmid expressing shRNAs against Tsc22d1 or control shRNA injected into one of the lateral ventricles. With specialized platinum electrodes (Nepagene CUY 650P), the appropriate voltage was applied (50 ms, interval 950 ms, 5 pulses). Then, the uterine horns were replaced after electroporation in the abdominal cavity.
Immunofluorescence assay to assess neuronal migration in mouse brain
Isolated E16.5 embryonic brains were fixed immediately for 24 h in 4% PFA in PBS at 4°C. Brains were then cryoprotected in 10% sucrose for 2 h then in 30% sucrose (in PBS) overnight, embedded in Tissue-Tek, stored at −20°C, and cryosectioned 12 μm. Sections on coverslips were preblocked with 2% BSA, 0.5% Triton (in PBS) for 1 h. Primary antibodies (Satb2, 1:500, Abcam (ab34735), Tbr1, 1:500, Abcam (ab31940) and anti-GFP (chicken, Aves Labs, 1:1,000) were applied in blocking solution overnight at 4°C. Fluorescent 11 secondary antibodies were applied according to the manufacturer’s protocol (Life Technologies). The coverslips were counterstained with Hoechst mounted with ImmoMount and imaged with a confocal laser-scanning microscope Leica (SP5). Data were processed with ImageJ software.
Annexin V FACS
MDA-MB-231 cells were trypsinized and washed twice with cold PBS. One million cells were resuspended in 100 μl of annexin binding buffer (0.01 M HEPES, pH 7.4; 0.14 M NaCl; 2.5 mM CaCl2) and stained adding 5 μl Annexin V-APC (550474 BD Biosciences) for 15 min at room temperature in the dark. After two washes with annexin binding buffer, samples were measured using the BD LSRFortessa Cell Analyzer with BD FACSDiva software.
Accession numbers
All the next-generation sequencing datasets used in this study have already been submitted to GEO and will be publically available under Accession Number GSE54133.
Acknowledgments
We would like to thank members of the Tiwari laboratory for cooperation and critical feedback during the progress of the project. Support by the Core Facilities of the Institute of Molecular Biology (IMB), Mainz, is gratefully acknowledged, especially the microscopy, cytometry, genomics, and bioinformatics core facilities. We thank Gerhard Christofori (University of Basel, Basel, Switzerland) for providing NMuMG cells. We also thank Jan Baumgart (Johannes Gutenberg University, Mainz) for helping with the animal experiment license. This project was supported primarily by the Wilhelm Sander Stiftung grants 2012.009.1 and 2012.009.2 and in part by EpiGeneSys RISE1 program, Marie Curie CIG 322210 and Deutsche Forschungsgemeinschaft (DFG) TI 799/1-1 grants to V.K.T.
Author contributions
SKS designed the study, performed experiments, analyzed data, and wrote the manuscript. AG designed the study, performed experiments, and analyzed data. NT designed and performed experiments and analyzed data. SG and NS performed experiments. ST, JT, and MS analyzed data. FO performed analysis. BB and RN provided tools. VKT designed the study, analyzed data, and wrote the manuscript. All authors read and approved the final manuscript.
Conflict of interest
The authors declare that they have no conflict of interest.
Supporting Information
Supplementary Information
Review Process File
References
- Acloque H, Adams MS, Fishwick K, Bronner-Fraser M, Nieto MA. Epithelial-mesenchymal transitions: the importance of changing cell state in development and disease. J Clin Investig. 2009;119:1438–1449. doi: 10.1172/JCI38019. [DOI] [PMC free article] [PubMed] [Google Scholar]
- Alcorn JF, Guala AS, van der Velden J, McElhinney B, Irvin CG, Davis RJ, Janssen-Heininger YM. Jun N-terminal kinase 1 regulates epithelial-to-mesenchymal transition induced by TGF-beta1. J Cell Sci. 2008;121:1036–1045. doi: 10.1242/jcs.019455. [DOI] [PMC free article] [PubMed] [Google Scholar]
- Alcorn JF, van der Velden J, Brown AL, McElhinney B, Irvin CG, Janssen-Heininger YM. c-Jun N-terminal kinase 1 is required for the development of pulmonary fibrosis. Am J Respir Cell Mol Biol. 2009;40:422–432. doi: 10.1165/rcmb.2008-0174OC. [DOI] [PMC free article] [PubMed] [Google Scholar]
- Amura CR, Marek L, Winn RA, Heasley LE. Inhibited neurogenesis in JNK1-deficient embryonic stem cells. Mol Cell Biol. 2005;25:10791–10802. doi: 10.1128/MCB.25.24.10791-10802.2005. [DOI] [PMC free article] [PubMed] [Google Scholar]
- Anders S, Huber W. Differential expression analysis for sequence count data. Genome Biol. 2010;11:R106. doi: 10.1186/gb-2010-11-10-r106. [DOI] [PMC free article] [PubMed] [Google Scholar]
- Bae JS, Noh SJ, Kim KM, Jang KY, Chung MJ, Kim DG, Moon WS. Serum response factor induces epithelial to mesenchymal transition with resistance to sorafenib in hepatocellular carcinoma. Int J Oncol. 2014;44:129–136. doi: 10.3892/ijo.2013.2154. [DOI] [PubMed] [Google Scholar]
- Barrallo-Gimeno A, Nieto MA. The Snail genes as inducers of cell movement and survival: implications in development and cancer. Development. 2005;132:3151–3161. doi: 10.1242/dev.01907. [DOI] [PubMed] [Google Scholar]
- Bibel M, Richter J, Schrenk K, Tucker KL, Staiger V, Korte M, Goetz M, Barde YA. Differentiation of mouse embryonic stem cells into a defined neuronal lineage. Nat Neurosci. 2004;7:1003–1009. doi: 10.1038/nn1301. [DOI] [PubMed] [Google Scholar]
- Bibel M, Richter J, Lacroix E, Barde YA. Generation of a defined and uniform population of CNS progenitors and neurons from mouse embryonic stem cells. Nat Protoc. 2007;2:1034–1043. doi: 10.1038/nprot.2007.147. [DOI] [PubMed] [Google Scholar]
- Burk U, Schubert J, Wellner U, Schmalhofer O, Vincan E, Spaderna S, Brabletz T. A reciprocal repression between ZEB1 and members of the miR-200 family promotes EMT and invasion in cancer cells. EMBO Rep. 2008;9:582–589. doi: 10.1038/embor.2008.74. [DOI] [PMC free article] [PubMed] [Google Scholar]
- Chang Y, Wu XY. JNK1/2 siRNA inhibits transforming-growth factor-beta1-induced connective tissue growth factor expression and fibrotic function in THSFs. Mol Cell Biochem. 2010;335:83–89. doi: 10.1007/s11010-009-0245-8. [DOI] [PubMed] [Google Scholar]
- Chaudhury A, Howe PH. The tale of transforming growth factor-beta (TGFbeta) signaling: a soigne enigma. IUBMB Life. 2009;61:929–939. doi: 10.1002/iub.239. [DOI] [PMC free article] [PubMed] [Google Scholar]
- Choi HN, Kim KR, Lee JH, Park HS, Jang KY, Chung MJ, Hwang SE, Yu HC, Moon WS. Serum response factor enhances liver metastasis of colorectal carcinoma via alteration of the E-cadherin/beta-catenin complex. Oncol Rep. 2009;21:57–63. [PubMed] [Google Scholar]
- Eastham AM, Spencer H, Soncin F, Ritson S, Merry CL, Stern PL, Ward CM. Epithelial-mesenchymal transition events during human embryonic stem cell differentiation. Cancer Res. 2007;67:11254–11262. doi: 10.1158/0008-5472.CAN-07-2253. [DOI] [PubMed] [Google Scholar]
- Feng XH, Derynck R. Specificity and versatility in tgf-beta signaling through Smads. Annu Rev Cell Dev Biol. 2005;21:659–693. doi: 10.1146/annurev.cellbio.21.022404.142018. [DOI] [PubMed] [Google Scholar]
- Gross I, Duluc I, Benameur T, Calon A, Martin E, Brabletz T, Kedinger M, Domon-Dell C, Freund JN. The intestine-specific homeobox gene Cdx2 decreases mobility and antagonizes dissemination of colon cancer cells. Oncogene. 2008;27:107–115. doi: 10.1038/sj.onc.1210601. [DOI] [PubMed] [Google Scholar]
- Gui T, Sun Y, Shimokado A, Muragaki Y. The roles of mitogen-activated protein kinase pathways in TGF-beta-induced epithelial-mesenchymal transition. J Signal Transduct. 2012;2012:289243. doi: 10.1155/2012/289243. [DOI] [PMC free article] [PubMed] [Google Scholar]
- Hay ED. The mesenchymal cell, its role in the embryo, and the remarkable signaling mechanisms that create it. Dev Dyn. 2005;233:706–720. doi: 10.1002/dvdy.20345. [DOI] [PubMed] [Google Scholar]
- Hayashida T, Takahashi F, Chiba N, Brachtel E, Takahashi M, Godin-Heymann N, Gross KW, Vivanco M, Wijendran V, Shioda T, Sgroi D, Donahoe PK, Maheswaran S. HOXB9, a gene overexpressed in breast cancer, promotes tumorigenicity and lung metastasis. Proc Natl Acad Sci USA. 2010;107:1100–1105. doi: 10.1073/pnas.0912710107. [DOI] [PMC free article] [PubMed] [Google Scholar]
- Hocevar BA, Brown TL, Howe PH. TGF-beta induces fibronectin synthesis through a c-Jun N-terminal kinase-dependent, Smad4-independent pathway. EMBO J. 1999;18:1345–1356. doi: 10.1093/emboj/18.5.1345. [DOI] [PMC free article] [PubMed] [Google Scholar]
- Kalluri R, Weinberg RA. The basics of epithelial-mesenchymal transition. J Clin Investig. 2009;119:1420–1428. doi: 10.1172/JCI39104. [DOI] [PMC free article] [PubMed] [Google Scholar]
- Kowanetz M, Valcourt U, Bergstrom R, Heldin CH, Moustakas A. Id2 and Id3 define the potency of cell proliferation and differentiation responses to transforming growth factor beta and bone morphogenetic protein. Mol Cell Biol. 2004;24:4241–4254. doi: 10.1128/MCB.24.10.4241-4254.2004. [DOI] [PMC free article] [PubMed] [Google Scholar]
- Lee CC, Chen WS, Chen CC, Chen LL, Lin YS, Fan CS, Huang TS. TCF12 protein functions as transcriptional repressor of E-cadherin, and its overexpression is correlated with metastasis of colorectal cancer. J Biol Chem. 2012;287:2798–2809. doi: 10.1074/jbc.M111.258947. [DOI] [PMC free article] [PubMed] [Google Scholar]
- Li R, Liang J, Ni S, Zhou T, Qing X, Li H, He W, Chen J, Li F, Zhuang Q, Qin B, Xu J, Li W, Yang J, Gan Y, Qin D, Feng S, Song H, Yang D, Zhang B, et al. A mesenchymal-to-epithelial transition initiates and is required for the nuclear reprogramming of mouse fibroblasts. Cell Stem Cell. 2010;7:51–63. doi: 10.1016/j.stem.2010.04.014. [DOI] [PubMed] [Google Scholar]
- Liu Q, Mao H, Nie J, Chen W, Yang Q, Dong X, Yu X. Transforming growth factor {beta}1 induces epithelial-mesenchymal transition by activating the JNK-Smad3 pathway in rat peritoneal mesothelial cells. Perit Dial Int. 2008;28(Suppl 3):S88–S95. [PubMed] [Google Scholar]
- Maeda M, Johnson KR, Wheelock MJ. Cadherin switching: essential for behavioral but not morphological changes during an epithelium-to-mesenchyme transition. J Cell Sci. 2005;118:873–887. doi: 10.1242/jcs.01634. [DOI] [PubMed] [Google Scholar]
- McDonald OG, Wu H, Timp W, Doi A, Feinberg AP. Genome-scale epigenetic reprogramming during epithelial-to-mesenchymal transition. Nat Struct Mol Biol. 2011;18:867–874. doi: 10.1038/nsmb.2084. [DOI] [PMC free article] [PubMed] [Google Scholar]
- Nawshad A, Lagamba D, Polad A, Hay ED. Transforming growth factor-beta signaling during epithelial-mesenchymal transformation: implications for embryogenesis and tumor metastasis. Cells Tissues Organs. 2005;179:11–23. doi: 10.1159/000084505. [DOI] [PubMed] [Google Scholar]
- Nieto MA. Epithelial-Mesenchymal Transitions in development and disease: old views and new perspectives. Int J Dev Biol. 2009;53:1541–1547. doi: 10.1387/ijdb.072410mn. [DOI] [PubMed] [Google Scholar]
- Nieto MA. The ins and outs of the epithelial to mesenchymal transition in health and disease. Annu Rev Cell Dev Biol. 2011;27:347–376. doi: 10.1146/annurev-cellbio-092910-154036. [DOI] [PubMed] [Google Scholar]
- Ohshima J, Haruta M, Arai Y, Kasai F, Fujiwara Y, Ariga T, Okita H, Fukuzawa M, Hata J, Horie H, Kaneko Y. Two candidate tumor suppressor genes, MEOX2 and SOSTDC1, identified in a 7p21 homozygous deletion region in a Wilms tumor. Genes Chromosom Cancer. 2009;48:1037–1050. doi: 10.1002/gcc.20705. [DOI] [PubMed] [Google Scholar]
- Oliva AA, Jr, Atkins CM, Copenagle L, Banker GA. Activated c-Jun N-terminal kinase is required for axon formation. J Neurosci. 2006;26:9462–9470. doi: 10.1523/JNEUROSCI.2625-06.2006. [DOI] [PMC free article] [PubMed] [Google Scholar]
- Ortega F, Berninger B, Costa MR. Primary culture and live imaging of adult neural stem cells and their progeny. Methods Mol Biol. 2013;1052:1–11. doi: 10.1007/7651_2013_22. [DOI] [PubMed] [Google Scholar]
- Perez-Pomares JM, Munoz-Chapuli R. Epithelial-mesenchymal transitions: a mesodermal cell strategy for evolutive innovation in Metazoans. Anat Rec. 2002;268:343–351. doi: 10.1002/ar.10165. [DOI] [PubMed] [Google Scholar]
- Pijnenborg R, Dixon G, Robertson WB, Brosens I. Trophoblastic invasion of human decidua from 8 to 18 weeks of pregnancy. Placenta. 1980;1:3–19. doi: 10.1016/s0143-4004(80)80012-9. [DOI] [PubMed] [Google Scholar]
- Plachta N, Bibel M, Tucker KL, Barde YA. Developmental potential of defined neural progenitors derived from mouse embryonic stem cells. Development. 2004;131:5449–5456. doi: 10.1242/dev.01420. [DOI] [PubMed] [Google Scholar]
- Postigo AA, Depp JL, Taylor JJ, Kroll KL. Regulation of Smad signaling through a differential recruitment of coactivators and corepressors by ZEB proteins. EMBO J. 2003;22:2453–2462. doi: 10.1093/emboj/cdg226. [DOI] [PMC free article] [PubMed] [Google Scholar]
- Potenta S, Zeisberg E, Kalluri R. The role of endothelial-to-mesenchymal transition in cancer progression. Br J Cancer. 2008;99:1375–1379. doi: 10.1038/sj.bjc.6604662. [DOI] [PMC free article] [PubMed] [Google Scholar]
- Psichari E, Balmain A, Plows D, Zoumpourlis V, Pintzas A. High activity of serum response factor in the mesenchymal transition of epithelial tumor cells is regulated by RhoA signaling. J Biol Chem. 2002;277:29490–29495. doi: 10.1074/jbc.M112368200. [DOI] [PubMed] [Google Scholar]
- Rosenbauer F, Owens BM, Yu L, Tumang JR, Steidl U, Kutok JL, Clayton LK, Wagner K, Scheller M, Iwasaki H, Liu C, Hackanson B, Akashi K, Leutz A, Rothstein TL, Plass C, Tenen DG. Lymphoid cell growth and transformation are suppressed by a key regulatory element of the gene encoding PU.1. Nat Genet. 2006;38:27–37. doi: 10.1038/ng1679. [DOI] [PubMed] [Google Scholar]
- Saito T. In vivo electroporation in the embryonic mouse central nervous system. Nat Protoc. 2006;1:1552–1558. doi: 10.1038/nprot.2006.276. [DOI] [PubMed] [Google Scholar]
- Sanchez-Tillo E, de Barrios O, Siles L, Amendola PG, Darling DS, Cuatrecasas M, Castells A, Postigo A. ZEB1 Promotes invasiveness of colorectal carcinoma cells through the opposing regulation of uPA and PAI-1. Clin Cancer Res. 2013;19:1071–1082. doi: 10.1158/1078-0432.CCR-12-2675. [DOI] [PubMed] [Google Scholar]
- Santangelo L, Marchetti A, Cicchini C, Conigliaro A, Conti B, Mancone C, Bonzo JA, Gonzalez FJ, Alonzi T, Amicone L, Tripodi M. The stable repression of mesenchymal program is required for hepatocyte identity: a novel role for hepatocyte nuclear factor 4alpha. Hepatology. 2011;53:2063–2074. doi: 10.1002/hep.24280. [DOI] [PMC free article] [PubMed] [Google Scholar]
- Santibanez JF. JNK mediates TGF-beta1-induced epithelial mesenchymal transdifferentiation of mouse transformed keratinocytes. FEBS Lett. 2006;580:5385–5391. doi: 10.1016/j.febslet.2006.09.003. [DOI] [PubMed] [Google Scholar]
- Schmidt M, Hellwig B, Hammad S, Othman A, Lohr M, Chen Z, Boehm D, Gebhard S, Petry I, Lebrecht A, Cadenas C, Marchan R, Stewart JD, Solbach C, Holmberg L, Edlund K, Kultima HG, Rody A, Berglund A, Lambe M, et al. A comprehensive analysis of human gene expression profiles identifies stromal immunoglobulin kappa C as a compatible prognostic marker in human solid tumors. Clin Cancer Res. 2012;18:2695–2703. doi: 10.1158/1078-0432.CCR-11-2210. [DOI] [PubMed] [Google Scholar]
- Shen H, Laird PW. Interplay between the cancer genome and epigenome. Cell. 2013;153:38–55. doi: 10.1016/j.cell.2013.03.008. [DOI] [PMC free article] [PubMed] [Google Scholar]
- Spath GF, Weiss MC. Hepatocyte nuclear factor 4 provokes expression of epithelial marker genes, acting as a morphogen in dedifferentiated hepatoma cells. J Cell Biol. 1998;140:935–946. doi: 10.1083/jcb.140.4.935. [DOI] [PMC free article] [PubMed] [Google Scholar]
- Tanaka-Okamoto M, Hori K, Ishizaki H, Hosoi A, Itoh Y, Wei M, Wanibuchi H, Mizoguchi A, Nakamura H, Miyoshi J. Increased susceptibility to spontaneous lung cancer in mice lacking LIM-domain only 7. Cancer Sci. 2009;100:608–616. doi: 10.1111/j.1349-7006.2009.01091.x. [DOI] [PMC free article] [PubMed] [Google Scholar]
- Thiery JP. Epithelial-mesenchymal transitions in tumour progression. Nat Rev Cancer. 2002;2:442–454. doi: 10.1038/nrc822. [DOI] [PubMed] [Google Scholar]
- Thiery JP, Sleeman JP. Complex networks orchestrate epithelial-mesenchymal transitions. Nat Rev Mol Cell Biol. 2006;7:131–142. doi: 10.1038/nrm1835. [DOI] [PubMed] [Google Scholar]
- Thiery JP, Acloque H, Huang RY, Nieto MA. Epithelial-mesenchymal transitions in development and disease. Cell. 2009;139:871–890. doi: 10.1016/j.cell.2009.11.007. [DOI] [PubMed] [Google Scholar]
- Tiwari N, Gheldof A, Tatari M, Christofori G. EMT as the ultimate survival mechanism of cancer cells. Semin Cancer Biol. 2012a;22:194–207. doi: 10.1016/j.semcancer.2012.02.013. [DOI] [PubMed] [Google Scholar]
- Tiwari VK, Stadler MB, Wirbelauer C, Paro R, Schubeler D, Beisel C. A chromatin-modifying function of JNK during stem cell differentiation. Nat Genet. 2012b;44:94–100. doi: 10.1038/ng.1036. [DOI] [PubMed] [Google Scholar]
- Tiwari N, Tiwari VK, Waldmeier L, Balwierz PJ, Arnold P, Pachkov M, Meyer-Schaller N, Schubeler D, van Nimwegen E, Christofori G. Sox4 is a master regulator of epithelial-mesenchymal transition by controlling Ezh2 expression and epigenetic reprogramming. Cancer Cell. 2013;23:768–783. doi: 10.1016/j.ccr.2013.04.020. [DOI] [PubMed] [Google Scholar]
- Tognon CE, Somasiri AM, Evdokimova VE, Trigo G, Uy EE, Melnyk N, Carboni JM, Gottardis MM, Roskelley CD, Pollak M, Sorensen PH. ETV6-NTRK3-mediated breast epithelial cell transformation is blocked by targeting the IGF1R signaling pathway. Cancer Res. 2011;71:1060–1070. doi: 10.1158/0008-5472.CAN-10-3096. [DOI] [PubMed] [Google Scholar]
- Trapnell C, Pachter L, Salzberg SL. TopHat: discovering splice junctions with RNA-Seq. Bioinformatics. 2009;25:1105–1111. doi: 10.1093/bioinformatics/btp120. [DOI] [PMC free article] [PubMed] [Google Scholar]
- Ullmann U, In’t Veld P, Gilles C, Sermon K, De Rycke M, Van de Velde H, Van Steirteghem A, Liebaers I. Epithelial-mesenchymal transition process in human embryonic stem cells cultured in feeder-free conditions. Mol Hum Reprod. 2007;13:21–32. doi: 10.1093/molehr/gal091. [DOI] [PubMed] [Google Scholar]
- Valcourt U, Thuault S, Pardali K, Heldin CH, Moustakas A. Functional role of Meox2 during the epithelial cytostatic response to TGF-beta. Mol Oncol. 2007;1:55–71. doi: 10.1016/j.molonc.2007.02.002. [DOI] [PMC free article] [PubMed] [Google Scholar]
- Walter MJ, Park JS, Ries RE, Lau SK, McLellan M, Jaeger S, Wilson RK, Mardis ER, Ley TJ. Reduced PU.1 expression causes myeloid progenitor expansion and increased leukemia penetrance in mice expressing PML-RARalpha. Proc Natl Acad Sci USA. 2005;102:12513–12518. doi: 10.1073/pnas.0504247102. [DOI] [PMC free article] [PubMed] [Google Scholar]
- Willis BC, Borok Z. TGF-beta-induced EMT: mechanisms and implications for fibrotic lung disease. Am J Physiol Lung Cell Mol Physiol. 2007;293:L525–L534. doi: 10.1152/ajplung.00163.2007. [DOI] [PubMed] [Google Scholar]
- Xu J, Lamouille S, Derynck R. TGF-beta-induced epithelial to mesenchymal transition. Cell Res. 2009;19:156–172. doi: 10.1038/cr.2009.5. [DOI] [PMC free article] [PubMed] [Google Scholar]
- Yang J, Dai C, Liu Y. A novel mechanism by which hepatocyte growth factor blocks tubular epithelial to mesenchymal transition. J Am Soc Nephrol. 2005;16:68–78. doi: 10.1681/ASN.2003090795. [DOI] [PubMed] [Google Scholar]
- Ying L, Chen Q, Wang Y, Zhou Z, Huang Y, Qiu F. Upregulated MALAT-1 contributes to bladder cancer cell migration by inducing epithelial-to-mesenchymal transition. Mol BioSyst. 2012;8:2289–2294. doi: 10.1039/c2mb25070e. [DOI] [PubMed] [Google Scholar]
- Yu L, Hebert MC, Zhang YE. TGF-beta receptor-activated p38 MAP kinase mediates Smad-independent TGF-beta responses. EMBO J. 2002;21:3749–3759. doi: 10.1093/emboj/cdf366. [DOI] [PMC free article] [PubMed] [Google Scholar]
- Zeisberg EM, Tarnavski O, Zeisberg M, Dorfman AL, McMullen JR, Gustafsson E, Chandraker A, Yuan X, Pu WT, Roberts AB, Neilson EG, Sayegh MH, Izumo S, Kalluri R. Endothelial-to-mesenchymal transition contributes to cardiac fibrosis. Nat Med. 2007a;13:952–961. doi: 10.1038/nm1613. [DOI] [PubMed] [Google Scholar]
- Zeisberg M, Yang C, Martino M, Duncan MB, Rieder F, Tanjore H, Kalluri R. Fibroblasts derive from hepatocytes in liver fibrosis via epithelial to mesenchymal transition. J Biol Chem. 2007b;282:23337–23347. doi: 10.1074/jbc.M700194200. [DOI] [PubMed] [Google Scholar]
- Zhang YE. Non-Smad pathways in TGF-beta signaling. Cell Res. 2009;19:128–139. doi: 10.1038/cr.2008.328. [DOI] [PMC free article] [PubMed] [Google Scholar]
Associated Data
This section collects any data citations, data availability statements, or supplementary materials included in this article.
Supplementary Materials
Supplementary Information
Review Process File