

Abstract
Studies have demonstrated that catechin, an antioxidant found in tea, can reduce the bioavailability of folate. Because periconceptional folic acid intake has been demonstrated to reduce the risk of spina bifida, tea consumption may put pregnant women at risk because of its possible antifolate properties. Using data collected in the Slone Epidemiology Center Birth Defects Study, we examined whether tea consumption during early pregnancy was associated with an increased risk of spina bifida. Mothers of 518 spina bifida cases and 6424 controls were interviewed within 6 months after delivery about pregnancy events and exposures. Data on tea intake were collected during three periods (1976–1988–1998–2005 and 2009–2010). Logistic regression models were used to calculate odds ratios (ORs) and 95% confidence intervals (CIs), adjusted for study center. Intake of both periconceptional food folate and diet and supplemental folic acid were examined as a potential effect modifier. For 1976 to 1988, ORs were not elevated for daily tea intake. For 1998 and onward, ORs were also close to 1.0, but there was a modest increase for those who drank more than 3 cups/day (OR, 1.92; 95% CI, 0.84–4.38). Among women with total folic acid intake greater than 400 μg, consumption of 3 cups or more of tea per day was associated with an increased risk of spina bifida in 1976 to 1988 (OR, 2.04; 95% CI, 0.69–7.66) and in the later periods (OR, 3.13; 95% CI, 0.87–11.33). Our data do not support an overall association between tea consumption and spina bifida, but there is a suggestion of a possible interaction between higher levels of folic acid intake and tea consumption.
Keywords: spina bifida, tea consumption, catechins, folic acid, birth defects
INTRODUCTION
Tea is a widely consumed beverage and has been studied extensively for its possible health effects. A number of studies have found tea consumption to be associated with lower risks of coronary heart disease (Hodgson, 2008; Ruxton, 2008; Tijburg et al., 1997), certain cancers (Blot et al., 1996; Kohlmeier et al., 1997; Ruxton, 2008), stroke (Larsson et al., 2008; Arab et al., 2009; Hollman et al., 2010), bone loss (Gardner et al., 2006; Devine et al., 2007), and dental caries (Ruxton, 2008). It is believed that catechin, an antioxidant found in tea, may be responsible for some of these health benefits (Navarro-Perán et al., 2005; Alemdaroglu et al., 2007). The quantity of catechins can vary by how the tea was manufactured, with unfermented teas (green tea) having the highest levels, followed by semifermented teas (oolong tea) and fully fermented teas (black and red teas) having the lowest levels (Wang et al., 2000). Catechins have been found in vitro to inhibit the enzyme dihydrofolate reductase (DHFR), which reduces the inactive form of folate to the active form, leading to a depletion of bioavailable folate (Navarro-Perán et al., 2005, 2007). The inhibition of DHFR may also lead to decreased intestinal uptake of folate, because DHFR plays a role in intestinal absorption of folate (Alemdaroglu et al., 2007). In addition, catechins are structurally similar to the chemotherapy agents methotrexate and aminopterin, both of which are known folate antagonist and inhibitors of DHFR (Fry and Jackson, 1987; Berman and Werbel, 1991; Longo-Sorbello and Bertino, 2001; Navarro-Perán et al., 2005; Alemdaroglu et al., 2007).
Studies in pregnant women have found that higher levels of tea consumption were associated with lower serum folate concentrations (Matsuzaki et al., 2008; Shiraishi et al., 2010). Because periconceptional folic acid intake reduces the risk of neural tube defects (MRC Vitamin Study Research Group, 1991; Czeizel and Dudas, 1992; Berry et al., 1999), tea consumption may put pregnant women at risk because of its possible antifolate properties. The three studies that have examined tea intake have found that the risk of neural tube defects as increased for tea drinkers compared with nondrinkers (Fedrick, 1974; Correa et al., 2000; Ye et al., 2011).
Using data collected in the Boston University Slone Epidemiology Center Birth Defects Study, we tested the hypothesis that tea consumption during pregnancy was associated with an increased risk of spina bifida (SB).
MATERIALS AND METHODS
The Slone Epidemiology Center Birth Defects Study (also known as the Pregnancy Health Interview Study) is an ongoing, multicenter, case-control study that began in 1976 and has been described in detail (Mitchell et al., 1981; Werler et al., 1999; Louik et al., 2007). Cases were identified through review of admission and discharge lists and by contacting newborn nurseries and labor and delivery rooms in birth hospitals and tertiary care centers in the areas around Boston, Massachusetts (1976–1998), Philadelphia, Pennsylvania (1976–2010), San Diego, California (2001–2010), Toronto, Canada (1976–2005), selected counties in Iowa (1983–1985), and from birth defect registries in the states of New York (2004–2010) and Massachusetts (1998–2010). Beginning in 1990, fetal deaths after 20 weeks’ gestation and therapeutic abortions after 12 weeks’ gestation were eligible for the study if identified, although they were not routinely ascertained by study staff.
Cases of SB were excluded if they had a conjoined twin, chromosomal anomaly, Mendelian inherited disorder, a known syndrome, amniotic bands, or a body wall defect. Cases were further classified as isolated if they had no other major structural malformation. Starting in 1993, infants with no major malformation were identified from the same birth populations as the cases and were enrolled in the study as nonmalformed controls. For the years before 1993, cases with only minor malformations (e.g., hip clicks, toe anomalies) or nonstructural defects (e.g., cystic fibrosis) were used as controls for the present analysis.
Trained nurses conducted in-person interviews within 6 months of delivery until 1998 and thereafter by telephone. The interview included questions on sociodemographic factors, illnesses during pregnancy, details of prescription and over-the-counter medications used (including vitamins), reproductive history, behavioral risk factors (e.g., smoking, alcohol intake), and tea and coffee consumption; questions on diet were added beginning in 1988. The present study focuses on the three time periods (1976–1988–1998–2005 and 2009–2010) when data on the average number of cups of tea consumed per day were collected in the interview (Fig. 1). In the earlier years of the study, any tea consumption in the first 4 months of pregnancy was ascertained, but no specific dates were obtained. To keep the exposure window consistent across all years of the study, we examined tea intake during the first 4 months of pregnancy in this analysis. For the years 1988 and onward, dietary intake was assessed using a modified 58-item Willett Food Frequency Questionnaire (FFQ). Women were asked about their dietary intake in the 6 months preceding pregnancy to capture diet early in gestation, when the neural tube closes and before a woman is aware of her pregnancy and can change her eating habits.
Figure 1.
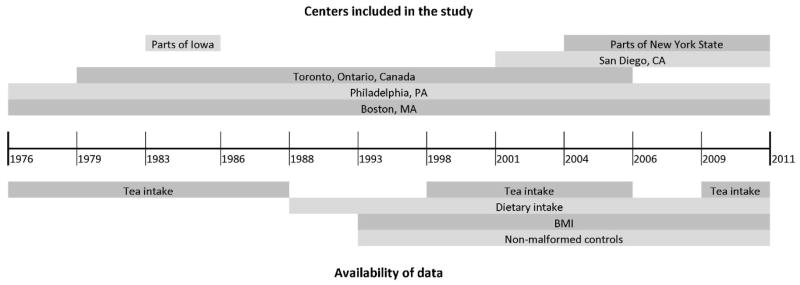
Availability of selected data items in the Slone Epidemiology Center Birth Defects Study, 1976–2011.
Odds ratios (ORs) and 95% confidence intervals (CIs) were calculated using logistic regression models. Sociodemographic factors that were considered as potential confounders include: maternal race or ethnicity (non-Hispanic White, non-Hispanic Black, other race), maternal age (<20, 20–24, 25–29, 30–34, _35 years), maternal education (<12 years, 12 years, > 12 years), study center (Boston, Philadelphia, Toronto, Iowa, San Diego, and New York), use of vitamin-containing folic acid in the 2 months before or one month after the last menstrual period (none, inconsistent use; consistent use defined as ≥4 days/week in 2 of the 3 months), and body mass index based on prepregnancy weight and height for years it was available (<18.5, 18.5–24.9, 25–29.9, and ≥30); this last variable became available in 1993. Variables that changed estimates by more than 10% were kept in the final model.
Periconceptional total folic acid intake from either vitamin supplementation or diet (available only for 1998 data onward) was examined as a potential effect modifier. For each participant, total folic acid intake was calculated by taking the average daily amount of folic acid from fortified foods and adding it to the average daily amount of folic acid from vitamins taken in the first lunar month after the last menstrual period. Natural folate from the diet was also included, but we reduced it by 30% because of the lower bioavailability of natural folate compared with synthetic folic acid (Institute of Medicine, 1998). All dietary values were adjusted for total caloric intake using the residual energy adjustment method (Willett, 1998). Because dietary data were available only from 1988 onward, total folic acid intake for 1976 to 1987 was based solely on folic acid from dietary supplements. Categories were defined by total folic acid intake (<400 and ≥400μg/day). Subjects with extreme daily caloric intakes (<500 or >4000) or incomplete FFQs (three or more missing items) were excluded, although two exceptions were made: women who reported ≥400μg of daily folic acid from vitamin supplements or reported not taking any supplements containing folic acid were retained in the analysis. The former group were retained because daily users of folate-containing vitamins would fall into the ≥400μg /day stratum regardless of their FFQ responses; and based on previous studies, the latter group of nonusers would not likely reach the ≥400μg /day stratum from diet alone (Tinker et al., 2010); therefore, they were retained in the <400μg /day stratum. All analyses were performed using SAS 9.1 software (SAS Institute, Cary, NC).
RESULTS
From 1976 to 1988, there were a total of 379 SB cases and 1149 controls with minor malformations. The participation rate in the earlier years was 87% for all mothers contacted, while in the later years it was 66% for all cases, which included SB, and 58% for the nonmalformed controls. In the years after 1997, there were 139 SB cases and 5275 nonmalformed controls. Distributions of sociodemographic and behavioral factors are presented in Table 1. Because of small numbers in 2009 to 2010, the two latter periods were combined in subsequent analyses.
Table 1.
Maternal Demographic and Behavioral Characteristics of Spina Bifida Cases and Controls, Birth Defects Study: 1976–1988, 1998–2005, 2009–2010
| 1976–1988
|
1998–2005
|
2009–2010
|
||||||||||
|---|---|---|---|---|---|---|---|---|---|---|---|---|
| Spina Bifida Cases | Controls* | Spina Bifida Cases | Controls* | Spina Bifida Cases | Controls* | |||||||
|
|
|
|
||||||||||
| No. | % | No. | % | No. | % | No. | % | No. | % | No. | % | |
|
|
|
|
||||||||||
| Total | 379 | 100% | 1149 | 100% | 113 | 100% | 4630 | 100% | 26 | 100% | 645 | 100% |
| Maternal race/ethnicity | ||||||||||||
| White, non-Hispanic | 365 | 96.3% | 1104 | 96.1% | 80 | 70.7% | 3462 | 74.8% | 12 | 46.2% | 416 | 64.5% |
| Black, non-Hispanic | 4 | 1.1% | 30 | 2.6% | 8 | 7.8% | 304 | 6.6% | 4 | 15.4% | 53 | 8.2% |
| Other races | 10 | 2.6% | 15 | 1.3% | 25 | 21.6% | 863 | 18.6% | 10 | 38.5% | 173 | 26.8% |
| Hispanic† | 5 | 2.5%‡ | 5 | 1.2%‡ | 13 | 11.2% | 550 | 11.9% | 9 | 34.6% | 111 | 17.2% |
| Missing data | 0 | 0.0% | 0 | 0.0% | 0 | 0.0% | 1 | 0.0% | 0 | 0.0% | 3 | 0.5% |
| Maternal age at conception | ||||||||||||
| < 20 years | 27 | 7.1% | 50 | 4.4% | 3 | 2.7% | 330 | 7.1% | 6 | 23.1% | 35 | 5.4% |
| 20–24 years | 119 | 31.4% | 291 | 25.3% | 14 | 12.4% | 587 | 12.7% | 4 | 15.4% | 108 | 16.7% |
| 25–29 years | 136 | 35.9% | 457 | 39.8% | 46 | 40.7% | 1147 | 24.8% | 7 | 26.9% | 195 | 30.2% |
| 30–34 years | 85 | 22.4% | 288 | 25.1% | 34 | 30.1% | 1653 | 35.7% | 4 | 15.4% | 200 | 31.0% |
| 35–39 years | 11 | 2.9% | 56 | 4.9% | 15 | 13.3% | 789 | 17.0% | 4 | 15.4% | 85 | 13.2% |
| ≥ 40 years | 1 | 0.3% | 7 | 0.6% | 1 | 0.9% | 114 | 2.5% | 1 | 3.8% | 21 | 3.3% |
| Missing data | 0 | 0.0% | 0 | 0.0% | 0 | 0.0% | 10 | 0.2% | 0 | 0.0% | 1 | 0.2% |
| Maternal education | ||||||||||||
| < 12years | 55 | 14.5% | 124 | 10.8% | 14 | 12.4% | 376 | 8.1% | 4 | 15.4% | 51 | 7.9% |
| 12 years | 171 | 45.1% | 423 | 36.8% | 20 | 17.7% | 854 | 18.4% | 8 | 30.8% | 123 | 19.1% |
| > 12 years | 152 | 40.1% | 602 | 52.4% | 79 | 69.9% | 3397 | 73.4% | 14 | 53.8% | 469 | 72.7% |
| Missing data | 1 | 0.3% | 0 | 0.0% | 0 | 0.0% | 3 | 0.1% | 0 | 0.0% | 2 | 0.3% |
| Maternal smoking | ||||||||||||
| Never / Ex-smoker | 233 | 61.5% | 671 | 58.4% | 91 | 80.5% | 3816 | 82.4% | 21 | 80.8% | 537 | 83.3% |
| Smoked during pregnancy | 114 | 30.1% | 388 | 33.8% | 11 | 9.7% | 404 | 8.7% | 4 | 15.4% | 52 | 8.1% |
| Smoked before known to be pregnant | 32 | 8.4% | 90 | 7.8% | 11 | 9.7% | 409 | 8.8% | 1 | 3.8% | 56 | 8.7% |
| Unknown | 0 | 0.0% | 0 | 0.0% | 0 | 0.0% | 1 | 0.0% | 0 | 0.0% | 0 | 0.0% |
| Study center (years in study) | ||||||||||||
| Boston (1976+) | 63 | 16.6% | 265 | 23.1% | 15 | 13.3% | 2968 | 64.1% | 2 | 7.7% | 163 | 25.3% |
| Philadelphia (1976+) | 173 | 45.6% | 546 | 47.5% | 36 | 31.9% | 639 | 13.8% | 14 | 53.8% | 202 | 31.3% |
| Toronto (1979–2005) | 131 | 34.6% | 214 | 18.6% | 54 | 47.8% | 604 | 13.0% | -- | -- | -- | -- |
| Iowa (1983–1985) | 12 | 3.2% | 124 | 10.8% | -- | -- | -- | -- | -- | -- | -- | -- |
| San Diego (2001+) | -- | -- | -- | -- | 7 | 6.2% | 415 | 9.0% | 3 | 11.5% | 160 | 24.8% |
| New York (2004+) | -- | -- | -- | -- | 1 | 0.9% | 4 | 0.1% | 7 | 26.9% | 120 | 18.6% |
| Periconceptional folic acid use** | ||||||||||||
| Nonuser | 211 | 55.7% | 594 | 51.7% | 28 | 24.8% | 979 | 21.1% | 11 | 42.3% | 124 | 19.2% |
| Consistent user | 52 | 13.7% | 189 | 16.4% | 58 | 51.3% | 2031 | 43.9% | 6 | 23.1% | 266 | 41.2% |
| Inconsistent user | 116 | 30.6% | 366 | 31.9% | 27 | 23.9% | 1620 | 35.0% | 9 | 34.6% | 255 | 39.5% |
| Pre-pregnancy maternal body mass index, kg/m2^ | ||||||||||||
| < 18.5 | -- | -- | -- | -- | 1 | 0.9% | 292 | 6.3% | 1 | 3.8% | 22 | 3.4% |
| 18.5– < 25 | -- | -- | -- | -- | 59 | 52.2% | 2901 | 62.7% | 9 | 34.6% | 394 | 61.1% |
| 25– <30 | -- | -- | -- | -- | 26 | 23.0% | 886 | 19.1% | 6 | 23.1% | 134 | 20.8% |
| ≥ 30 | -- | -- | -- | -- | 21 | 18.6% | 470 | 10.2% | 9 | 34.6% | 76 | 11.8% |
| Missing data | -- | -- | -- | -- | 6 | 5.3% | 81 | 1.7% | 1 | 3.8% | 19 | 2.9% |
From 1976 to 1988, cases with minor malformations were used as controls; for 1998 onward, nonmalformed controls are included.
Hispanic ethnicity was ascertained from 1983 onward.
The percentage is based on total number of cases and controls from 1983 to 1988.
Periconceptional use included the 2 lunar months before or 1 month after the last menstrual period.
Information on pre-pregnancy body mass index was only available from 1993 onwards.
Tea drinking was more common in the years 1976 to 1988, with 66% of women reporting any tea consumption compared to 39% drinking tea in the later years, which is consistent with previous reports (Lopez-Garcia et al., 2006; Duffey and Popkin, 2007). Daily tea drinking rates were similar among mothers of SB cases (45.2%) and controls (46.1%) in the earlier years; while in the later years, mothers of SB cases (15.8%) reported more daily tea intake than controls (9.9%). Among the sociodemographic factors examined as potential confounders, only study center met the criterion for confounding (i.e., addition of the variable caused more than a 10% change in the estimate) and was retained in the final model. Adjusted ORs were consistent with the null for daily tea drinking in the earlier period of the study (Table 2), although the point estimates were suggestive of an increasingly protective association with increasing tea consumption, with an adjusted OR of 0.74 for those who drank ≥3 cups/day (95% CI, 0.52–1.05). For the years after 1997, adjusted ORs were close to 1.0 for <1cup/day and 1 to 2 cups/day; among those who drank ≥3 cups/day, we observed an OR of almost 2, but the estimate was imprecise (95% CI, 0.84–4.38). When the data were restricted to isolated cases of SB, the results did not change substantially (data not shown).
Table 2.
Association between Early Tea Consumption and Spina Bifida, Birth Defects Study, 1976–1988, 1998–2005, 2009–2010
| Cases | Controls* | Crude | Adjusted† | |||||
|---|---|---|---|---|---|---|---|---|
|
|
|
|
||||||
| N | % | N | % | OR | 95% CI | OR | 95% CI | |
|
|
|
|
||||||
| 1976–1988 | ||||||||
| No Tea | 128 | 33.8% | 393 | 34.2% | Ref | -- | Ref | -- |
| <1cup/day | 80 | 21.1% | 226 | 19.7% | 1.09 | 0.79, 1.50 | 0.95 | 0.68, 1.32 |
| 1–2 cups/day | 109 | 28.8% | 321 | 27.9% | 1.04 | 0.78, 1.40 | 0.86 | 0.64, 1.17 |
| 3+ cups/day | 62 | 16.4% | 209 | 18.2% | 0.91 | 0.64, 1.29 | 0.74 | 0.52, 1.05 |
| 1998–2005, 2009–2010 | ||||||||
| No Tea | 73 | 52.5% | 3218 | 61.0% | Ref | -- | Ref | -- |
| <1cup/day | 44 | 31.7% | 1536 | 29.1% | 1.26 | 0.86, 1.85 | 0.98 | 0.66, 1.44 |
| 1–2 cups/day | 15 | 10.8% | 442 | 8.4% | 1.50 | 0.85, 2.63 | 0.96 | 0.54, 1.72 |
| 3+ cups/day | 7 | 5.0% | 79 | 1.5% | 3.91 | 1.74, 8.76 | 1.92 | 0.84, 4.38 |
From 1976–1988 cases with minor malformations were used as controls, for 1998 onwards non-malformed controls were used
Adjusted for center (referent: Boston)
OR, odds ratios; CI, confidence interval; Ref, referent.
When the data were examined by strata of average daily total folic acid intake, ORs were elevated for women who reported ≥400 μg /day of total folic acid (Table 3). In the years 1976 to 1988, ORs were 2.86 (95% CI, 1.07–7.66), 2.34 (95% CI, 0.91–6.00), and 2.04 (95% CI, 0.69–7.66) for women who reported tea intakes of <1, 1 to 2, and ≥3 cups, respectively. In the years after 1998, ORs were elevated only for women who drank ≥3 cups/day (OR, 3.13; 95% CI, 0.87–11.33). A subanalysis restricting the exposure window to the first two lunar months of pregnancy was conducted for the 139 cases and corresponding controls in the later years when more detailed information on tea intake was available; elevated risks remained for the highest category of tea consumption in both folic acid strata (data not shown).
Table 3.
Association between Tea Intake and Spina Bifida Stratified by Total Folic Acid Intake and Study Years, Birth Defects Study, 1976–1988, 1998–2005, 2009–2010
| Total folic acid <400μg/day^
|
Total folic acid ≥ 400μg/day^
|
|||
|---|---|---|---|---|
| Cases / Controls* | Adjusted† OR (95%CI) | Cases / Controls* | Adjusted† OR (95%CI) | |
|
| ||||
| 1976–1988 | ||||
| No Tea | 108 / 292 | Ref | 9 / 53 | Ref |
| <1cup/day | 58 / 169 | 0.76 (0.52, 1.12) | 13 / 27 | 2.86 (1.07, 7.66) |
| 1–2 cups/day | 87 / 234 | 0.77 (0.55, 1.09) | 15 / 36 | 2.34 (0.91, 6.00) |
| 3+ cups/day | 49 / 161 | 0.62 (0.42, 0.93) | 8 / 22 | 2.04 (0.69, 7.66) |
| 1998–2005, 2009–2010 | ||||
| No Tea | 33 / 1533 | Ref | 37 / 1630 | Ref |
| <1cup/day | 20 / 737 | 0.99 (0.56, 1.76) | 22 / 783 | 0.94 (0.55, 1.63) |
| 1–2 cups/day | 9 / 237 | 1.16 (0.54, 2.52) | 6 / 196 | 0.84 (0.35, 2.06) |
| 3+ cups/day | 4 / 51 | 1.71 (0.57, 5.13) | 3 / 25 | 3.13 (0.87, 11.33) |
From 1976–1988 cases with minor malformations were used as controls, for 1998 onwards non-malformed controls were used
Adjusted for center (referent: Boston)
Total folic acid was calculated by adding folic acid from supplement or diet (1988+) to natural folate, which was discounted by 30%
OR, odds ratio; CI, confidence interval; Ref, referent
DISCUSSION
Our data do not support the hypothesis that tea consumption overall increases the risk of SB. No increased risk was seen in the earlier years of data at any level of tea intake, and in the later years only the highest level of intake had an elevated risk. An increased risk was observed only among women with daily average intake of 400 μg or more of total folic acid. In the early years, risks were twofold or greater for any level of tea consumption, while in the later years, the only elevation was observed for ≥3 cups/day, and that estimate was unstable.
The antifolate properties of tea may provide an explanation for why we see differing risks when we stratify by folic acid levels and time period. For the purposes of discussion, we considered three different levels of total folic acid intake: low, medium, and high. Although no formal level of folic acid has been defined as sufficient, most studies found that ≥400 μg /day reduced the risk of neural tube defects (CDC et al., 1992; Werler et al., 1993; Berry et al., 1999); therefore, we considered our “low” group to consist of women who reported <400 μg/day. Women in this group may have already been at increased risk of SB from folate insufficiency; therefore, additional reductions in folate metabolites by catechins in tea may confer no additional risk and could explain the lack of elevated ORs in the <400 μg/day category. The “medium” level group would be represented by the data in the earlier years in the ≥400 μg/day stratum. These women were not exposed to folic acid fortification and, in its absence, likely have folic acid levels that are only slightly above the 400 μg/day recommendation. Because these women have borderline sufficient levels of folic acid, any amount of tea intake could interfere with the folate pathways and lead to insufficient levels, consequently increasing the risk of SB. This is the group where we might expect the effects of tea to be most harmful and for which we see a twofold increase in risk for all levels of tea consumption. The “high” group would be represented by women in the ≥400 μg/day stratum during years following fortification. In combination with supplementation, these women would likely have folic acid levels well in excess of the recommended amount. To reduce total folic acid levels below the threshold for neural tube defect (NTD) prevention, tea consumption would have needed to be high, which might explain why we observed an elevated (albeit unstable) estimate for only the highest level of tea intake.
The antifolate property of catechins is the hypothesized mechanism by which tea may increase the risk of SB and provides an explanation for why an association was limited to those with higher levels of total folic acid intake in this study. In vitro studies have shown that catechins can lead to the inhibition of folate conversion to its active form and decreased intestinal absorption (Navarro-Perán et al., 2005, 2007; Alemdaroglu et al., 2007). Observational studies conducted in pregnant women have found that serum folate levels are lower in women who consume tea. One study found that pregnant women who consumed ≥4 cups/day of green tea were more likely to have low serum folate levels (Matsuzaki et al., 2008). Another study found significantly reduced serum folate levels in pregnant women who consumed high levels of green or oolong tea, but not black tea (Shiraishi et al., 2010). A randomized cross-over study was conducted in which participants were given different doses of folic acid with water, green tea, and black tea (Alemdaroglu et al., 2008). When serum folate levels were compared over 8 hours, a reduction was seen when folic acid was taken with green or black tea compared to water. The reduction was observed regardless of folic acid dose, and a larger reduction was seen for green tea, which has higher catechin levels compared with black tea. The increasing popularity of green tea, along with its higher levels of catechins, might explain the stronger association we observed in the more recent years of our study.
The three studies that have examined the association between tea and NTDs have found positive associations. The first was conducted in 1969 to examine the possibility that tea consumption increased the risk of anencephaly in Great Britain (Fedrick, 1974). The author found that mothers of anencephalic cases were significantly more likely than control mothers to report drinking ≥3 cups/day of tea. The second study used the Atlanta Birth Defects Case-Control Study and included mothers who gave birth between 1968 and 1980 (Correa et al., 2000). The authors found that ORs for SB and tea consumption were 2.1 (95% CI, 1.1–4.0) and 2.8 (95% CI, 1.4–5.6) for 1 to 2 cups/day and ≥3 cups/day, respectively. They also considered anencephaly cases, but found no association with tea. The third study considered tea as a risk factor for NTDs in Northern China and found an increased risk for mothers who reported daily tea drinking compared with nondrinkers in both the SB (OR, 3.4; 95% CI, 1.2–7.9) and anencephalic groups (OR, 3.1; 95% CI, 1.4–8.5; Ye et al., 2011). This study also stratified by folic acid supplementation and did not observe an increased risk in the supplemented group; however, folic acid supplementation rates were low and there were no daily tea drinkers in the supplemented group.
There were some limitations to our study. The quantity of catechins can vary by tea type, manufacturing processes, and preparation methods, but we did not have detailed information on the type of tea that participants consumed or the way in which it was prepared (e.g., bag vs. free leaves, steeping time; Graham, 1992; Arts et al., 2000). In addition, we did not have information on other sources of catechins (e.g., wine, chocolate). In the earlier years of the study, before 1989, we could not include dietary sources of folate or folic acid in our calculations; however, the contributions of folic acid from diet would likely have been small, because fortification of the food supply was not in place during those years.
The strengths of this study are its large size and use of multiple centers that represent geographically distinct areas where patterns of tea drinking differed. The short interval between delivery and interview was an additional strength of this study, because it reduces the concern regarding reporting accuracy. In addition, because tea intake was not a known risk factor, reporting accuracy would not likely have differed between cases and controls.
The findings of this study add to the previous literature on tea intake and SB. In our data, we did not find an overall increased risk associated with tea intake; however, there was the suggestion of an interaction between tea intake and folic acid intakes that were in the range of 400 μg/day, possibly because of the antifolate properties of tea. The effect of tea on folic acid bioavailability needs further study to better understand our findings.
Acknowledgments
Supported by the Centers for Disease Control and Prevention (DD000697).
We thank Dawn Jacobs, Fiona Rice, Rita Krolak, Kathleen Sheehan, Claire Coughlin, Moira Quinn, Nancy Rodriguez, Carolina Tejedor Meyers, and Nastia Dynkin for their assistance in data collection and computer programming, and all the mothers who participated in the study.
Footnotes
Presented at the 24th Annual Meeting of the Society for Pediatric and Perinatal Epidemiology Research, June 21, 2011, Montreal, Canada, and at the 7th International Conference on Neural Tube Defects, November 8, 2011, Austin, Texas.
The findings and conclusions in this report are those of the authors and do not necessarily represent the official position of the Centers for Disease Control and Prevention.
References
- Alemdaroglu NC, Dietz U, Wolffram S, et al. Influence of green and black tea on folic acid pharmacokinetics in healthy volunteers: potential risk of diminished folic acid bioavailability. Biopharm Drug Dispos. 2008;29:335–348. doi: 10.1002/bdd.617. [DOI] [PubMed] [Google Scholar]
- Alemdaroglu NC, Wolffram S, Boissel J, et al. Inhibition of folic acid uptake by catechins and tea extracts in Caco-2 cells. Planta Med. 2007;73:27. doi: 10.1055/s-2006-951745. [DOI] [PubMed] [Google Scholar]
- Arab L, Liu W, Elashoff D, et al. Green and black tea consumption and risk of stroke: a meta-analysis. Stroke. 2009;40:1786. doi: 10.1161/STROKEAHA.108.538470. [DOI] [PubMed] [Google Scholar]
- Arts ICW, van de Putte B, Hollman PCH, et al. Catechin contents of foods commonly consumed in The Netherlands. 1. Fruits, vegetables, staple foods, and processed foods. J Agric Food Chem. 2000;48:1746–1751. doi: 10.1021/jf000025h. [DOI] [PubMed] [Google Scholar]
- Berman EM, Werbel LM. The renewed potential for folate antagonists in contemporary cancer chemotherapy. J Med Chem. 1991;34:479–485. doi: 10.1021/jm00106a001. [DOI] [PubMed] [Google Scholar]
- Berry RJ, Li Z, Erickson JD, et al. Prevention of neural-tube defects with folic acid in China. N Engl J Med. 1999;341:1485–1490. doi: 10.1056/NEJM199911113412001. [DOI] [PubMed] [Google Scholar]
- Blot W, Chow W, McLaughlin J, et al. Tea and cancer: a review of the epidemiological evidence. Eur J Cancer Prev. 1996;5:425. [PubMed] [Google Scholar]
- CDC. Recommendations for the use of folic acid to reduce the number of cases of spina bifida and other neural tube defects. MMWR Morbidity and Mortality Weekly Report. 1992;41:1–7. [PubMed] [Google Scholar]
- Correa A, Stolley A, Liu Y, et al. Prenatal tea consumption and risks of anencephaly and spina bifida. Ann Epidemiol. 2000;10:476–477. doi: 10.1016/s1047-2797(00)00144-7. [DOI] [PubMed] [Google Scholar]
- Czeizel AE, Dudas I. Prevention of the first occurrence of neuraltubedefects by periconceptional vitamin supplementation. N Engl J Med. 1992;327:1832–1835. doi: 10.1056/NEJM199212243272602. [DOI] [PubMed] [Google Scholar]
- Devine A, Hodgson JM, Dick IM, et al. Tea drinking is associated with benefits on bone density in older women. Am J Clin Nutr. 2007;86:1243. doi: 10.1093/ajcn/86.4.1243. [DOI] [PubMed] [Google Scholar]
- Duffey KJ, Popkin BM. Shifts in patterns and consumption of beverages between 1965 and 2002. Obesity. 2007;15:2739–2747. doi: 10.1038/oby.2007.326. [DOI] [PubMed] [Google Scholar]
- Fedrick J. Anencephalus and maternal tea drinking: evidence for a possible association. Proc R Soc Med. 1974;67:356. doi: 10.1177/003591577406700513. [DOI] [PMC free article] [PubMed] [Google Scholar]
- Fry DW, Jackson RC. Biological and biochemical properties of new anticancer folate antagonists. Cancer Metastasis Rev. 1987;5:251–270. doi: 10.1007/BF00047000. [DOI] [PubMed] [Google Scholar]
- Gardner E, Ruxton C, Leeds A, et al. Black tea—helpful or harmful? A review of the evidence. Eur J Clin Nutr. 2006;61:3–18. doi: 10.1038/sj.ejcn.1602489. [DOI] [PubMed] [Google Scholar]
- Graham HN. Green tea composition, consumption, and polyphenol chemistry. Prev Med. 1992;21:334–350. doi: 10.1016/0091-7435(92)90041-f. [DOI] [PubMed] [Google Scholar]
- Hodgson JM. Tea flavonoids and cardiovascular disease. Asia Pac J Clin Nutr. 2008;17(Suppl 1):288–290. [PubMed] [Google Scholar]
- Hollman PCH, Geelen A, Kromhout D, et al. Dietary flavonol intake may lower stroke risk in men and women. J Nutr. 2010;140:600. doi: 10.3945/jn.109.116632. [DOI] [PubMed] [Google Scholar]
- Institute of Medicine. Dietary reference intakes for thiamin, riboflavin, niacin, vitamin B6, folate, vitamin B12, pantothenic acid, biotin, and choline. National Academies Press; Washington DC: 1998. [PubMed] [Google Scholar]
- Kohlmeier L, Weterings K, Steck S, et al. Tea and cancer prevention: an evaluation of the epidemiologic literature. Nutr Cancer. 1997;27:1. doi: 10.1080/01635589709514494. [DOI] [PubMed] [Google Scholar]
- Larsson SC, Männistö S, Virtanen MJ, Kontto J, Albanes D, Virtamo J. Coffee and tea consumption and risk of stroke subtypes in male smokers. Stroke. 2008;39:1681–1687. doi: 10.1161/STROKEAHA.107.504183. [DOI] [PubMed] [Google Scholar]
- Longo-Sorbello G, Bertino JR. Current understanding of methotrexate pharmacology and efficacy in acute leukemias. Use of newer antifolates in clinical trials. Haematologica. 2001;86:121. [PubMed] [Google Scholar]
- Lopez-Garcia E, van Dam RM, Rajpathak S, et al. Changes in caffeine intake and long-term weight change in men and women. Am J Clin Nutr. 2006;83:674–680. doi: 10.1093/ajcn.83.3.674. [DOI] [PubMed] [Google Scholar]
- Louik C, Lin AE, Werler MM, et al. First-trimester use of selective serotonin-reuptake inhibitors and the risk of birth defects. N Engl J Med. 2007;356:2675–2683. doi: 10.1056/NEJMoa067407. [DOI] [PubMed] [Google Scholar]
- Matsuzaki M, Haruna M, Ota E, et al. Dietary folate intake, use of folate supplements, lifestyle factors, and serum folate levels among pregnant women in Tokyo, Japan. J Obstet Gynaecol Res. 2008;34:971–979. doi: 10.1111/j.1447-0756.2008.00821.x. [DOI] [PubMed] [Google Scholar]
- Mitchell AA, Rosenberg L, Shapiro S, et al. Birth defects related to Bendectin use in pregnancy. I. Oral clefts and cardiac defects. JAMA. 1981;245:2311–2314. [PubMed] [Google Scholar]
- MRC Vitamin Study Research Group. Prevention of neural tube defects: Results of the Medical Research Council Vitamin Study. Lancet. 1991;338:131–137. [PubMed] [Google Scholar]
- Navarro-Perán E, Cabezas-Herrera J, Campo LS, Rodríguez-López JN. Effects of folate cycle disruption by the green tea polyphenol epigallocatechin-3-gallate. Int J Biochem Cell Biol. 2007;39:2215–2225. doi: 10.1016/j.biocel.2007.06.005. [DOI] [PubMed] [Google Scholar]
- Navarro-Perán E, Cabezas-Herrera J, García-Cánovas F, Durrant MC, Thorneley RNF, Rodríguez-López JN. The antifolate activity of tea catechins. Cancer Res. 2005;65:2059. doi: 10.1158/0008-5472.CAN-04-3469. [DOI] [PubMed] [Google Scholar]
- Ruxton C. Black tea and health. Nutrition Bulletin. 2008;33:91–101. [Google Scholar]
- Shiraishi M, Haruna M, Matsuzaki M, Ota E, Murayama R, Murashima S. Association between the serum folate levels and tea consumption during pregnancy. Biosci Trends. 2010;4:225–230. [PubMed] [Google Scholar]
- Tijburg L, Mattern T, Folts J, et al. Tea flavonoids and cardiovascular diseases: a review. Crit Rev Food Sci Nutr. 1997;37:771–785. doi: 10.1080/10408399709527802. [DOI] [PubMed] [Google Scholar]
- Tinker SC, Cogswell ME, Devine O, et al. Folic acid intake among US women aged 15–44 years, National Health and Nutrition Examination Survey, 2003–2006. Am J Prev Med. 2010;38:534–542. doi: 10.1016/j.amepre.2010.01.025. [DOI] [PubMed] [Google Scholar]
- Wang H, Provan GJ, Helliwell K, et al. Tea flavonoids: their functions, utilisation and analysis. Trends Food Sci Technol. 2000;11:152–160. [Google Scholar]
- Werler MM, Hayes C, Louik C, et al. Multivitamin supplementation and risk of birth defects. Am J Epidemiol. 1999;150:675–682. doi: 10.1093/oxfordjournals.aje.a010070. [DOI] [PubMed] [Google Scholar]
- Werler MM, Shapiro S, Mitchell AA, et al. Periconceptional folic acid exposure and risk of occurrent neural tube defects. Obstet Gynecol Surv. 1993;48:528. [PubMed] [Google Scholar]
- Willett W. Nutritional Epidemiology. 2. New York: Oxford University Press; 1998. [Google Scholar]
- Ye R, Ren A, Zhang L, et al. Tea drinking as a risk factor for neural tube defects in Northern China. Epidemiology. 2011;22:491. doi: 10.1097/EDE.0b013e31821b4526. [DOI] [PubMed] [Google Scholar]